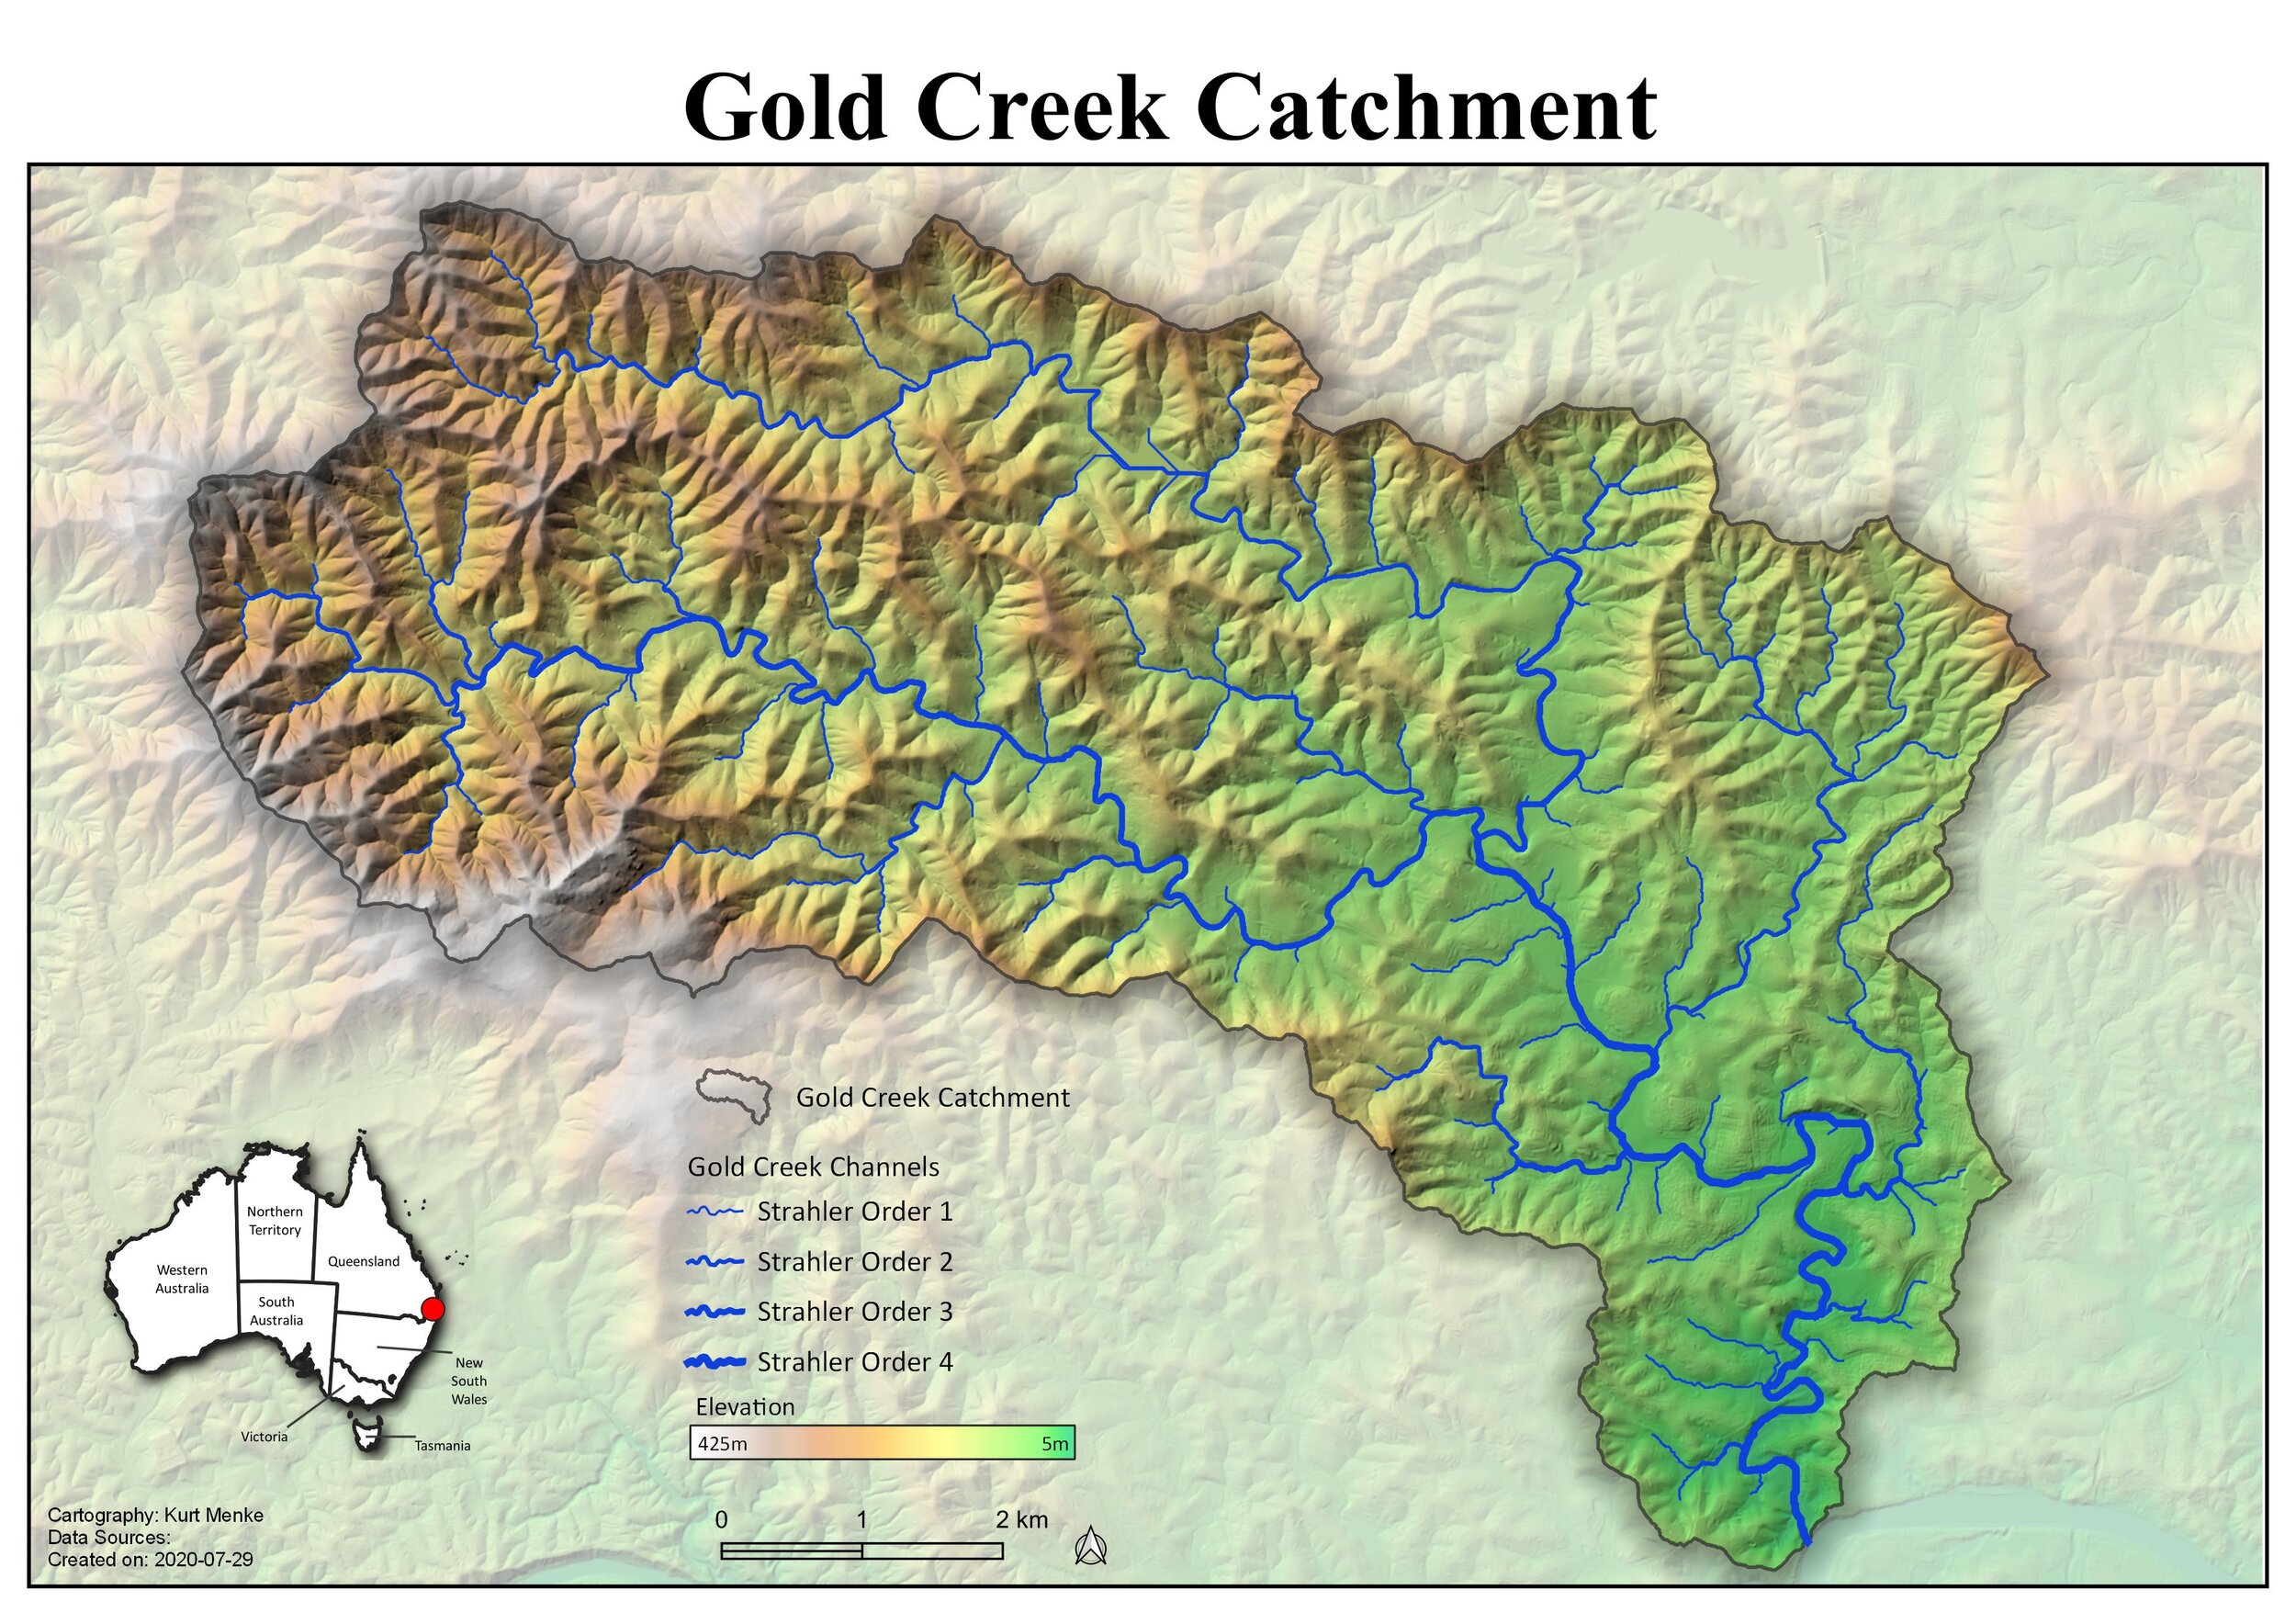
The starting point for this course will be the completion of a catchment delineation analysis. Here you'll learn how to take the final data and make a beautiful map showcasing the results. First you’ll learn some symbology tricks. Then you will then learn the basics of setting up a print composition with standard map elements such as a scale bar, north arrow, legend and locator map. By the end of the course you will have produced an attractive map of the catchment in QGIS and learned some tricks along the way.
Styling DEMs, rivers, catchments and landmarks
Adding Labels
Focusing attention on the catchment
Setting up a basic print layout
Adding standard map elements
Using Expressions to enhance the layout
Adding a locator map
Exporting the final product
Aug 27 - 16:00 - 18:00 Australian Eastern Standard Time (AEST)

