QGIS and Visualization of Data
Aug
27
12:00 AM00:00

QGIS and Visualization of Data

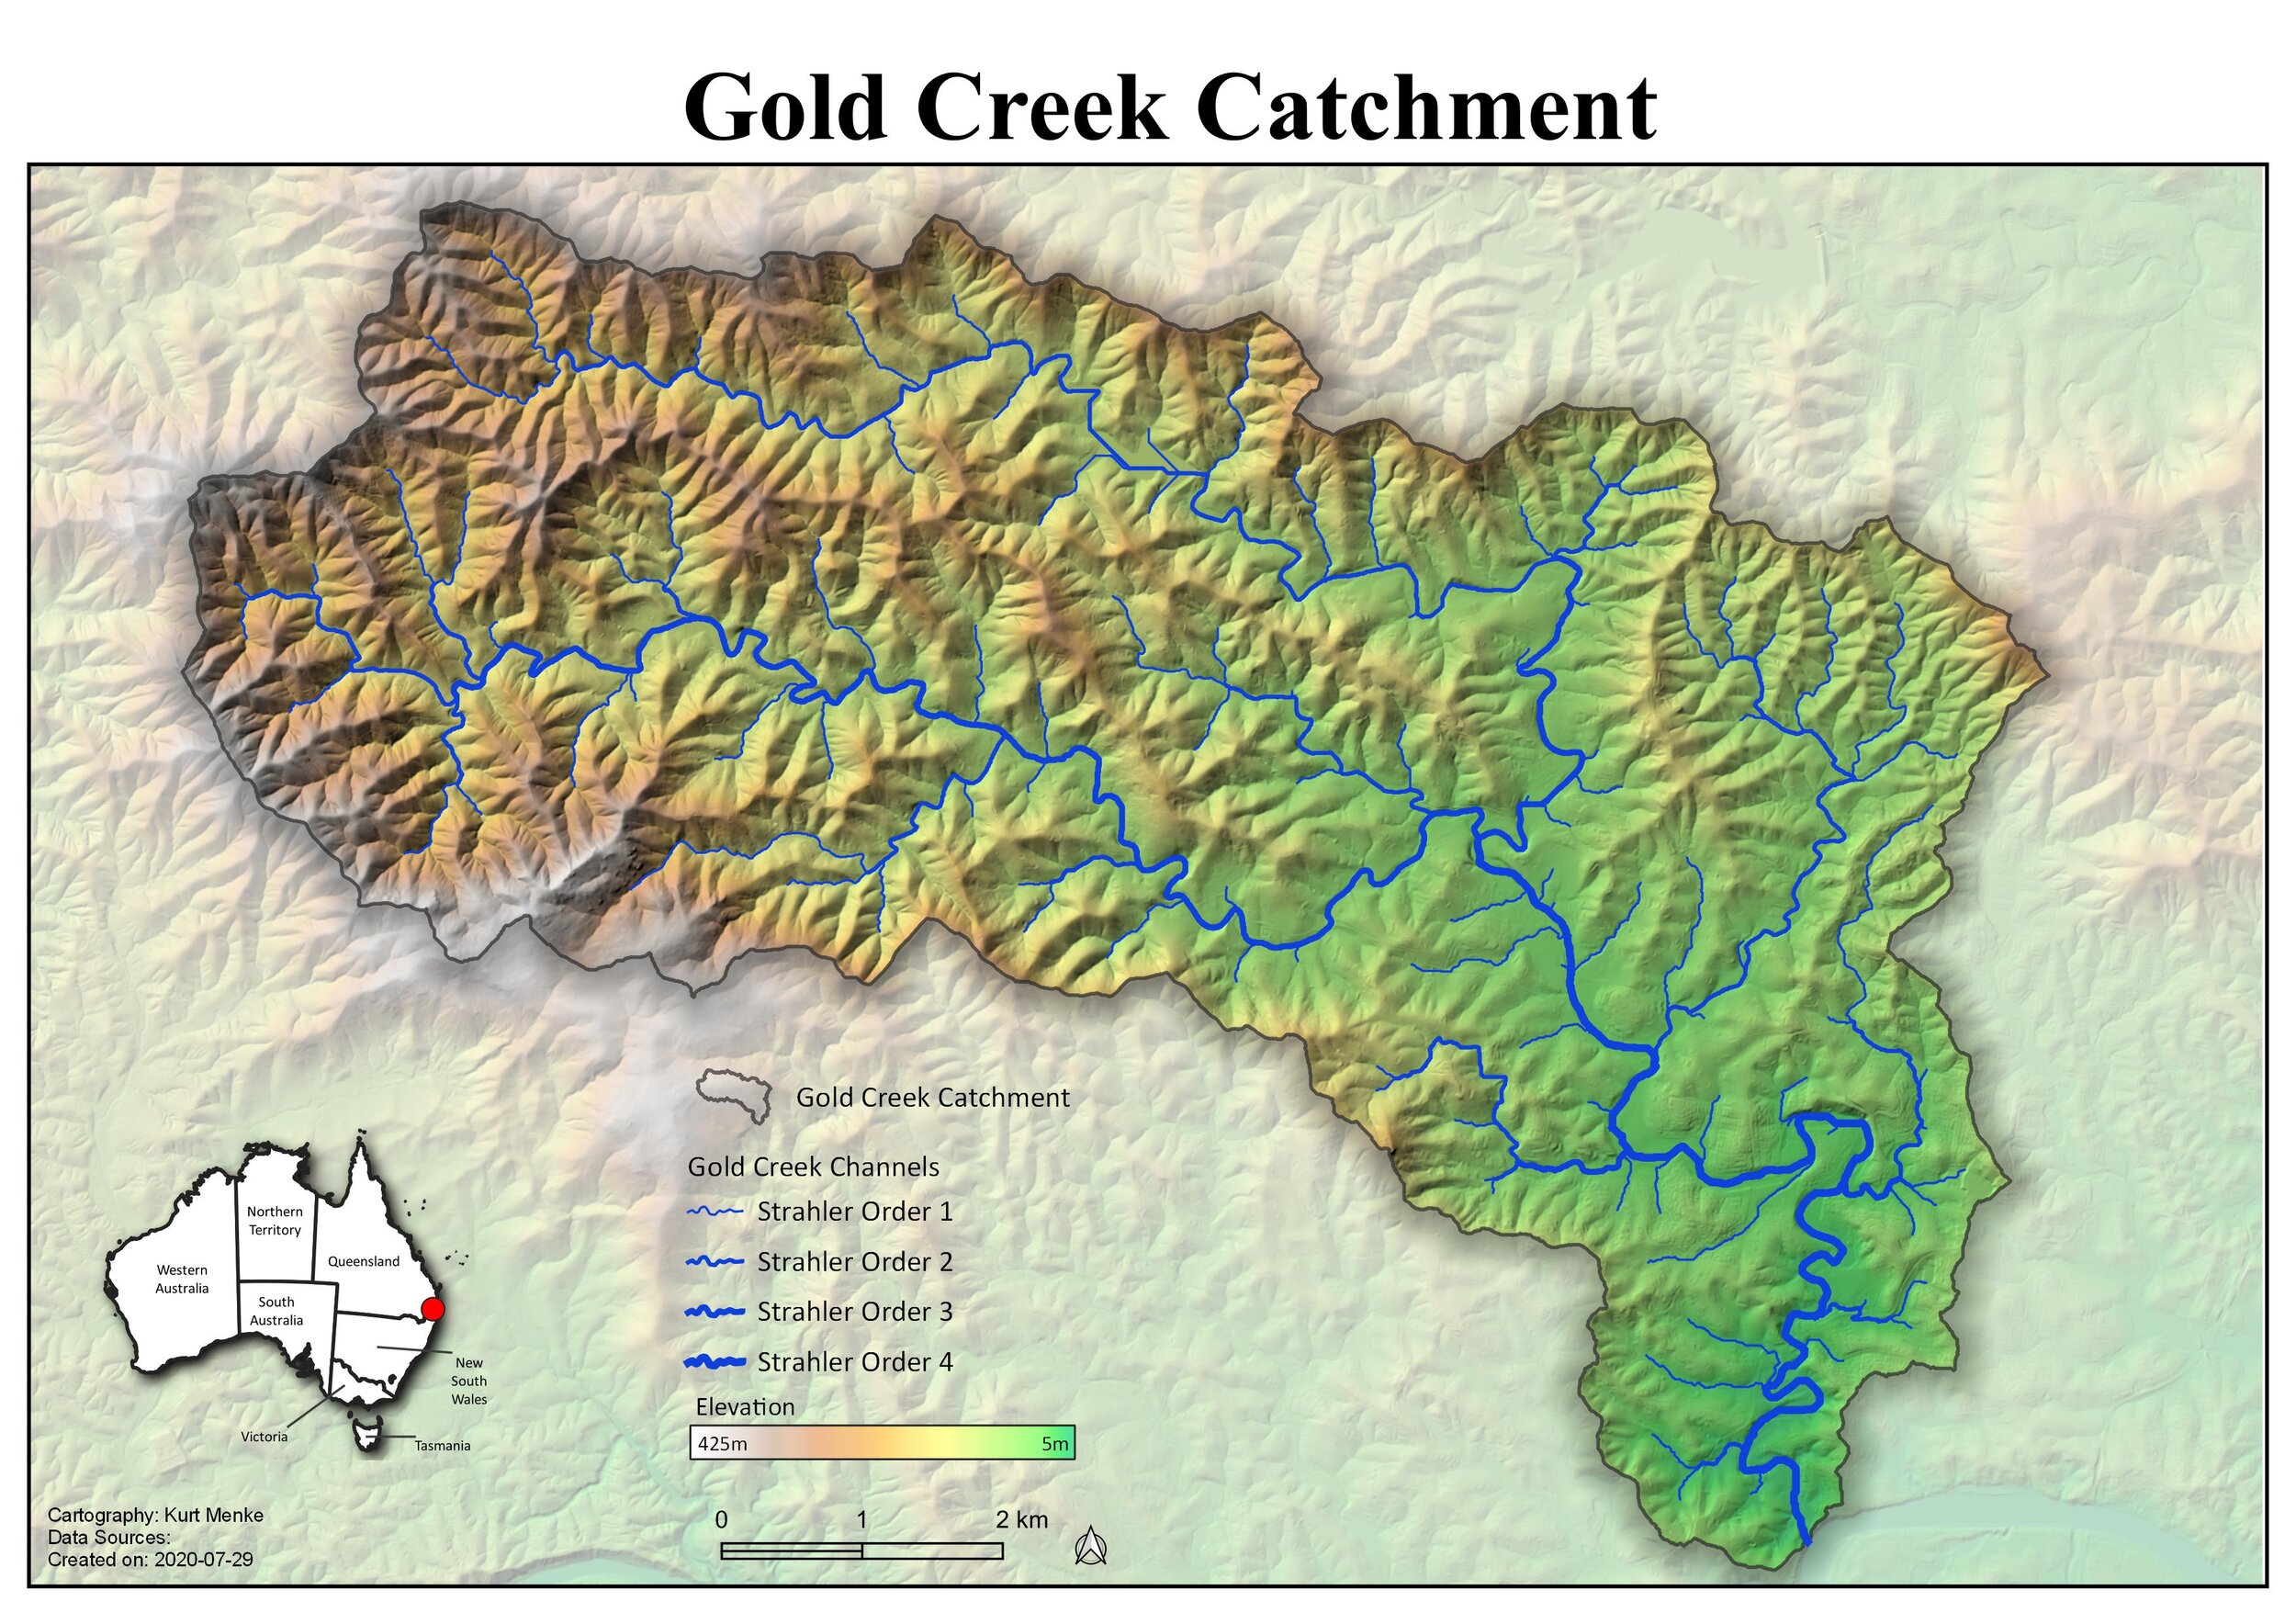
The starting point for this course will be the completion of a catchment delineation analysis. Here you'll learn how to take the final data and make a beautiful map showcasing the results. First you’ll learn some symbology tricks. Then you will then learn the basics of setting up a print composition with standard map elements such as a scale bar, north arrow, legend and locator map. By the end of the course you will have produced an attractive map of the catchment in QGIS and learned some tricks along the way.

  • Styling DEMs, rivers, catchments and landmarks

  • Adding Labels

  • Focusing attention on the catchment

  • Setting up a basic print layout

  • Adding standard map elements

  • Using Expressions to enhance the layout

  • Adding a locator map

  • Exporting the final product 

Aug 27 - 16:00 - 18:00 Australian Eastern Standard Time (AEST)

View Event →
Collecting Data Using the Free & Open Source Software: Input and QGIS
Aug
21
12:00 PM12:00

Collecting Data Using the Free & Open Source Software: Input and QGIS

There are two new options for field data collection related to QGIS named Input/Mergin and QField, and both will be introduced in this webinar. Each app runs on both iOS and Android. Since they are free to use, offer great functionality, and can be used on any platform, they are the recommended field data collection apps for Community Health Mappers. Due to time constraints, this webinar will focus on Input. You will see how to set up a typical data collection form using QGIS. You will also learn to use the Mergin plugin to move data back and forth between a computer and a mobile device. Sample data will be collected and, Mergin will again be used to bring the data into QGIS where we’ll map it. This webinar will be recorded and made available via YouTube.

Register Here

View Event →
Mapping COVID-19 with QGIS
Aug
14
12:00 PM12:00

Mapping COVID-19 with QGIS

This one hour webinar teaches how to map the COVID-19 pandemic using free data and open source software. The presentation begins with an introduction to Community Health Maps, a program to empower underserved populations with free mapping tools. Community Health Maps case studies will demonstrate the successful use of these tools. The remainder focuses on downloading and mapping COVID-19 data using QGIS, the world’s leading open source desktop GIS software. By the end of the webinar you will know how to download data, import the data into QGIS, symbolize it, and make a map of COVID-19 cases per one million people by county. This webinar will be recorded and made available via YouTube.

Register Here

View Event →
QGIS for preparing and visualising hydrological data
Aug
5
12:00 AM00:00

QGIS for preparing and visualising hydrological data

1 hour program:
- 10mins: Krey Price from Surfacewater Solutions, will moderate the conversation, and introduce the topic.
- 15mins: Johannes van der Kwast from IHE Delft Institute for Water Education, will share catchment delineation steps and the results and explain which tools were used.
- 15mins: Kurt Menke from Bird's Eye View, will share and explain engaging QGIS hydrological data visualisation materials.
- 20mins: live Q&A with Saber Razmjooei from Lutra Consulting and all speakers.

View Event →
Data Visualization and Cartography with QGIS
Jun
12
11:00 AM11:00

Data Visualization and Cartography with QGIS

This workshop will explore the wide range of data visualization and cartographic options available in QGIS 3. QGIS has seen remarkable growth in it's cartographic capacities in recent years. You will learn many techniques unique to QGIS such as: use of inverted polygon shapeburst fills, blending modes, live layer effects and geometry generator symbol layers. We will also work with animating time based data, 3D views and Mesh data. If you want to take your map creation skills to the next level - this is the perfect workshop for you!

View Event →
QGIS:  Advanced
May
26
5:00 PM17:00

QGIS: Advanced

Learn advanced data visualization techniques only available in QGIS such as Blending Modes, Live Layer Effects, working with the Time Manager, Geometry generators, implementing expression based symbology and working with Mesh data. Learn how features such as Editing in Place and Editing widgets can lead to more efficient workflows. Create animations in the new 3D environment. Learn how to use the Processing Modeler to automate workflows. Work with linear networks to find the shortest route. Process raster data and work with hydrologic modeling tools. QGIS certification included in registration fee. Prerequisite: QGIS: Intermediate. Required Text: Discover QGIS 3.x ‐ https://locatepress.com/dq3

View Event →
QGIS: Intermediate
Apr
14
to Apr 23

QGIS: Intermediate

  • UNM Continuing Education (map)
  • Google Calendar ICS

Move beyond the basics of QGIS and learn how to use Plugins, add basemaps to QGIS Desktop. Create joins, work with selections, develop new attribute columns, create and populate a SpatiaLite and GeoPackage databases, georeference imagery, edit vector data, and use the Processing Toolbox to geoprocess data. Geoprocessing tools to be introduced include clip, dissolve, buffer, hillshade, slope and aspect. QGIS certification included in registration fee. Prerequisite: QGIS: Beginning. Required Text: Discover QGIS 3.x ‐ https://locatepress.com/dq3

View Event →
QGIS: Beginning
Mar
31
to Apr 9

QGIS: Beginning

  • UNM Continuing Education (map)
  • Google Calendar ICS

Explore QGIS, the leading open source desktop software and discover how it's being used to solve real world problems. Get an introduction to the QGIS project and QGIS Desktop. Changes in the new 3.x line will be highlighted. Learn about adding data, working with vector and raster data, styling data, working with coordinate reference systems, and using the Print Composer to create maps. Also find out about help resources and installation options. QGIS certification fee included in registration fee. Required Text: Discover QGIS 3.x ‐ https://locatepress.com/dq3

View Event →
Masterclass in Cartography with QGIS
Sep
23
9:00 AM09:00

Masterclass in Cartography with QGIS

This workshop will be a tour of the wide range of data visualization and cartographic options now available in QGIS 3.x. During the day you will learn many techniques unique to QGIS such as: use of inverted polygon shapeburst fills, blending modes, live layer effects and geometry generator symbol layers. Tips and tricks will be covered as we move through the day. If you want to take your map creation skills to the next level - this is the perfect workshop for you! Topics covered include:

  • Cartography in QGIS

  • Generating Atlases

  • Working with labels

  • Use cases for Live Layer Effects

  • Use cases for Blending modes

  • Expression based symbology

  • Inverted polygon shapeburst fills

  • Mapping Geotagged Photos

  • Geometry generators

  • Using Data Plotly plugin to create graphs

  • Rendering point data

  • 2.5D & 3D

  • Working with the Time Manager plugin

  • Working with Mesh data

View Event →
FOSS4G - NA
Apr
16
to Apr 19

FOSS4G - NA

  • MARINA VILLAGE CONFERENCE CENTER (map)
  • Google Calendar ICS

I will be giving three talks:

  • Open Source in Higher Education

  • Implications of Time and Geography on Social and Clinical Determinants of Antibiotic Resistant Infections in Children Living in Atlanta

  • The Very Best New Features of QGIS v3.x

View Event →
Sep
17
to Dec 6

GIS 2020: Trends in Geospatial Tech...aka Introduction to Open Source GIS

  • CNM Advanced Technology Center (map)
  • Google Calendar ICS

Introduces Open Source software for both desktop and internet GIS applications.  Introduces the concepts of Open Source software, and the leading desktop mapping Open Source software packages. In the course you will learn QGIS and become familiar with working with GRASS GIS, GDAL/OGR, SpatiaLite, and PostGIS.

View Event →
Data Visualization and Cartography in QGIS
Jul
15
9:00 AM09:00

Data Visualization and Cartography in QGIS

This workshop will be a tour of the wide range of data visualization and cartographic options now available in QGIS. QGIS has seen remarkable growth in these areas in recent years. During the day you will learn many techniques unique to QGIS such as: use of inverted polygon shapeburst fills, blending modes, live layer effects, virtual layers, and geometry generator symbol layers. We will begin with layer styling, labeling and basic map layout (including atlases). We will then move into more advanced topics. Tips and tricks will be covered as we move through the day. If you want to take your map creation skills to the next level - this is the perfect workshop for you!

View Event →
Data Visualization & Cartography in QGIS
May
17
10:00 AM10:00

Data Visualization & Cartography in QGIS

This workshop will be a tour of the wide range of data visualization/styling and cartographic techniques now available in QGIS 3. QGIS has seen remarkable growth in these areas in recent years. Tips and tricks will be covered as we work through a series of data visualization exercises. Topics covered will include: working with labels, use cases for blending modes, live layer effects, atlas generation, virtual layers, animating temporal data via the Time Manager plugin, and creating 3D views. Along the way many of the new renderers will be covered such as geometry generators, inverted polygons, 2.5D, heatmap, and point clustering and displacement. If you want to take QGIS to the next level and create stunning graphics, this workshop is for you.

View Event →
The Very Best New Features of QGIS v3.0
May
14
2:30 PM14:30

The Very Best New Features of QGIS v3.0

Come and see a tour of the best features of QGIS 3.0. I work as a consultant on a variety of projects. I am also currently working on the 3rd Edition of Mastering QGIS which is focused on version 3. So I've already worked with this latest major release extensively. There are a ton of new features. In this talk I will cover the very best new features including aspects of the new Layout engine, the Geoprocessing environment, GUI enhancements, new data visualization features, useful shortcuts and other miscellaneous features. Come learn how to get the most out of this major new release!

View Event →