At Least 10 Reasons You Should Be Using QGIS

Last Friday I gave a talk at the spring New Mexico Geographic Information Council (NMGIC) meeting. There were ~100 people in attendance. I asked at the outset for people to raise their hands if ArcGIS was their primary GIS software. About 95 people raised their hands! I then asked who used QGIS as their primary GIS. About 2.5 people raised their hands. One person wasn't super confident. Since the topic of the meeting was remote sensing and UAV's I asked if anyone used something different for their work day-to-day. Two others raised their hands. Suffice to say it was an ESRI-centric group of mostly standard desktop users from local, state and federal govt, with some private industry and academics. A broad slice of the local GIS community. 

Since I mostly interact with the FOSS4G/GeoHipster/#gistribe choir, it's easy to forget that the majority of GIS workers in the US still haven't used software like QGIS. Nor do many have the permission to install it. That is changing, but there are still many who have just played with it on the weekend once or twice.

C-hkyCsUMAAeKFY.jpg

So I thought I'd share my experience and go through the main points of my talk. I've done this before at NMGIC. I do something similar every couple of years. But there was something different this time. For whatever reason the message really resonated this time. Even among the die-hard esri users. Maybe it was the animated gif's I used this time around, maybe it was because I used a lot of examples of the cool data visualization capabilities QGIS now has, or maybe people are fed up with esri licensing. I heard a lot about the latter prior to speaking. Anyway I felt like I finally broke through and it was fun. 

First I asked if there were any Mac users in the audience. At least 30 hands went up.

#1) Run QGIS Anywhere

Install it on Windows, Max OS X and Linux. I even have it running on my Chromebook thanks to Alasdair Rae's post. Then there is QField for Android. Plus it is 64 bit and has been for quite awhile. It is fast and boots up quickly.

#2) Interoperability!

QGIS reads/writes a silly number of file formats. This is where I first found a place for it in my day-to-day. Someone gives you KML/KMZ, GPX, data in a spreadsheet? No problem, and converting that into something more useful like GeoJSON is simple. Esri users can sleep soundly knowing they can read/write File Gdb's. The added ability to work with Spatialite, GeoPackages and PostGIS are perhaps the most important reason to use QGIS, as Mike Miller recently covered in this post

#3) 148 Basemaps Available!

I'll admit I was going for instant gratification. I was the second to last talk of the day and people would be tired. But when you compare this to the 12 that ArcMap has, and consider those 12 are part of the 148, it makes an impression on an esri user. These are available via the QuickMapServices plugin when the contributed pack is enabled.

#4) Geoprocessing!

Back to a more serious topic. This has long been the strength of QGIS. When you combine the ~900 tools in the Processing Toolbox, the batch processing capability, the Graphical Modeler and the Python Console it's a serious package. If you then work with PostGIS and/or R, which are practically fully functional GIS's in their own right, it's state of the art. 

#5) Semi-automatic Classification Plugin

I was trying to cater to the remote sensing crowd. But seriously this is just about the most impressive plugin in the fleet.

  • Download: Landsat | Sentinal-2 | ASTER | MODIS.
  • Dropdown band combination styling
  • Unsupervised and Supervised Classification
  • Spectral signature plots etc. 

There's a great introductory video of the capabilities. If you have 20 minutes it's well worth the watch. 

#6) Variables

I have come to love these. Store any constant. Make the variable Global, Project level or Layer level. I use them to store conversion factors: square meters to acres, meters to miles etc. Store your name as cartographer and use them in the Print Composer. The gif below shows using them in an acreage calculation. It also shows how easy it is to calc fields in an attribute table. Across the board QGIS requires fewer clicks than ArcGIS. 

#7) Cartography | Data Visualization | Styling

This used to be the weakness and now it's a strength. Most of the features I highlighted can't be found in Arc. What I tell people is that several years ago I had a list in my head of things you can do in Arc that you can't in QGIS. Now I have the opposite list and it's growing. Most of the following are on it. The color picker is crazy good. Warning...this section is a little long, and I don't even get into the Print Composer or Atlas generation, which have improved greatly.

The Interactive Styling Dock created by Nathan Woodrow is addictive and I now can't live without it. Tinker with colors and see if they'll work immediately. Works for labels too. If you haven't used it, check it out.

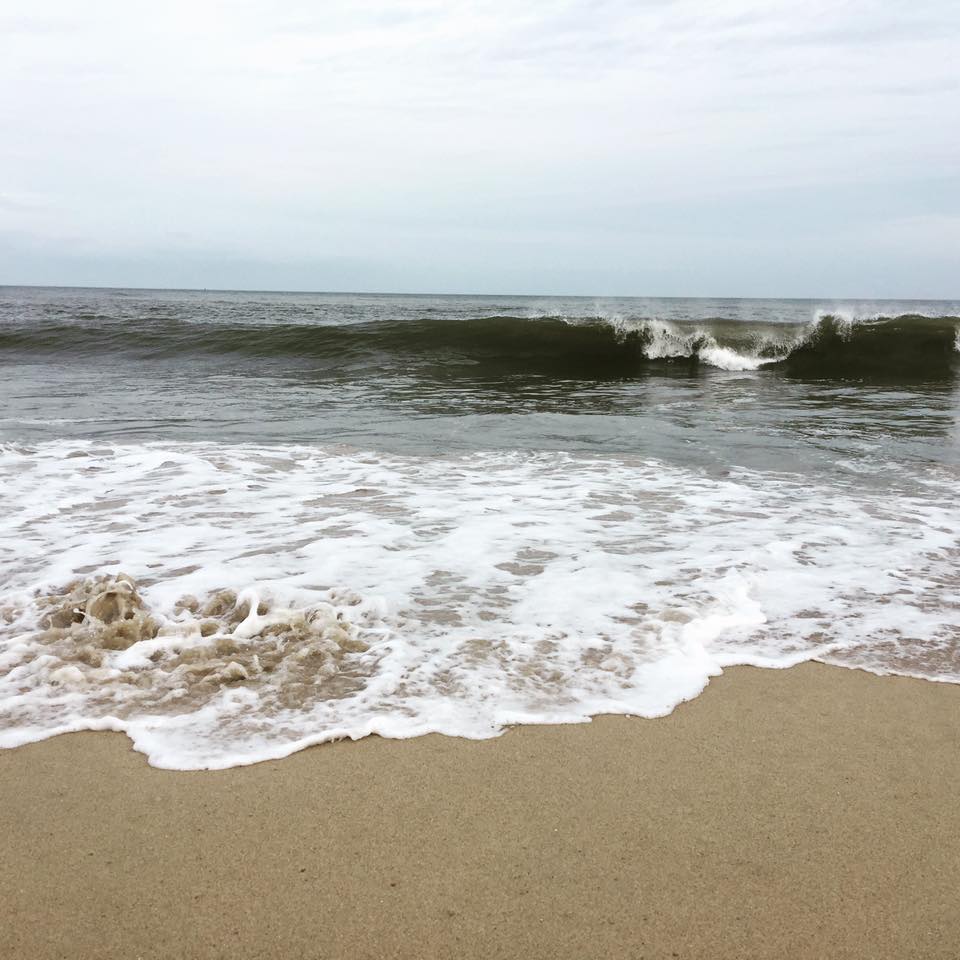
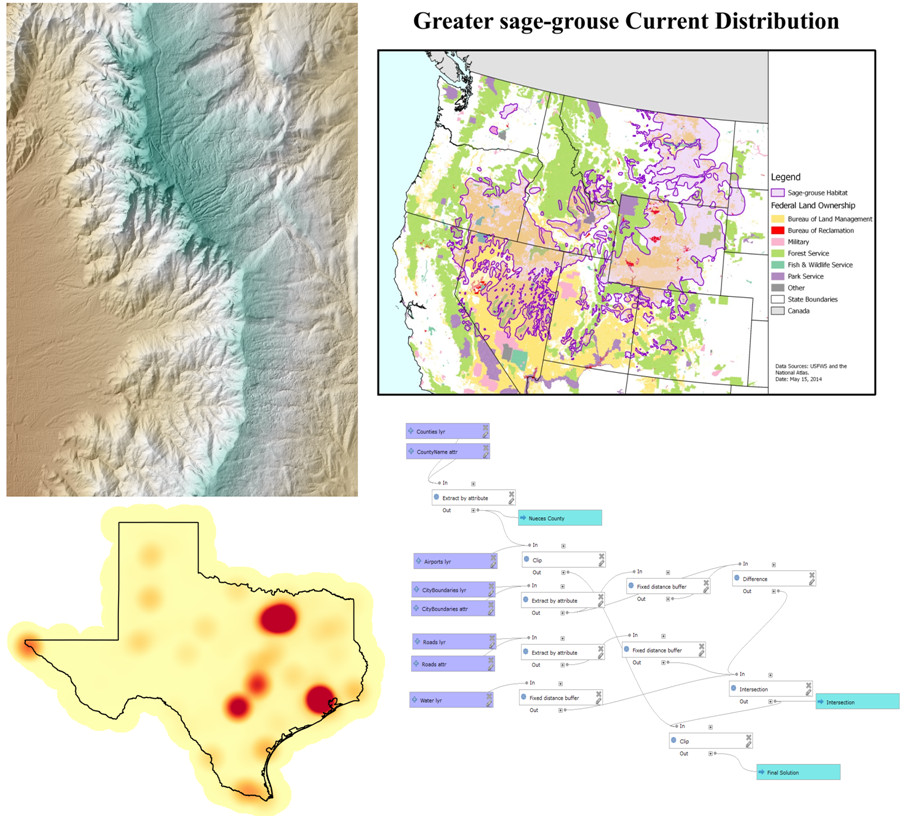
The array of QGIS renderers and sub-renderers is very impressive. There are of course the usual categorical and graduated ones. But there are also Inverted, 2.5 D, Point displacement, Heatmap, Hillshade and geometry generators! I showed two use cases for Inverted Polygon Shapeburst Fills which I use regularly these days. First coastal vignettes (left) and then study areas (right). 

Then there are Blending Modes. When wanting to show something like land ownership over a hillshade image you can use transparency. But the ownership colors become bleached & you don't get full hillshade detail. Instead in QGIS you can use one of 13 blending modes. Below is an example of using the Multiply blending mode on a land ownership layer. The result is full saturation of the colors in the ownership layer and full detail in the hillshade.

And it continues with Live Layer Effects created by Nyall Dawson. Quickly add inner glows, outer glows, drop shadows, blur effects etc., to your vector features. 

Copy/Paste layer styles. I know you can do this in ArcMap by importing symbology. However, it's just easier and more complete in QGIS. Right-click on a layer and copy the style, then right-click on the other layer and past the style. This includes label settings too. 

And if you need 3D there is the QGIS2ThreeJS plugin. It lets you set up a 3D view in QGIS. It writes out some javascript files and an html file and the result opens in a browser. It's very responsive. Below is a view of the Sangre de Cristo mountains outside of Santa Fe, New Mexico showing some wilderness proposals. Google imagery is draped on a DEM.

#8) Expressions and Functions

The array of functions and variables available in the QGIS select by expression window is awesome, especially when compared with ArcGIS which has just string, date and numeric. Plus these can be used in data defined variables, the print composer, the Atlas generator, rule based styling etc. In the case of data defined variables I doubt people have even thought of use cases for exposing all of this in each piece of a style or a label. But it's there if you ever need it.

#9) Geometry Generator Symbol Layers

I don't know if this really deserves a spot in the top 10, but I just discovered them and think they're cool. It's another case where it feels like the developers of QGIS are thinking outside the box and being creative with geo data. You can use this sub-renderer along with the expression engine to modify geometries just while rendering features. Plus the resulting geometry does not have to match the original. For example use the expression: centroid($geometry) on a polygon layer to render it as centroids. Or use: buffer ($geometry, -4000) to render a polygon layer with internal negative buffers of 4000 meters. Below shows the Colorado Game Management Units rendered as normal black polygons, then as light blue internal buffers and finally as red centroids.

#10) Virtual Layers

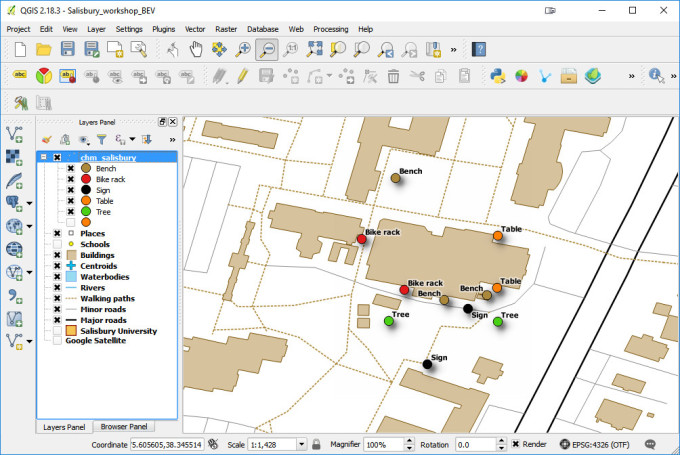
These are like database views. You can define a layer based on an SQL query. However it doesn't matter what file format your data is in! So you can use spatial SQL on shapefiles, KML, CSV's etc. Below is an example of creating a buffer view of some dialysis clinic points. 

#11) Some Things Are Just Easier in QGIS

There are a lot of simple tasks where QGIS requires fewer clicks, or is just more straightforward. The Save vector layer as... is a great example of that.

  • Reprojecting layers
  • Converting between file formats
  • Being able to read so many file formats
  • Editing (this is an area I wish I'd had time to cover)

#12) It's Rapidly Growing and Evolving

With a new stable release every four months, new features are being added all the time, QGIS is really growing fast. Due to this rapid pace each spring there is a long-term release created. This works better for production environments. Bug fixes are backported to this over the course of the year.

Another plus for QGIS is that you can have multiple versions installed with no issues. For example, I have the stable release, the long-term  release and the bleeding edge nightly release running.

We're also at a cool time in the QGIS development cycle. There is a major new release due out in February 2018 - QGIS Version 3.0. This incorporates a new version of Qt and Python 3. It looks to be faster and have quite a few new features. It will also sport a new logo.

2017-05-02_083329.jpg

#13) Help Resources

There are a myriad of support options these days.

#14) It's Free and Open Source!

I was also clear that I'm not trying to get you to stop using ArcGIS. You can still use QGIS and have an ArcGIS license. There is room in most offices for a hybrid solution to geo issues. In fact, it would be difficult to make an argument against it. These are just tools. You wouldn't limit yourself to just one screwdriver. Why limit yourself here? QGIS is free to install and check out. For example, if you need Spatial Analyst tools but don't have the license, use QGIS. If you need that Erase tool but don't have the license, use QGIS. Although I do think it's only a matter of time until you realize you can do everything you need with QGIS. 

Plus with QGIS, if there's a feature you need you can develop it in-house or sponsor it. A year ago I submitted a feature request. I realized there was no easy way to get QGIS to style a discrete raster. For example, one with vegetation types or land use categories. The feature request just sat there. Then Nyall Dawson came out with this post which got me thinking. About the same time I saw a post in a listserv about this issue. I ended up having a conversation with a few QGIS users about it. We decided to put together a proposal. Stéphane Henriod deserves all the credit here. We pitched it to Nyall Dawson (North Road) who returned a quote. We realized that while none of us could afford it individually, collectively we could. Within a few weeks the feature was done and available via the nightlies. 

Discrete raster styling will be a new feature when 3.0 comes out. It's minor but was a very empowering experience. As I've heard Anita Graser say, 'It's a do-ocracy.' If you want something done, don't just complain, you actually have the power to change it!

Like I said at the outset, for whatever reason my talk was really well received this time around. I had several die hard esri users come up to me afterwards and tell me some version of, "I always thought yeah yeah yeah but I have Arc..., but now I think I'm going to download QGIS this weekend." I honestly think some of the styling capabilities are mind blowing to someone who has been locked in an esri box. Plus many don't realize that QGIS has tools like the Graphical Modeler, or that you can read a ESRI File Geodatabase. Once people realize what it can do it's a no-brainer. It was really gratifying to finally get through!

They also held a raffle and I won a drone!!! All in all a great day!

Coffee, Community Health Maps & My Favorite Coffee Shops Visited in 2016

For the last couple of years I've been working on a project called Community Health Maps for the National Library of Medicine. The goal is to empower public health organizations working with underserved and at risk populations with mapping technology. We aim to help people who don't have backgrounds in computer science or geospatial technology, and don't have budgets for ArcGIS licenses. I've helped develop a program to show these people how they can 1) use Fulcrum to map their communities with smartphones, 2) map that data with Carto and 3) go even further with QGIS. 

Coffee Brewers

Coffee Brewers

This work takes me all over the country teaching half-day workshops. I've got it down at this point. In 3-4 hours I can teach 20-40 people who have never done any kind of map work how to collect data and map the results in Carto and QGIS.

I'm also a coffee geek. I've been hooked by the third wave coffee bug.  I take my coffee seriously as evidenced by my collection of brewers! My wife also compiled the video below of coffee roasters we tried in 2016.

For each training location, I assemble local data from OpenStreetMap and/or local sources. I always include a layer of the local coffee shops to try. After all, I'm going to try them anyway. It's a hobby of mine. Plus it makes it a little more fun, after a few hours of training, to have them open up a QGIS map showing the training location and some coffee shops to try. I usually google 'pour over' coffee in the area, and am sure to exclude all the Starbucks. To me one key to a quality coffee shop is the length of their menu. The shorter the menu the better. For example, I love this menu from Ninth Street Espresso in NYC.

In the last year or so I've been to Charleston 3 times, Seattle twice, along with Spokane, Honolulu, Lawrence, Washington DC and Salisbury MD. I've also been to NYC, Raleigh NC, Portland OR and Denver CO for other business trips. I finally got around to compiling a map of the best coffee shops I've been to in the last year. There are some good ones not on here, these are just the best of the best.

Of these Milstead and Co in Seattle is my favorite. They aren't a roaster but it is simply the best coffee shop I've ever been to. They make each each cup of coffee individually via AeroPress and offer an amazing selection of coffees to try. They are followed closely by Coava in Portland, Toby's Estate in Brooklyn, Black Tap in Charleston, and Boxcar in Denver.  Below are some shots from these coffee shops. Coffee and GIS were made for each other!


Black Tap - Charleston

Milstead & Co - Seattle

Toby's Estate - Brooklyn

Boxcar Coffee Roasters - Denver

Coava Coffee - Portland

If there isn't a good coffee shop I'll bring my Porlex mini grinder, some good beans an my Aeropress. Makes a great cup o' joe in my hotel room! Try it!

A Trip to Maryland to Teach Three Mapping Workshops

Last week I traveled to Maryland. I taught two workshops at the Prince Georges County Department of Social Services for people working on homeless issues. As with most Community Health Mapping workshops, all attendees were novices to mapping technology. However, in the first hour they all built a data collection form in Fulcrum and went outside to collect some data around the building.

Prince Georges County Community Health Mappers

Prince Georges County Community Health Mappers

The attendees represented a variety of organizations including many working with YouthREACH Maryland. REACH is an acronym standing for Reach out, Engage, Assist, & Count to end Homelessness. It is an effort to obtain accurate, detailed information on the number, characteristics, and needs of unaccompanied homeless youth in Maryland. Other organizations represented at these workshops included:

  • Maryland's Commitment to Veterans
  • Maryland Department of Planning
  • Prince Georges Community College
  • St Ann's Center for Children, Youth, and Familes
  • Maryland Multicultural Youth Center
  • So Others Can Keep Striving (S.O.C.K.S)
  • Sasha Bruce Youthwork
  • Lifestyles of Maryland.

In the final two hours of the workshops attendees learned how to map the data they collected in both Carto and QGIS. We also had time for a brief discussion about how CHM could be used in their projects. There were a lot of ideas shared about how the technology could help community engagement.

The afternoon workshop attendees feeling accomplished after completing their Carto maps!

The afternoon workshop attendees feeling accomplished after completing their Carto maps!

After the two PG County workshops, CHM traveled across the Chesapeake Bay bridge to Salisbury University on the eastern shore.

The following morning I taught a workshop geared towards social work students at Salisbury University. Attendees went through the CHM workflow and were introduced to FulcrumCarto and QGIS. Below is a map of data collected around the student center in Carto.

Salisbury University Data Collection in Carto

Salisbury University Data Collection in Carto

The workshop concluded with a short introduction to working with data in QGIS.

Salisbury University Data Collection in QGIS

Salisbury University Data Collection in QGIS

That afternoon I'd hoped to catch up with Art Lembo who wrote How Do I Do That In PostGIS? I realized at the last minute that the author of this little book I've had on my bookshelf works at Salisbury University. Unfortunately he was under the weather. FOrtunately I had time to drive to the Delaware shore for a quick beach walk.

The next scheduled workshop for the Community Health Maps team will be at the Teaching Prevention 2017 Conference in Savannah, Georgia. That conference takes place from April 5-7th. If you are interested in learning this technology this workshop will be a great opportunity!

Serving as an Expert Witness in a Trial...Almost

The Case: A couple of years ago I was hired by a law firm to create map exhibits in support of a lawsuit. It involved the Las Conchas Fire. This wildfire burned in late summer of 2011 in the Jemez Mountains north of Albuquerque and west of Los Alamos, New Mexico. At the time it was the largest wildfire in New Mexico's history. In the end it burned 156,000 acres. This area includes much of Bandelier National Monument and threatened Los Alamos National Labs. 

By John Fowler from Placitas, NM, USA - Las Conchas FireUploaded by PDTillman, CC BY 2.0, https://commons.wikimedia.org/w/index.php?curid=15748521

By Andrew Ashcraft of the Granite Mountain Hotshots 

The fire was contained by August 3rd. As chance would have it, a huge monsoon thunderstorm hit on August 21st causing severe flooding to Cochiti Pueblo which lies downstream from the burn area.

My involvement: I was working for the plaintiff's which included both Cochiti and Jemez Pueblos. The lawsuit was against the Jemez Mountains Electric Cooperative, Tri-State Generation and Transmission Association and the U.S. Forest Service for negligence in causing the fire. The map exhibits I made were pretty pedestrian by most cartographic or GIS perspectives. They were simple maps from existing data that put the extent of the fire and subsequent damages in context. However, I've never had to document a project to the extent I did for this. Data sources, dates and times, methods, software, phone calls, email exchanges all had to be documented thoroughly.

Outcome of the Lawsuit: In late 2015 a jury found that the two utility companies were 95% responsible for the negligence that lead to the ignition of the fire. The fire started when a diseased aspen tree fell onto the power line. They basically found that the tree should not have gotten to the point that it could fall on the line. The utility companies should have preemptively cut the tree, which was clearly visible from the right-of-way.

Expert Witness for Damages: In 2016 I found out that there would be a follow on trial to assess damages caused by the fire. I would be needed as an expert witness. At first it felt exciting, but it wasn't long until it felt daunting. Last summer I was deposed by Tri-State. I learned very quickly why they tell you to use Yes and No as answers whenever you can. Answering in any other way sent the attorney down a rabbit hole of rapid fire questions in search of some nugget he could use. It only lasted a little more than an hour but it felt like three. It was especially challenging because the attorney knew nothing of map scale, watershed delineation, or geospatial technology. At one point I was asked about which watershed a point fell in. I wasn't sure what the point of the question was. All I could say was, "According to this dataset yes." That lead to more questions, at which point I tried to explain that they are called HUC's, and that they are scale dependent etc. This lead to questions about best practices and ethics. Throughout I was honest and just tried to keep my composure.

Early this year I was prepped to appear on the stand. I met with the attorneys several times to practice. I felt very ready even for the unknown questions Tri-State would cross examine me with. This was going to be a jury trial and my teaching experience definitely helped me feel more prepared to explain details to laypeople. However, the night before I was to take the stand, I found out that the defense had accepted all my exhibits. They didn't need me to take the stand after all. It was seriously anti-climactic. 

The good news was that I was told that my exhibits appeared every day of the two week trial. They had been helpful to the case. In the end Tri-State settled. I don't know all the details, but am glad to have helped the Pueblos get something in return for all the damage done by the flooding. If I have to do this again I know it will be easier the second time. 

The Concise 2016 Year in Review...Another Good Year!

Professionally

  • ~ 400 maps made...roughly
  • Numerous analyses done, some big, some small
  • Worked for 21 clients
  • Authored Discover QGIS with Locate Press
  • Co-authored Mastering QGIS Second Edition with Packt Publishing
  • Began learning R & working with GeoPackages, getting better at PostGIS/SpatiaLite and brushing up on Python
  • Continued to migrate all GIS work to FOSS4G
  • Connected with a lot of great geospatialists via social networking
  • Taught Community Health Map workshops in: 
    • Seattle WA (twice)
    • Honolulu HI
    • Spokane WA
    • Bethesda MD (twice)
  • Gave talks at:
  • Authored 17 Community Health Mapping blog entries
  • Taught 8 GIS courses at UNM Continuing Education
  • Travelled to: 
    • Seattle (twice)
    • Lawrence KS
    • Raliegh
    • New York City
    • Washington DC
    • Orlando FL
    • Bisbee AZ
    • Spokane WA
    • Honolulu
    • Meeker CO
    • Denver (twice)
    • Red River NM

    Personally

    • Worked out 205 times...20 more than last year!
    • Climbed my 21st fourteener (Mt Bierstadt)...a work in progress
    • PR dead lift – 355lb
    • PR back squat – 315lb
    • Walked 410 miles...ah technology!

    What's New in Mastering QGIS - 2nd Edition?

    Myself, Rick Smith, Luigi Pirelli and John Van Hoesen are excited to announce the expanded second edition of Mastering QGIS. The goal of this book is to help intermediate and advanced users of GIS develop a deep understanding of the capabilities of QGIS while building the technical skills that would facilitate in making the shift from a proprietary GIS software package to QGIS. It is available in both hard copy and digital versions from Packt Publishing and Amazon.

    The book, which begins with a Foreword by Tim Sutton (QGIS Project Chairman), adds one new chapter, and 70 new pages from the first edition. Many new features have arisen in the last year. This book covers them all with step by step examples. This edition is updated to the latest long-term release version (2.14), and includes descriptions and examples of many new features. For example, this includes a new chapter on Advanced Data Visualization which covers live layer effects, QGIS2ThreeJS and Atlas generation. 

    What the book covers:

    Chapter1,A Refreshing Look at QGIS, reviews installation and basic functionality of QGIS that are assumed knowledge for the remainder of the book. New material includes user interface themes and working with Custom QGIS variables.  

    Chapter 2,Creating Spatial Databases, covers how to create and edit spatial databases using QGIS. While QGIS supports many spatial databases, SpatiaLite will be used in this chapter. First, core database concepts will be covered, followed by the creation of a spatial database. Next, importing, exporting as well as editing data will be covered. The chapter concludes with queries and view creation.

    Chapter3,Styling Raster and Vector Data, covers styling raster and vector data for display. First, color selection and color ramp management are covered. Next, single-band and multi-band raster data are styled using custom color ramps and blending modes. Next, complex vector styles and vector layer rendering are covered. Rounding out the chapter is the use of diagrams to display thematic map data. New material includes the numerous updates to the data Styling interface and all the new renderers (2.5D, heatmap, point displacement, inverted polygon & GRASS edit). 

    Chapter4, Preparing Vector Data for Processing, covers techniques useful for turning raw vector data into a more usable form. The chapter starts with data massaging and modification techniques such as merging, creating indices, checking for geometry errors, and basic geoprocessing tools. Next, advanced field calculations are covered, followed by complex spatial and aspatial queries. The chapter ends by defining new or editing existing coordinate reference systems. New material includes: new geometry checker tools and conditional formatting for attribute table cells.

    Chapter5,Preparing Raster Data for Processing, covers the preparation of raster data for further processing using the GDAL menu tools and the Processing Toolbox algorithms. Specifically, these include reclassification, resampling, rescaling, mosaics, generating pyramids, and interpolation. The chapter concludes with raster and vector data model coversions. New material includes the Slicer plugin and the new raster alignment tool.

    Chapter6,Advanced Data Creation and Editing, provides advanced ways to create vector data. As there is a great deal of data in tabular format, this chapter will cover mapping coordinates and addresses from tables. Next, georeferencing of imagery into a target coordinate reference system will be covered. The final portion of the chapter will cover testing topological relationships in vector data and correcting any errors via topological editing.

    Chapter 7,Advanced Data Visualization is a brand new chapter! In it we provide advanced ways to display your analysis results. QGIS has a greatly expanded repertoire of layer styling and display options. In this chapter, you will learn how to use Live Layer Effects, utilize the inverted polygon and 2.5D renderers, create an Atlas in the Print Composer and use the QGIS2ThreeJS plugin to create a 3D view of your data.

    Chapter 8, Exploring the Processing Toolbox, begins with an explanation and exploration of the QGIS Processing Toolbox. Various algorithms and tools, available in the toolbox, will be used to complete common spatial analyses and geoprocessing tasks for both raster and vector formats. To illustrate how these processing tools might be applied to real-world questions, two hypothetical scenarios are illustrated by relying heavily on GRASS and SAGA tools. New material includes working with R tools and Lidar data with LASTools.

    Chapter9, Automating Workflows with the Graphical Modeler, covers purpose and use of the graphical modeler to automate analysis workflows. In the chapter, you will develop an automated tool/model that can be added to the Processing Toolbox.

    Chapter10, Creating Plugins for PyQGIS Problem Solving, covers the foundational information to create a Python plugin for QGIS. Information about the API and PyQGIS help will be covered first, followed by an introduction to the iface and QGis classes. Next, the steps required to create and structure a plugin will be covered. The chapter will be wrapped up after providing you with information on creating graphical user interfaces and setting up debugging environments to debug code easily.

    Chapter11, Python Analysis Scripting with QGIS, provides topics for integrating Python analysis scripts with QGIS outside of the Processing Toolbox. Layer loading and management are first covered, followed by an exploration of the vector data structure. Next, programmatic launching of other tools and external programs are covered. Lastly, the QGIS map canvas is covered with respect to how a script can interact with the map canvas and layers within.

    Discover QGIS Is Out in Print!

    I'm excited to announce my latest QGIS book! Called Discover QGIS, it is the workbook for the award winning GeoAcademy curriculum. It is essentially 5 college courses full of labs! It comes with all the data, challenge exercises and solution files. Great for learning GIS, QGIS or for use in the classroom.

    The GeoAcademy is the first ever GIS curriculum based on a national standard—the U.S. Department of Labor’s Geospatial Competency Model—a hierarchical model of the knowledge, skills, and abilities needed to work as a GIS professional in today’s marketplace.

    Originally written for QGIS v2.4, the GeoAcademy material in this workbook has been updated for use with QGIS v2.14, Inkscape v0.91, and GRASS GIS v7.0.3. This is the most up-to-date version of the GeoAcademy curriculum. To aid in learning, all exercise data includes solution files.

    Thoughts on FOSS4GNA 2016

    FOSS4G has been my favorite conference since I attended the first Mapserver meeting in 2003. I've attended each North American installment since then...except for the 2012 NA meeting in DC. I shared about this in my talk Adventures of a Solo GIS Consultant. (The map for my talk is below)

    The 2016 edition FOSS4GNA did not dissapoint. In fact it was one of the best, and not because I fell in love with Raleigh the way I did with Victoria in 2007, or Portland in 2014. Raleigh was nice, but it was more about the conversations between the talks. I loved that the organizers gave us so many long breaks. The rain all week also helped keep me inside :)

    Perhaps it is because I work for myself that being around all these like minded folks is so stimulating. Perhaps it's because I get to meet people I know from Twitter, face-to-face. I loved the moments when I was standing in a group of people and we're all introducing ourselves, by our Twitter handles, like "I'm @spara." Perhaps it's being around some of the smartest people I know. I know it's a little of all of these. FOSS4G is more than the sum of it's parts. I always learn new things, but if that is all it was, I wouldn't keep going back. It's because there is a community of people behind the twitter handles. OsGeo has done a great job of fostering a community with these conferences.

    I met a lot of people I knew from social networking like @sarasomewhere, fellow Locate Press author @PetersonGIS, #gistribe members @gisn8, @UUDreams, @MicheleTobias & @spara. I made some new friends too, like @GuidoS & @TinaACormier, and it is always nice to be able to catch up with people like @rjhale.

    The workshops on Monday were great. I attended the GDAL/OGR workshop taught by Sara Safavi & Sasha Hart and the Getting the most out of QGIS with Python by Chris Daley. Each had a good mix of review and new material. 

    The BoF sessions were a highlight. I sat in on QGIS, #gistribe and Women in GIS. The latter was a great discussion and I really appreciated hearing the experiences women have at FOSS4G and in the workplace. I've seen the numbers of women increasing over the years at FOSS4G, but it was good to hear how it could be more inclusive.

    Of course there were many great talks. Some of my highlights were:

    • State of the QGIS Project by Larry Shaffer
    • Awaken the QGIS Within by Gretchen Peterson
    • Uncovering Ancient Mound Builders Using Open Data and FOSS Software by Calvin Hamilton
    • Cartography with Inkscape by Michele Tobias
    • WTFGL: a beginner's guide to the future of open source web mapping by Lyzi Diamond
    • Empirical Mining of Large Data Sets Help to Solve Practical Large-Scale Forest Management and Monitoring Problems by Bill Hargrove

    I also greatly underestimated the keynote addresses. Each day I'd look at the title and say, "Maybe I can skip this and sleep in, or go get a good breakfast." But I ended up attending each one, and they were all fascinating. Each a little out of the box and provacative in just the right way.

    Thanks to the organizing committee for putting together a great conference. I thought the venue, the session schedule, the food and the communication were all outstanding. 

    FOSS4GNA Raleigh Organizing Committee

    I wish I had the budget to go to the 2nd QGIS meeting in Gerona or FOSS4G in Bonn. Realistically though the next time I'll be able to add to my map is FOSS4G in Boston in 2017. So hopefully I'll see you there!

    PS...after FOSS4GNA I met my wife in NYC to celebrate my birthday. NYC didn't dissappoint. The map of our adventures is below!

    2016 Brings Two New QGIS Books!

    It's been such a busy year I haven't even had time to blog. Now that I'm sitting in my hotel room in Raleigh settling in for another FOSS4G, I finally have a bit of time. I've been doing a lot of GIS analysis, cartography, teaching, travelling to teach workshops, and blogging at Community Health Maps. I have also been working on the second edtion of Mastering QGIS and a brand new book Discover QGIS. Both books should be out in the next couple weeks!

    Mastering QGIS - 2nd Edition will be an updated version of last years book. All the material is being updated to the latest long-term release of QGIS v2.14. It wil also feature a new chapter on Advanced Data Visualization. This new chaptter will cover use of Live Layer Effects, 3d mapping with the 2.5D renderer and the QGIS2ThreeJS plugin, use cases for inverted polygon shapeburst fills, and atlas generation.

    Wiith Discover QGIS, the award winning GeoAcademy curriculum will be available in a workbook format. The material has been updated for use with QGIS 2.14, Inkscape 0.91, and GRASS GIS 7.0.3. The material is also backwards compatible to QGIS v2.8 despite minor GUI changes. It therefore represents the most up-to-date version of the GeoAcademy curriculum. It will be released in the coming weeks. It will include full solution files and a forward by Dr. Phil Davis. 

    Look for both offerings soon!

    The Concise 2015 Year in Review...A Good Year!

    Professionally

    Personally

    • Celebrated my grandmothers 100th birthday
    • Travelled to Denmark, Vermont, New York City, San Francisco, Colorado, Bisbee AZ and Charleston SC.
    • Worked out 184 times...not bad for an aging GeoHipster!
    • Walked 370 miles...ah technology!
    • Climbed my 20th 14’er (Mt Yale)...a work in progress
    • PR bench press – 215lb 3x
    • PR dead lift – 300lb – 5x
    • PR back squat – 205lb – 4x


    NMGIC 'Green Chile' Outstanding Service Award

    At the most recent New Mexico Geographic Information Councilmeeting I was honored to be awarded the NMGIC Green Chile Outstanding Service Award. Dr. Ken Boykin, from the New Mexico Cooperative Fish and Wildlife Research Unit, won the Red Chile award. Not sure which is hotter:) 

    I'd like to thank NMGIC for this award. I was very surprised and as I told the NMGIC President, "I feel like I'm just getting started!"

    Dr. Ken Boykin and Kurt Menke

    First User/Educator/Developer QGIS Conference - Nødebo Denmark

    I finally have a moment to report back on the first ever international QGIS User/Educator/Developer conference in Nødebo, Denmark. It was certainly one of the best GIS conferences I've been to. It had a very intimate feel. The setting at the Forestry School of the University of Copenhagen (Skovskolen) was beautiful and peaceful. It was located in one of Denmarks largest forests and there were numerous trails and forest gym play areas.

    Danish forest (Gribskov) near the conference groundsI had a lot of great conversations, some with old friends, and some with people I've known only from the QGIS-sphere. It was exciting the meet the latter face to face! There were ~150 attendees from 25 countries, and being one of only two Amercans was stimulating and refreshing.  QGIS 2015 Attendee Map

    After Jeff McKenna's keynote I presented on the FOSS4G Academy.

    OsGeo President Jeff McKenna opening the conferenceThere were some really good talks and workshops over the first two days. One highlight was a fruitfull round table discussion on education, curricula and certification. I'm excited to announce that our FOSS4G Academy material are being adopted by the QGIS project. This is the best chance for this material to survive and grow past 2015. 

    My personal conference highlights included: 

    • Matthias Kuhn presenting QField - this will be a mobile version of QGIS
    • Nyall Dawson and Andreas Nuemann showing new advances in rendering and the Print Composer - there are a lot of great tools coming out in the near future
    • Anita Graser showing all the new features of the Time manager - it's becoming a very powerful data visualization tool
    • Tim Sutton leading an open discussion on the future of QGIS. It's not clear when version 3.0 will be released or what upgrading to Qt5 and Python 3 will involve. However, the QGIS development team will give us plenty of lead time before that change happens.
    • The farewell dinner held in a huge tent in the forest. The Danes know how to throw a party!Farewell dinner
    • Meeting people I've known only via the QGIS-sphere including my co-author Luigi Pirelli and conference organizer Lene Fischer!Myself and Luigi Pirelli - Mastering QGIS!
    • Making new Danish friends

    Group shot QGIS 2015

    Thanks to Lene Fischer and the staff and students at the University of Copenhagen Forestry School for organizing a great conference! Here's hoping there is a follow on educational conference there next summer!

    My wife and I posing with Lene Fischer

    I didn't stick around for the developer meeting and the hackfest. I instead spent some time sightseeing and relaxing on the north coast of Zealand in a town named Gilleleje.Sunset over the Kattegat

    Excited to be Attending the 1st QGIS Conference!

    Monday I'm heading to Denmark for the first time to attend the first joint developer | user | educator QGIS conference. In 2003 I attended the first Mapserver Users Meeting and it feels like there are some similarities. That meeting was also held at a Forestry College (St. Paul, MN) and had about 150 people as are exptected in Nødebo. That meeting felt cutting edge and exciting. It was several years before FOSS4G's came into existence. This feels like it might have a similar excitement to it.

    First Mapserver Users Meeting (2003)

    I'll be one of only two American attending. I am anticipating meeting many of the European QGIS developers and bloggers that I only know from the Twittersphere. This includes one of my co-authors of Mastering QGIS. There will be some great talks and workshops. Before and after my wife and I will be able to tour the Danish countryside. Stay tuned...

    Mastering QGIS is Ready for your Bookshelves!

    It is with great excitement and pride that I announce our book Mastering QGIS has been published! I co-authored this book with Dr. Richard Smth, Dr. Luigi Pirelli and Dr. John Van Hoesen. It is available as both an eBook and in hard copy from Packt Publishing and Amazon.

    Mastering QGIS Cover

    QGIS is the leading alternative to proprietary GIS software. Although QGIS is described as intuitive, it is also, by default, complex. Knowing which tools to use and how to apply them is essential to producing valuable deliverables on time.

    Starting with a refresher on QGIS basics, this book will take you all the way through to creating your first custom QGIS plugin. By the end of the book you will understand how to work with all the aspects of QGIS, and will be ready to use it for any type of GIS work.

    The introductory section servers as a quick start guide for those with little QGIS experience. It includes directions for installing QGIS on all the major platforms, reviews the layout of QGIS Desktop and Browser, and covers adding data, working with projections, querying tables, creating maps and finding and installing plugins.

    From the refresher, you will learn how to create, populate and manage a spatial database and walk through styling GIS data, from creating custom symbols and color ramps, to using blending modes. In the next section, you will discover how to prepare vector and raster data for processing and discover advanced data creation and editing techniques, such as geocoding, georeferencing and topological editing. The last third of the book covers more technical aspects of QGIS, including working with the Processing Toolbox, how to automate workflows with batch processing, and how to create graphical models. Finally, you learn how to create and run Python data processing scripts and write your own QGIS Plugin with pyqgis.

    This book is the most thorough tutorial for everyone needing a free and open source desktop GIS.

    Geo For All Announces Nominations for Global Educator of the Year!

    As a part-time educator it is exciting to be nominated for the Geo For All Global Educator of the Year Award! I've been passionate about promoting FOSS4G for many years and am excited to see it gaining more traction in eductional programs. I was fortunate to be nominated for a course I developed, and have been teaching for the last 6 years, at Central New Mexico Community College. I have also been part of the GeoAcademy team. I developed 3 of the 5 courses and have been teaching them on line through Del Mar College. Our team was nominated for that work as well. As we say everyone can 'Steal this curriculum for Free'! https://foss4geo.wordpress.com/

    Announcement: Learn the new QGIS 2.8.1!

    The GeoAcademy is pleased to announce the launch of their new Introduction to Geospatial Technology Curriculum. The curriculum will be based on the latest version of QGIS, version 2.8.1 Wien which is a long term release (LTR).

    The curriculum is a complete package of five GIS courses leading to a Certificate of Proficiency in QGIS from the Del Mar College continuing education program. The five courses will be offered in a limited-enrollment online class format (25 students maximum), taught by leading GIS professional educators (GISP & PhD) who created the course material. I am one of the instructors.

    The first course, GST 101—Introduction to Geospatial Technology Using QGIS 2.8.1 will begin April 3, 2015 to be followed each month by a new course through August 2015. Tuition is $25 USD per course, or a total of $125 for all five in the Certificate of Proficiency. The courses include:

    1. GST 101—Introduction to Geospatial Technology Using QGIS 2.8.1 (April 2015)
    2. GST 102—Spatial Analysis Using QGIS 2.8.1 (May 2015)
    3. GST 103—Data Acquisition & Management Using QGIS 2.8.1 (June 2015)
    4. GST 104—Cartography Using QGIS 2.8.1 (July 2015)
    5. GST 105—Remote Sensing Using QGIS 2.8.1 and GRASS 7.0 (August 2015)

    Anyone interested in learning more about the offer or enrolling should contact the GeoAcademy director: Phillip Davis at (361) 698-1476 or email:pdavis@delmar.edu

    Mastering QGIS Due out by the end of the month!

    Over the winter Kurt Menke co-authored Mastering QGIS along with Dr. Richard Smith, Dr. John Van Hoesen and Dr. Luigi Pirelli. The book will allow you to go beyond the basics and unleash the full power of QGIS with the help of practical, step-by-step examples. Topics covered in the book include: working with spatial databases, advanced vector and raster data processing, styling data, working with the processing toolbox, building models with the graphical modeler, automating processes with scripting and building Python plugins. 

    The book is due out by the end of March. It will be available in both e-book and hard copy formats. Pre-orders are being accepted now! Visit the books page on the Packt Publishing site for more details.

    Mastering QGIS cover

    QGIS 2.8.1 Released

    This week the next stable version of QGIS was released. It is being called QGIS version 2.8 ‘Wien‘. Wien is German for ‘Vienna‘ which was the host city for the QGIS developer meetings in 2009 and 2014.

    QGIS 2.8 Splash Page

    Recently a new version of QGIS has been released every four months. This rapid pace of development has its pros and cons. On the plus side, the software is rapidly growing and improving. On the con side it has made it difficult to maintain documentation. It has also been an issue for people working on large projects. They have had to deal with the software changing every four months.

    QGIS 2.8 is a special release because it is the first in a series of long-term releases (LTR’s). The idea is that one release per year will be an LTR. This means that the LTR release will be supported and available for download for one year. This way people needing stability can use this until the next LTR is released a year from now.

    Some of the highlights are:

    • Numerous bug fixes and stability improvements
    • QGIS Browser is more responsive
    • Ability to select the units in the Measure tool
    • Improvements to editing: better control of snapping and a new suite of Advanced Digitizing tools
    • Improvements to the Map Composer such as better control over coordinate graticules and map rotation.
    • Symbology improvements such as filling polygons with raster images, ability to have multiple styles per layer.

    The detailed list of new features can be found in the QGIS Virtual Change log: http://www2.qgis.org/en/site/forusers/visualchangelog28/index.html

    Visit the download page and take the new version for a spin. Remember you can install it on Windows, Mac and Linux!

    Bird's Eye View Conducts a Training in the South Carolina Lowcountry

    Recently Kurt Menke headed to Charleston, South Carolina to train several groups how to map their communities. This was part of the Community Health Maps project with the National Library of Medicine. This region is also known as the ‘lowcountry’ due to the flat, low elevation geography. The training was hosted by the Medical University of South Carolina (MUSC) and included people from Communities in Schools – Charleston (CISC) and the MUSC School of Nursing.

    MUSC Community Health Mapping Training at the School of Nursing

    First everyone learned how collect GPS field data with iPads. For this we used a new app named iForm. This app was used in lieu of EPI Collect, which no longer supported on iOS.  iForm is an app very similar to the Android app ODK Collect, allowing a custom data collection form to be developed. To practice we collected bike rack locations  and seating areas around the MUSC campus. The afternoon was spent working with everyone’s  data. GPS data points were brought into QGIS and shown against some local Charleston GIS data layers.

    MUSC Data Points in QGIS

    The points were also uploaded to CartoDB. CartoDB is another new component of the Community Health Mapping workflow. It has become more intuitive than GIS Cloud and worked really well. (Note: There will be a post on using CartoDB soon too.)

    The following day I visited CISC’s Derek Toth and three of his students at St. John’s High School on John’s Island, SC. Over a working lunch Mr. Toth showed students how easy it is to collect GPS points with their iPhones. We collecting several points while walking around the campus.

    Mapping the St. Johns Campus

    Afterwards we went back inside and showed them how to upload the points into CartoDB and make a map. The figure below shows the results of 45 minutes worth of work! Click on the map to open the live version.

    St Johns High School Data Points in CartoDB

    This spring these three juniors will be leading the charge to map their island!  They will be presenting their work to the National Library of Medicine later this spring. I look forward to seeing their work!

    The St. Johns High School Mapping Team from left to right: Jocelyn Basturto, Khatana Simmons, Candace Moorer (MUSC), Corrieonna Roper & Derek Toth (CISC)

    FOSS4G Academy Launched

    For the first time there is a complete GIS curriculum based on free and open source (FOSS4G) software! Better yet the material are freely available to everyone. The curriculum consists of five courses:

    • GST 101 – Introduction to Geospatial Technology
    • GST 102 – Spatial Analysis
    • GST 103 – Data Acquisition and Management
    • GST 104 – Cartography
    • GST 105 – Remote Sensing

    Examples of FOSS4G Academy QGIS Labs

    The courses were developed via the National Information Security and Geospatial Technologies Consortium (NISGTC), under the leadership ofPhil Davis (Del Mar College). Kurt Menke(Bird’s Eye View), andDr. Richard Smith(Texas A & M – Corpus Christi), authored the material which includes: theory, lecture, labs, data and task oriented video tutorials for each lab exercise.

    The courses are aligned with the Department of LaborsGeospatial Technology Competency Model(GTCM). The GTCM  was published in 2010 and will be revised in 2015. It describes the complete set of knowledge, skills, and abilities required by GIS professionals. It is designed around a hierarchical tiered model of knowledge and promotes use of open source technology.

    Geospatial Technology Competency Model

    QGIS is the featured software for all courses. When appropriate other FOSS software’s are also included such as GRASS and InkScape.

    The vast majority of US based colleges and universities use a single vendor’s proprietary GIS software, making this series of courses very unique. In fact it is the first national attempt at a completely open source GIS curriculum. By their very nature of open source software, there is no marketing engine promoting them. This has slowed the adoption and overall use of open source GIS. One hope is that this material will entice people to learn about FOSS4G. Bird's Eye View will be offering instructor led online versions of these courses in the near future.

    The targeted audience is broad and includes:

    • Secondary school educators and students
    • Two and four year college educators and students
    • Students in need of GIS skills
    • Workers seeking to broaden technology skills
    • Anyone desiring QGIS and open source knowledge and skills

    FOSS4G Academy

    The courses are available online at theFOSS4G Academy. Over 2,500 students have already enrolled for these courses demonstrating how in demand these materials are. Visit the FOSS4G Academy now and explore the material!