2021 - Denmark - A Year in Pictures

January

February

March

April

May

June

July

August

September

October

November

December

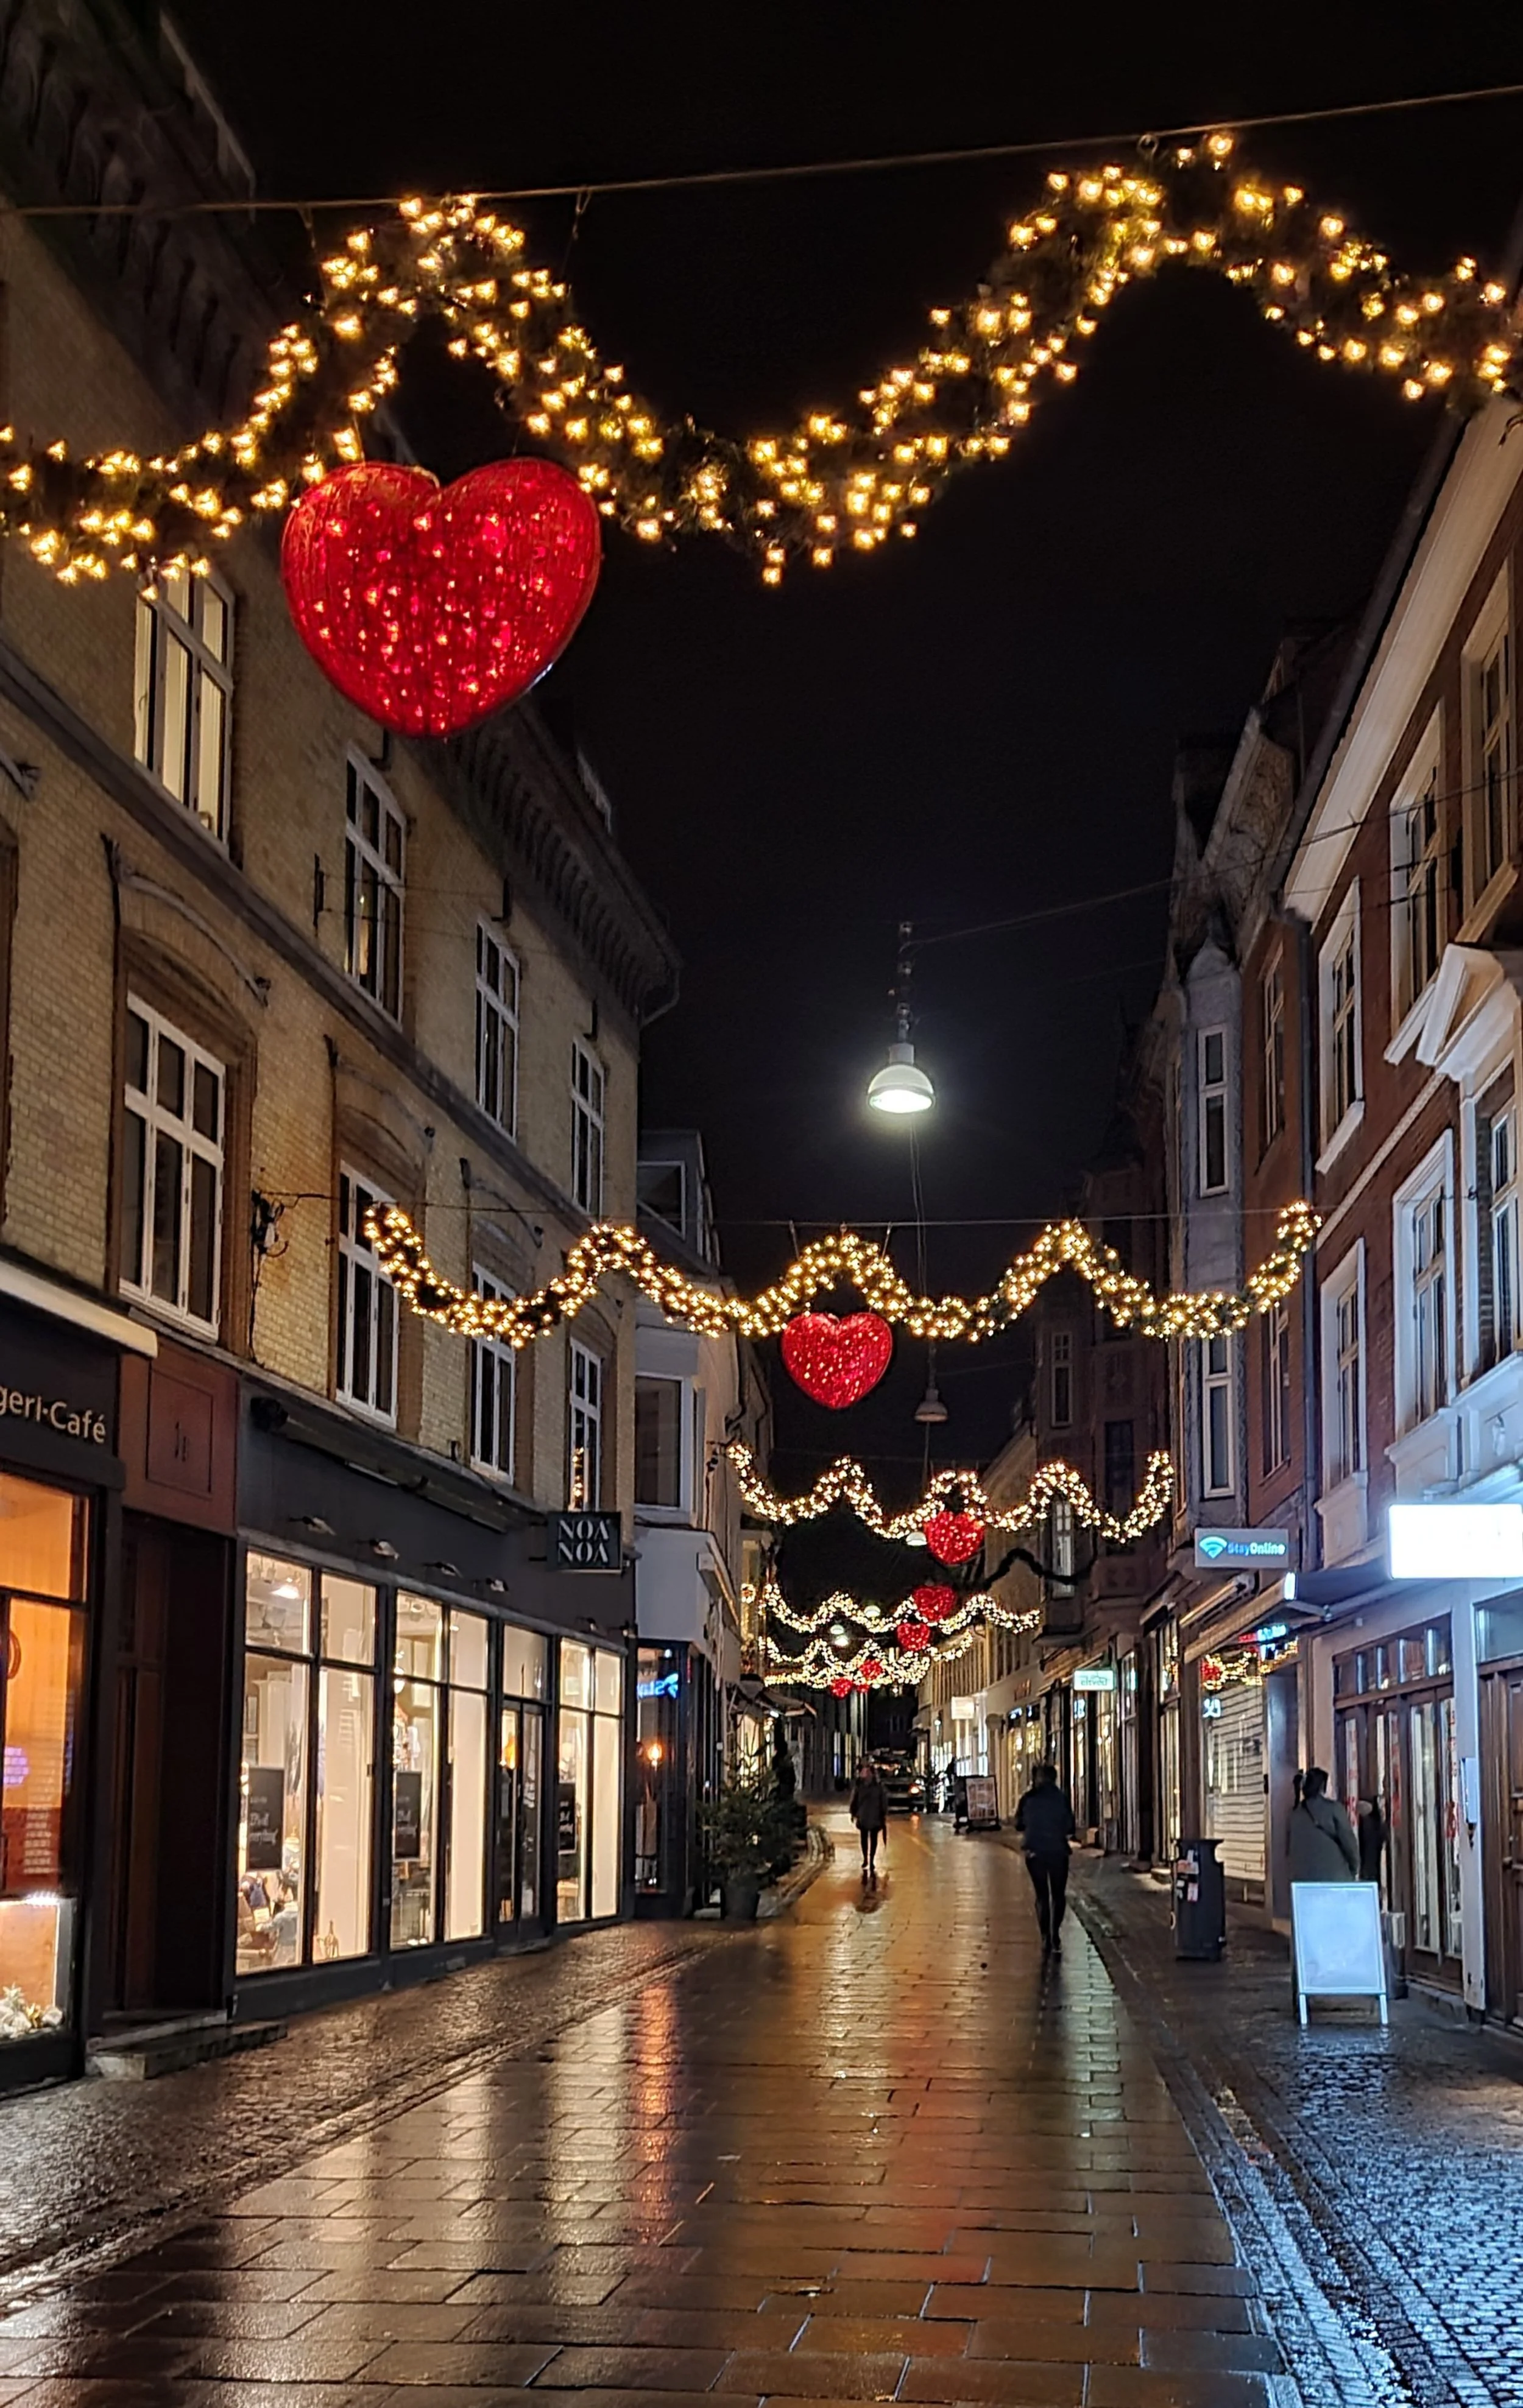
MERRY CHRISTMAS & HAPPY NEW YEAR!
GLÆDELIG JUL & GODT NYTÅR
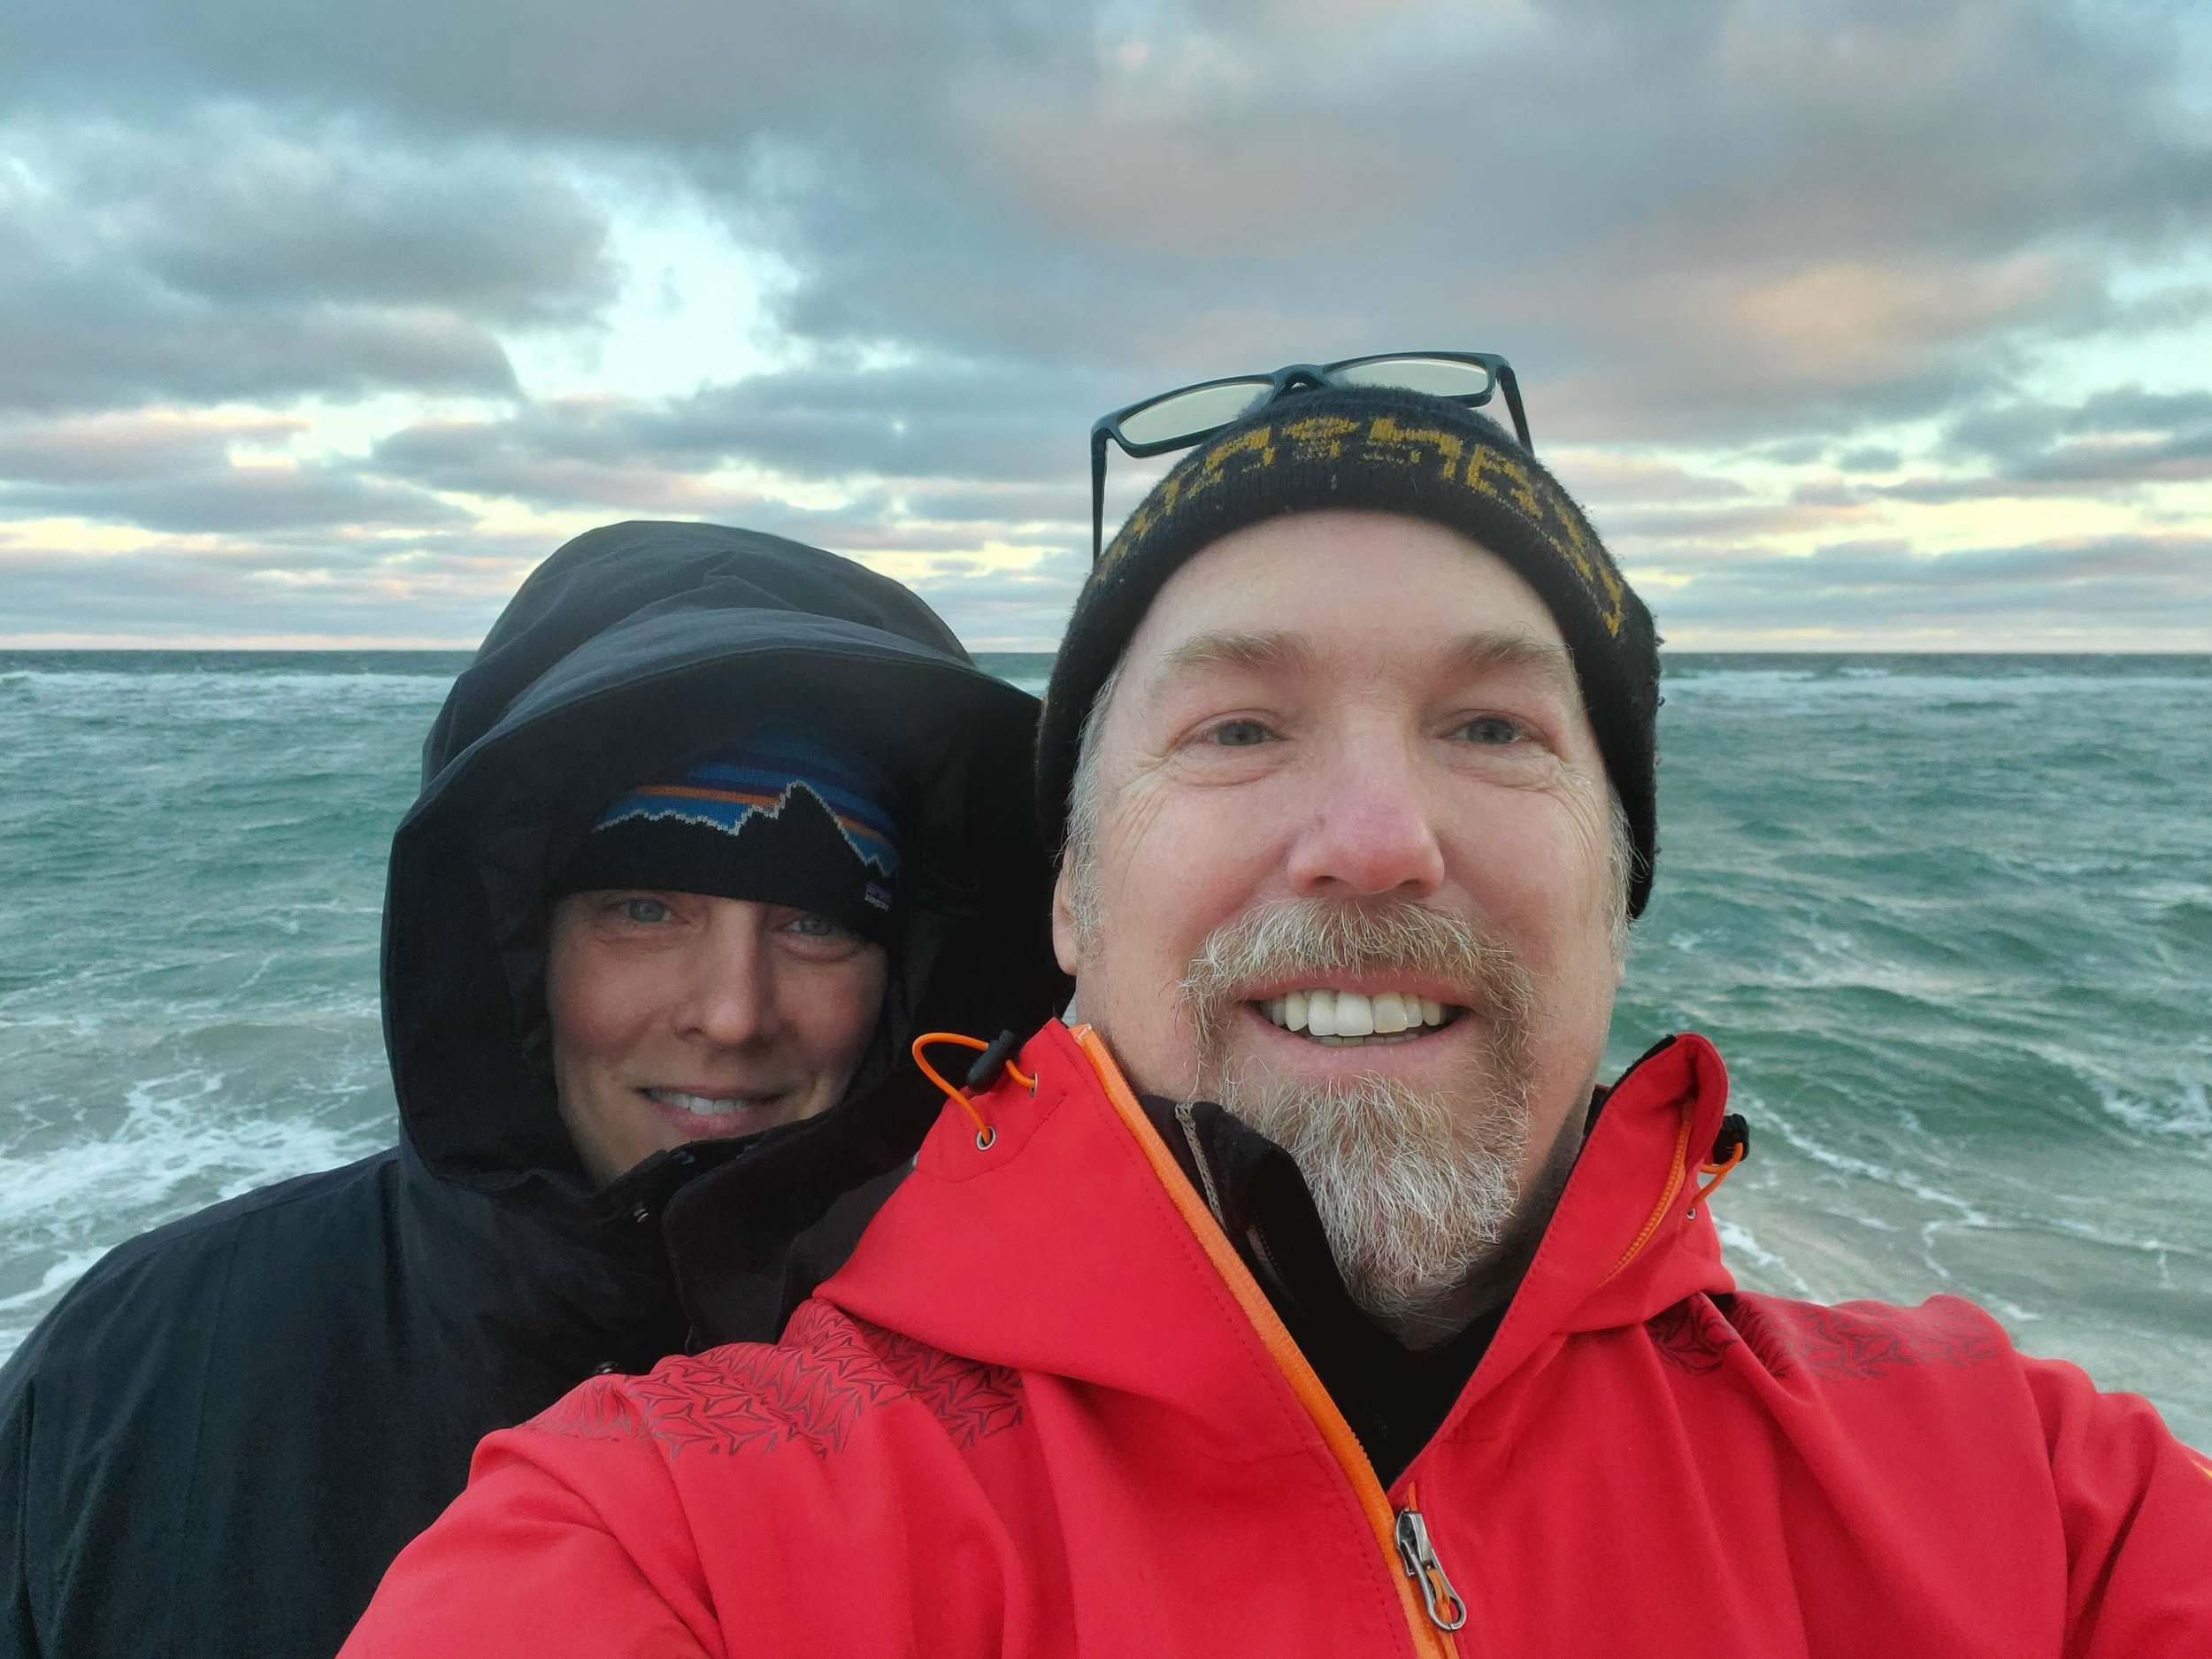
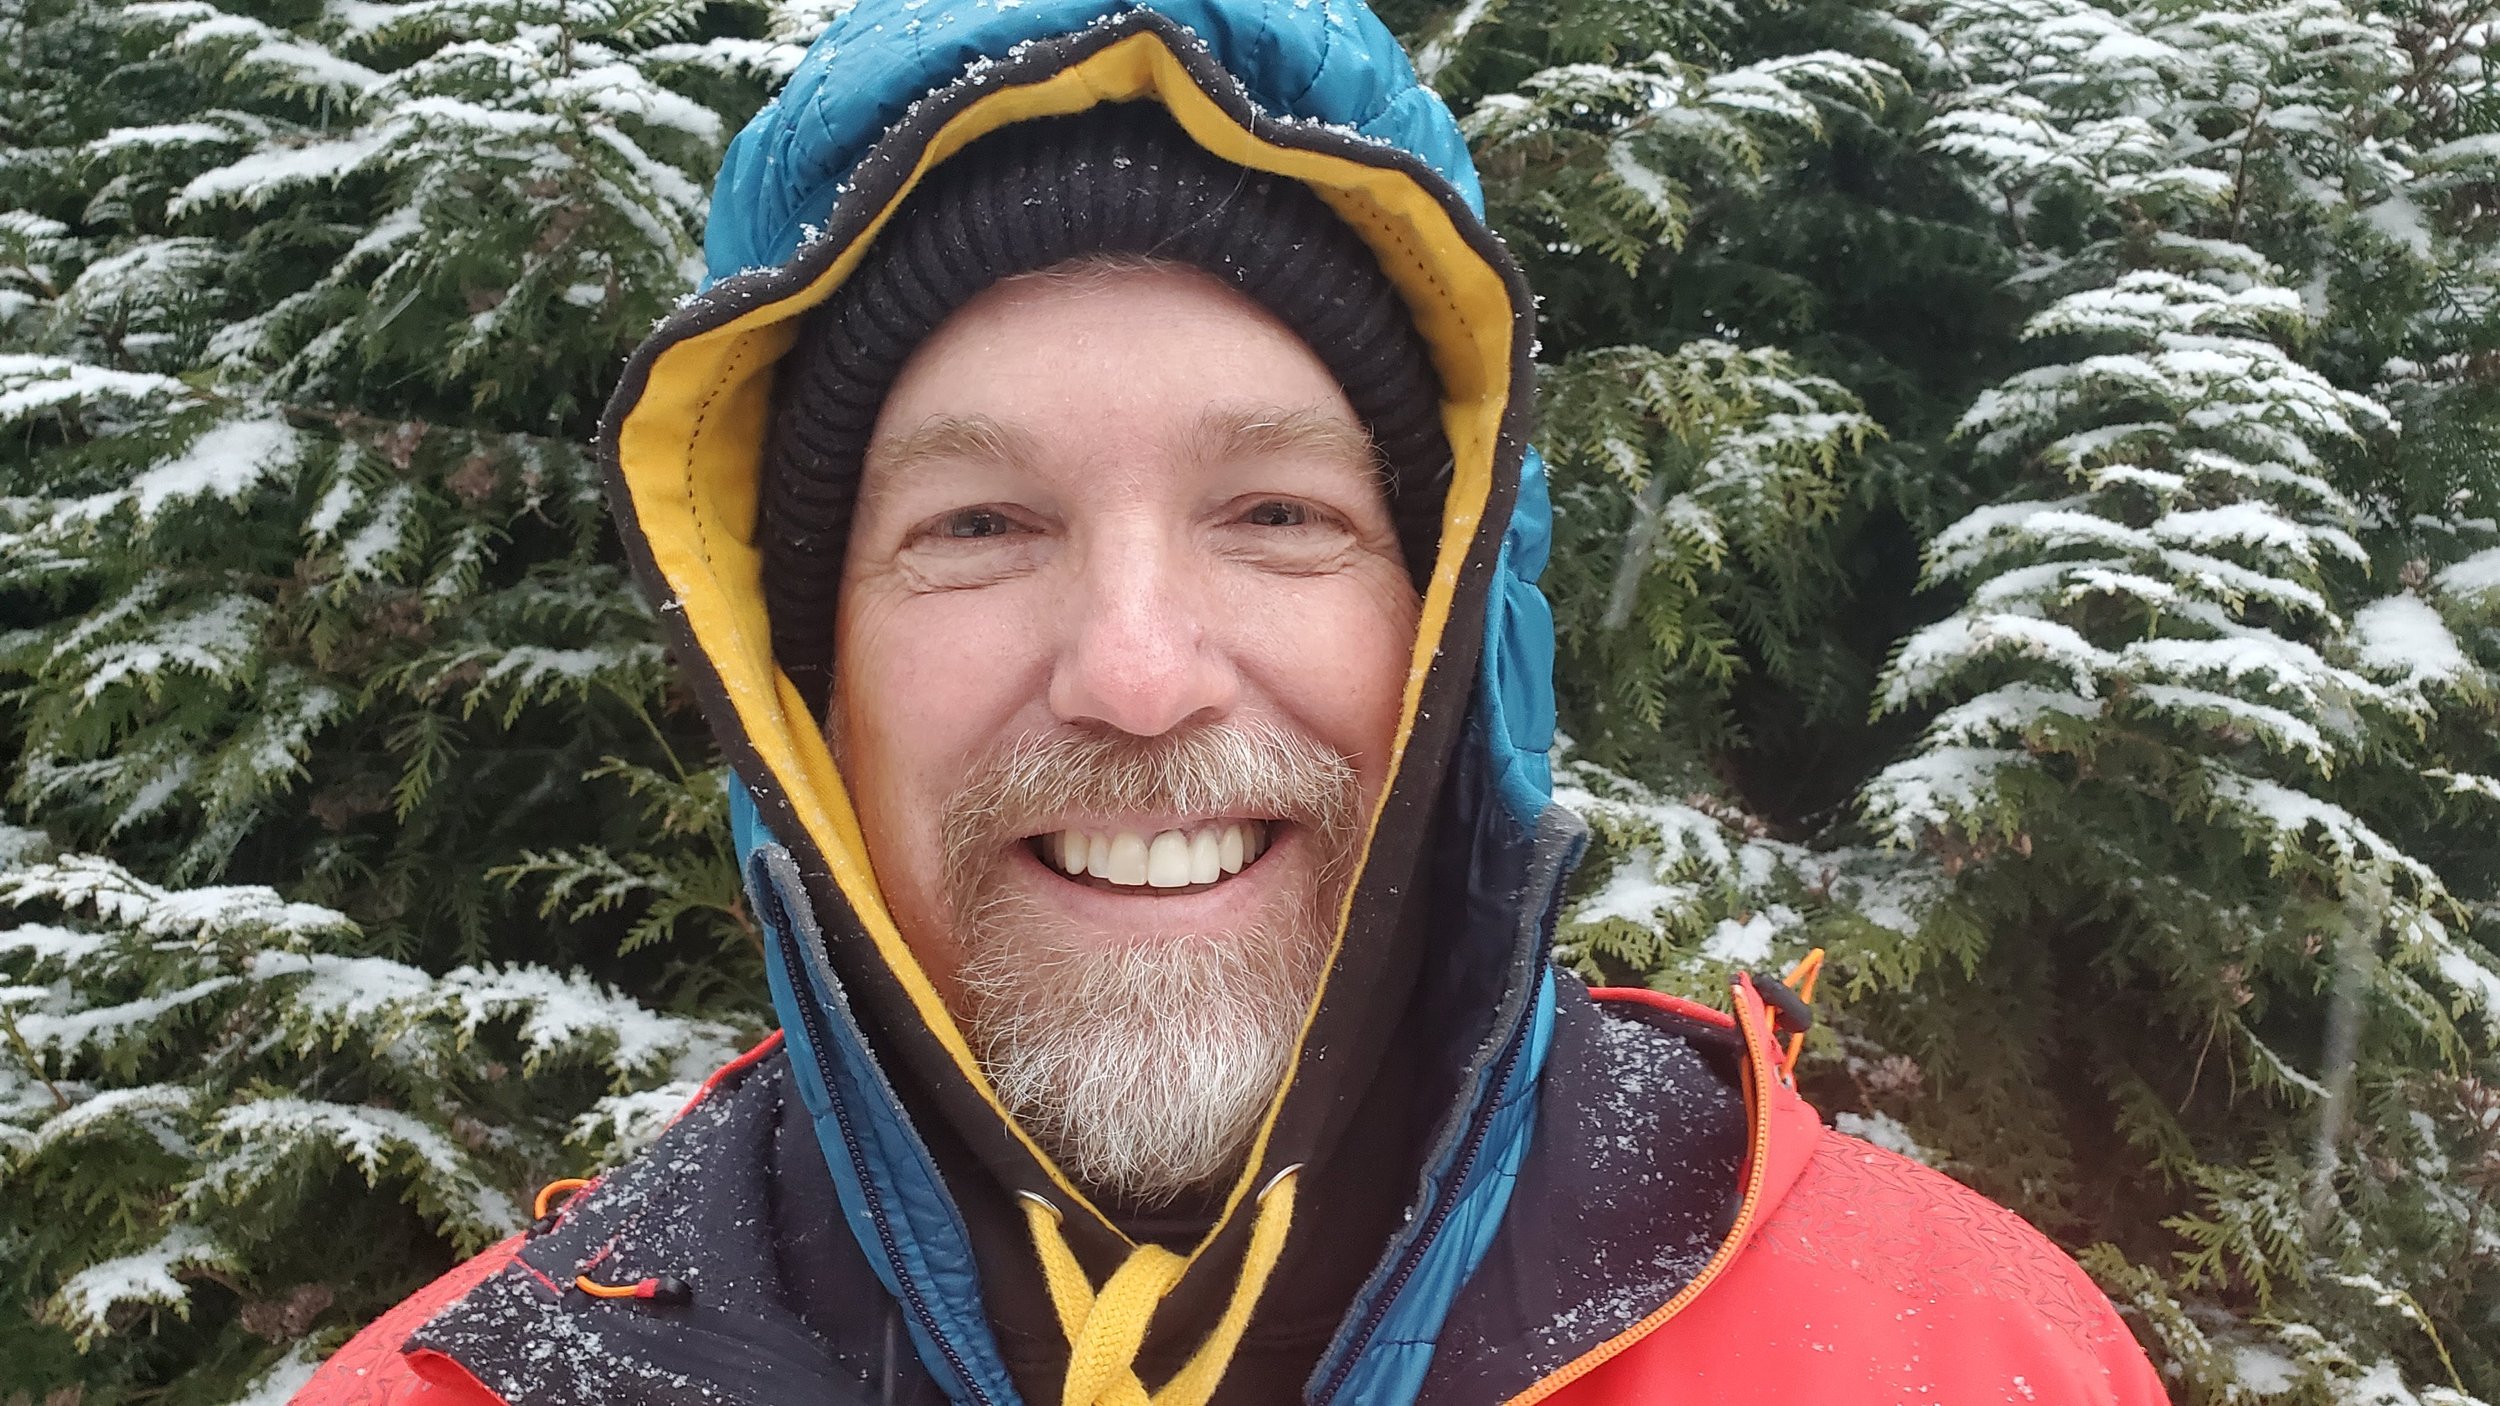
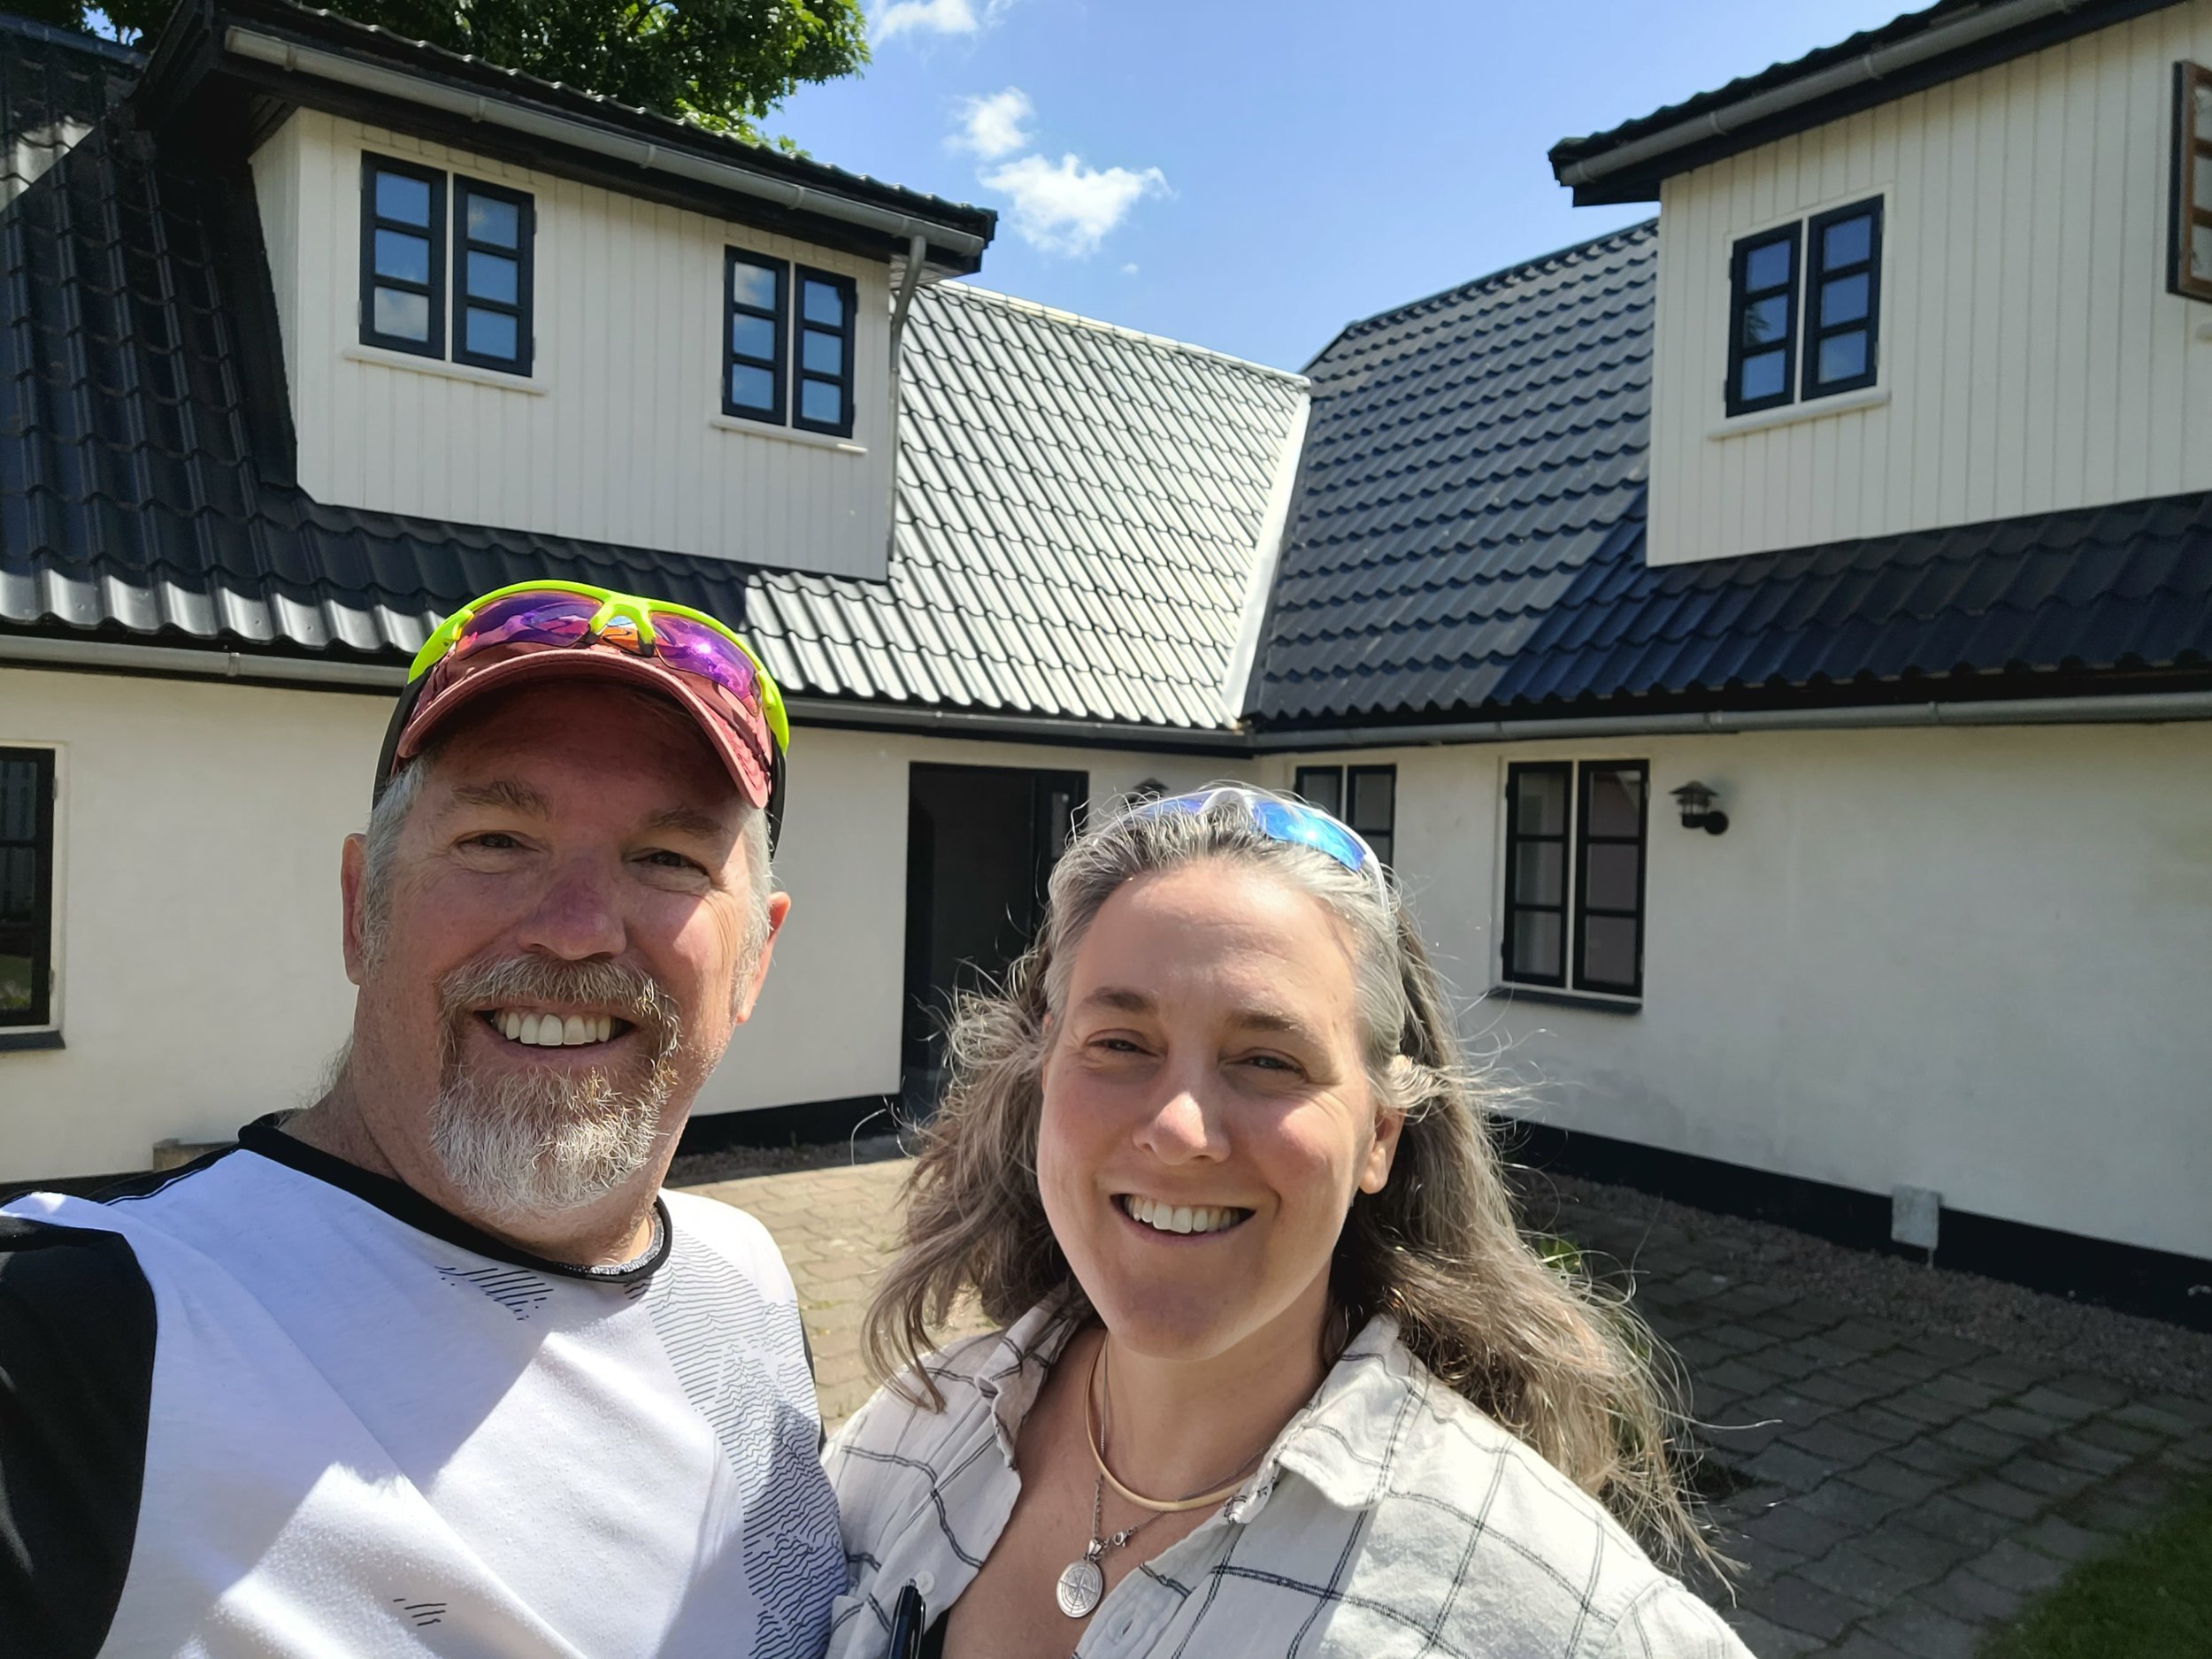
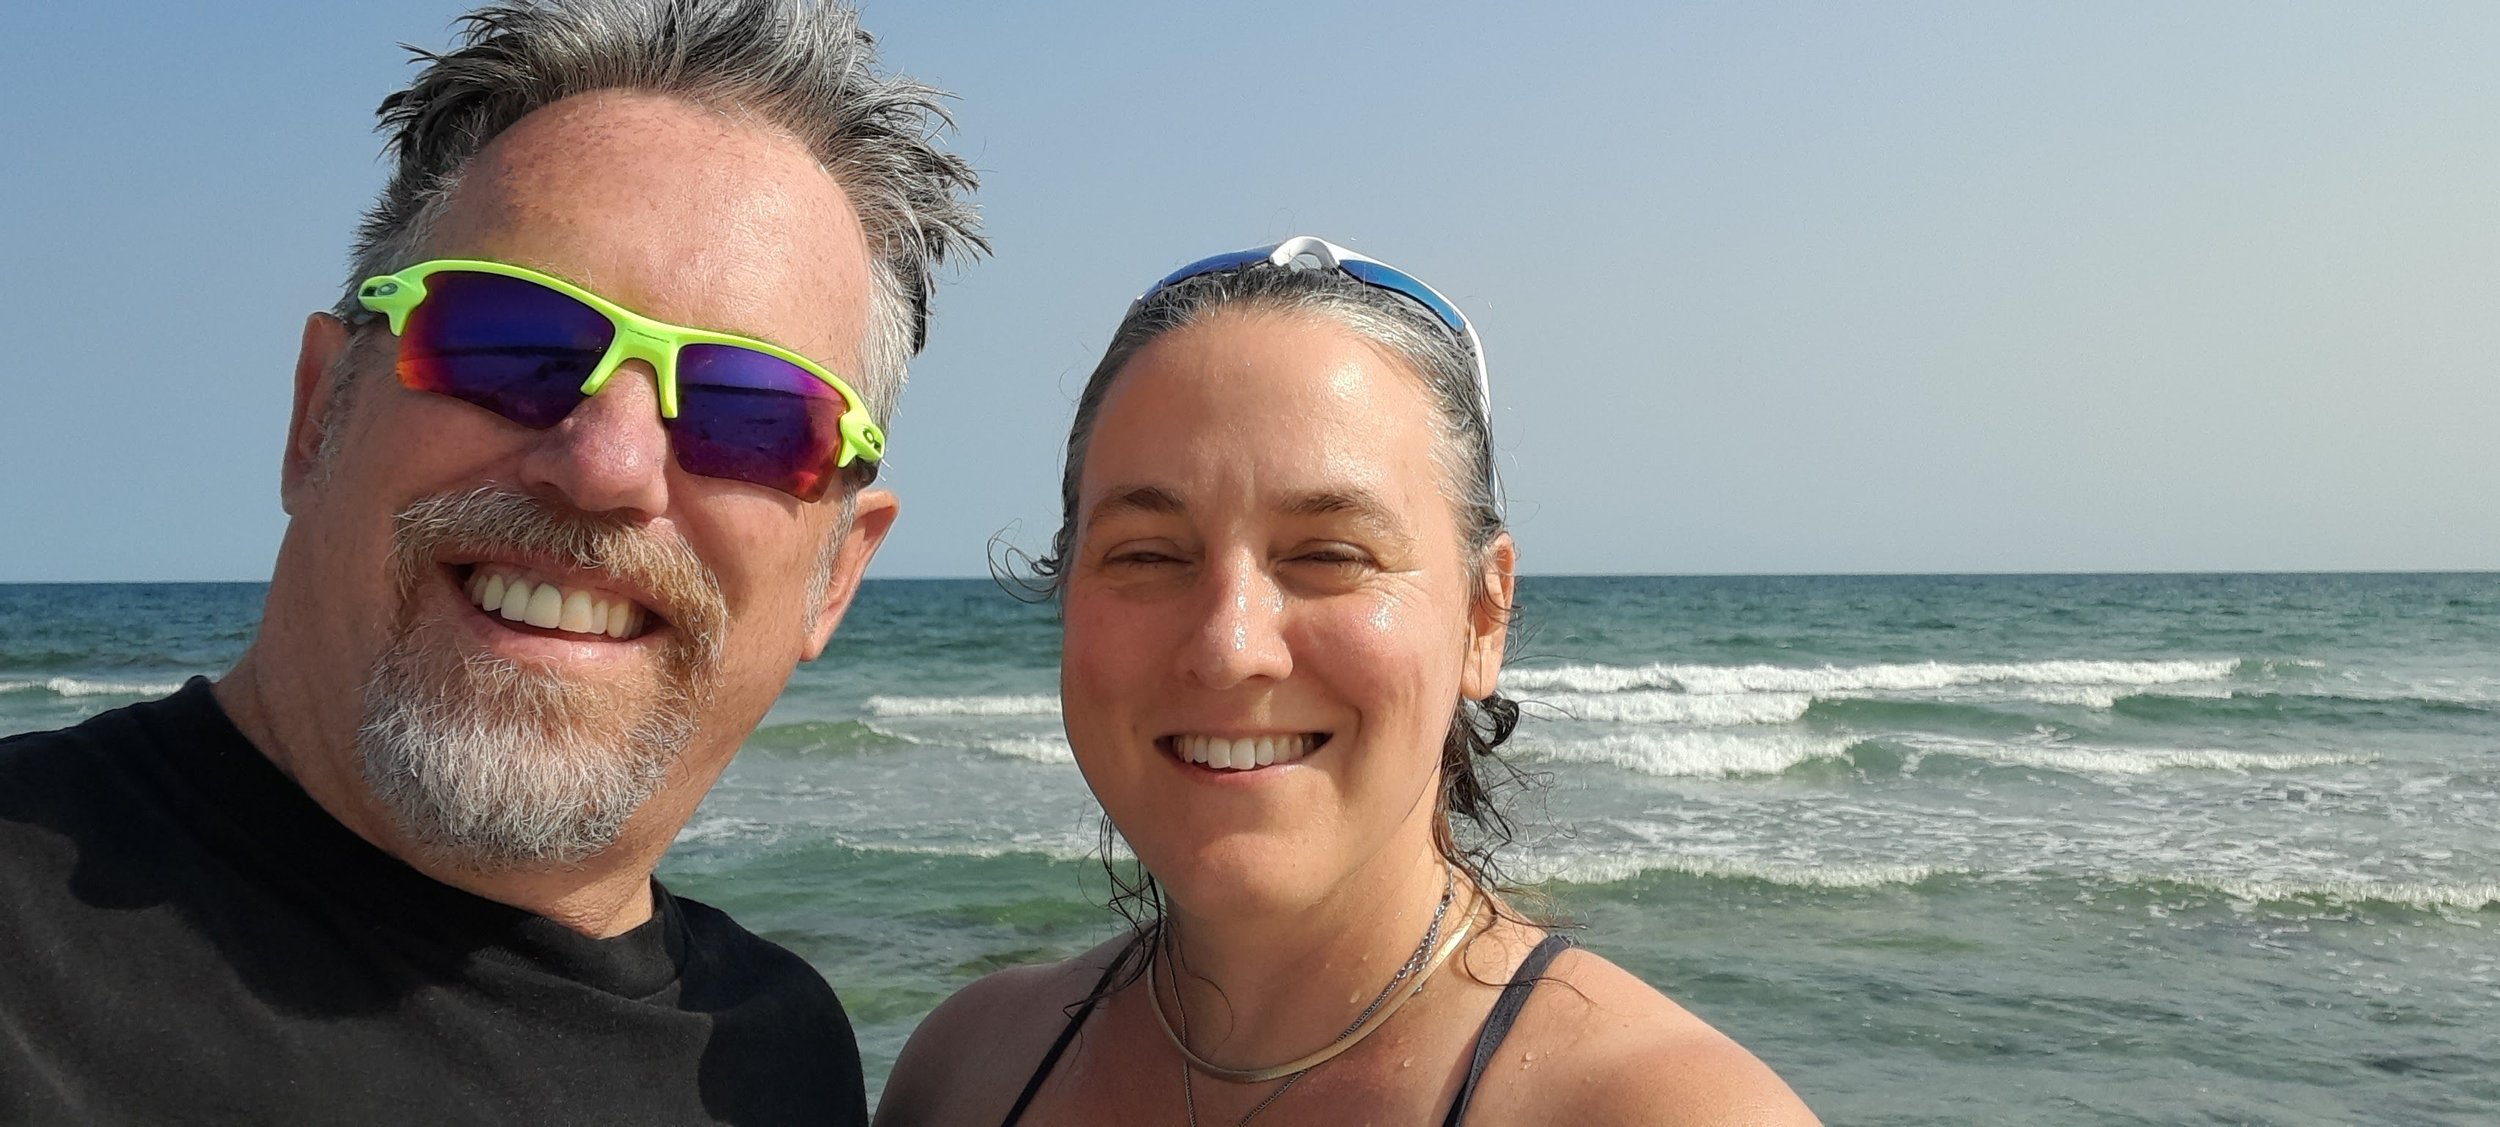
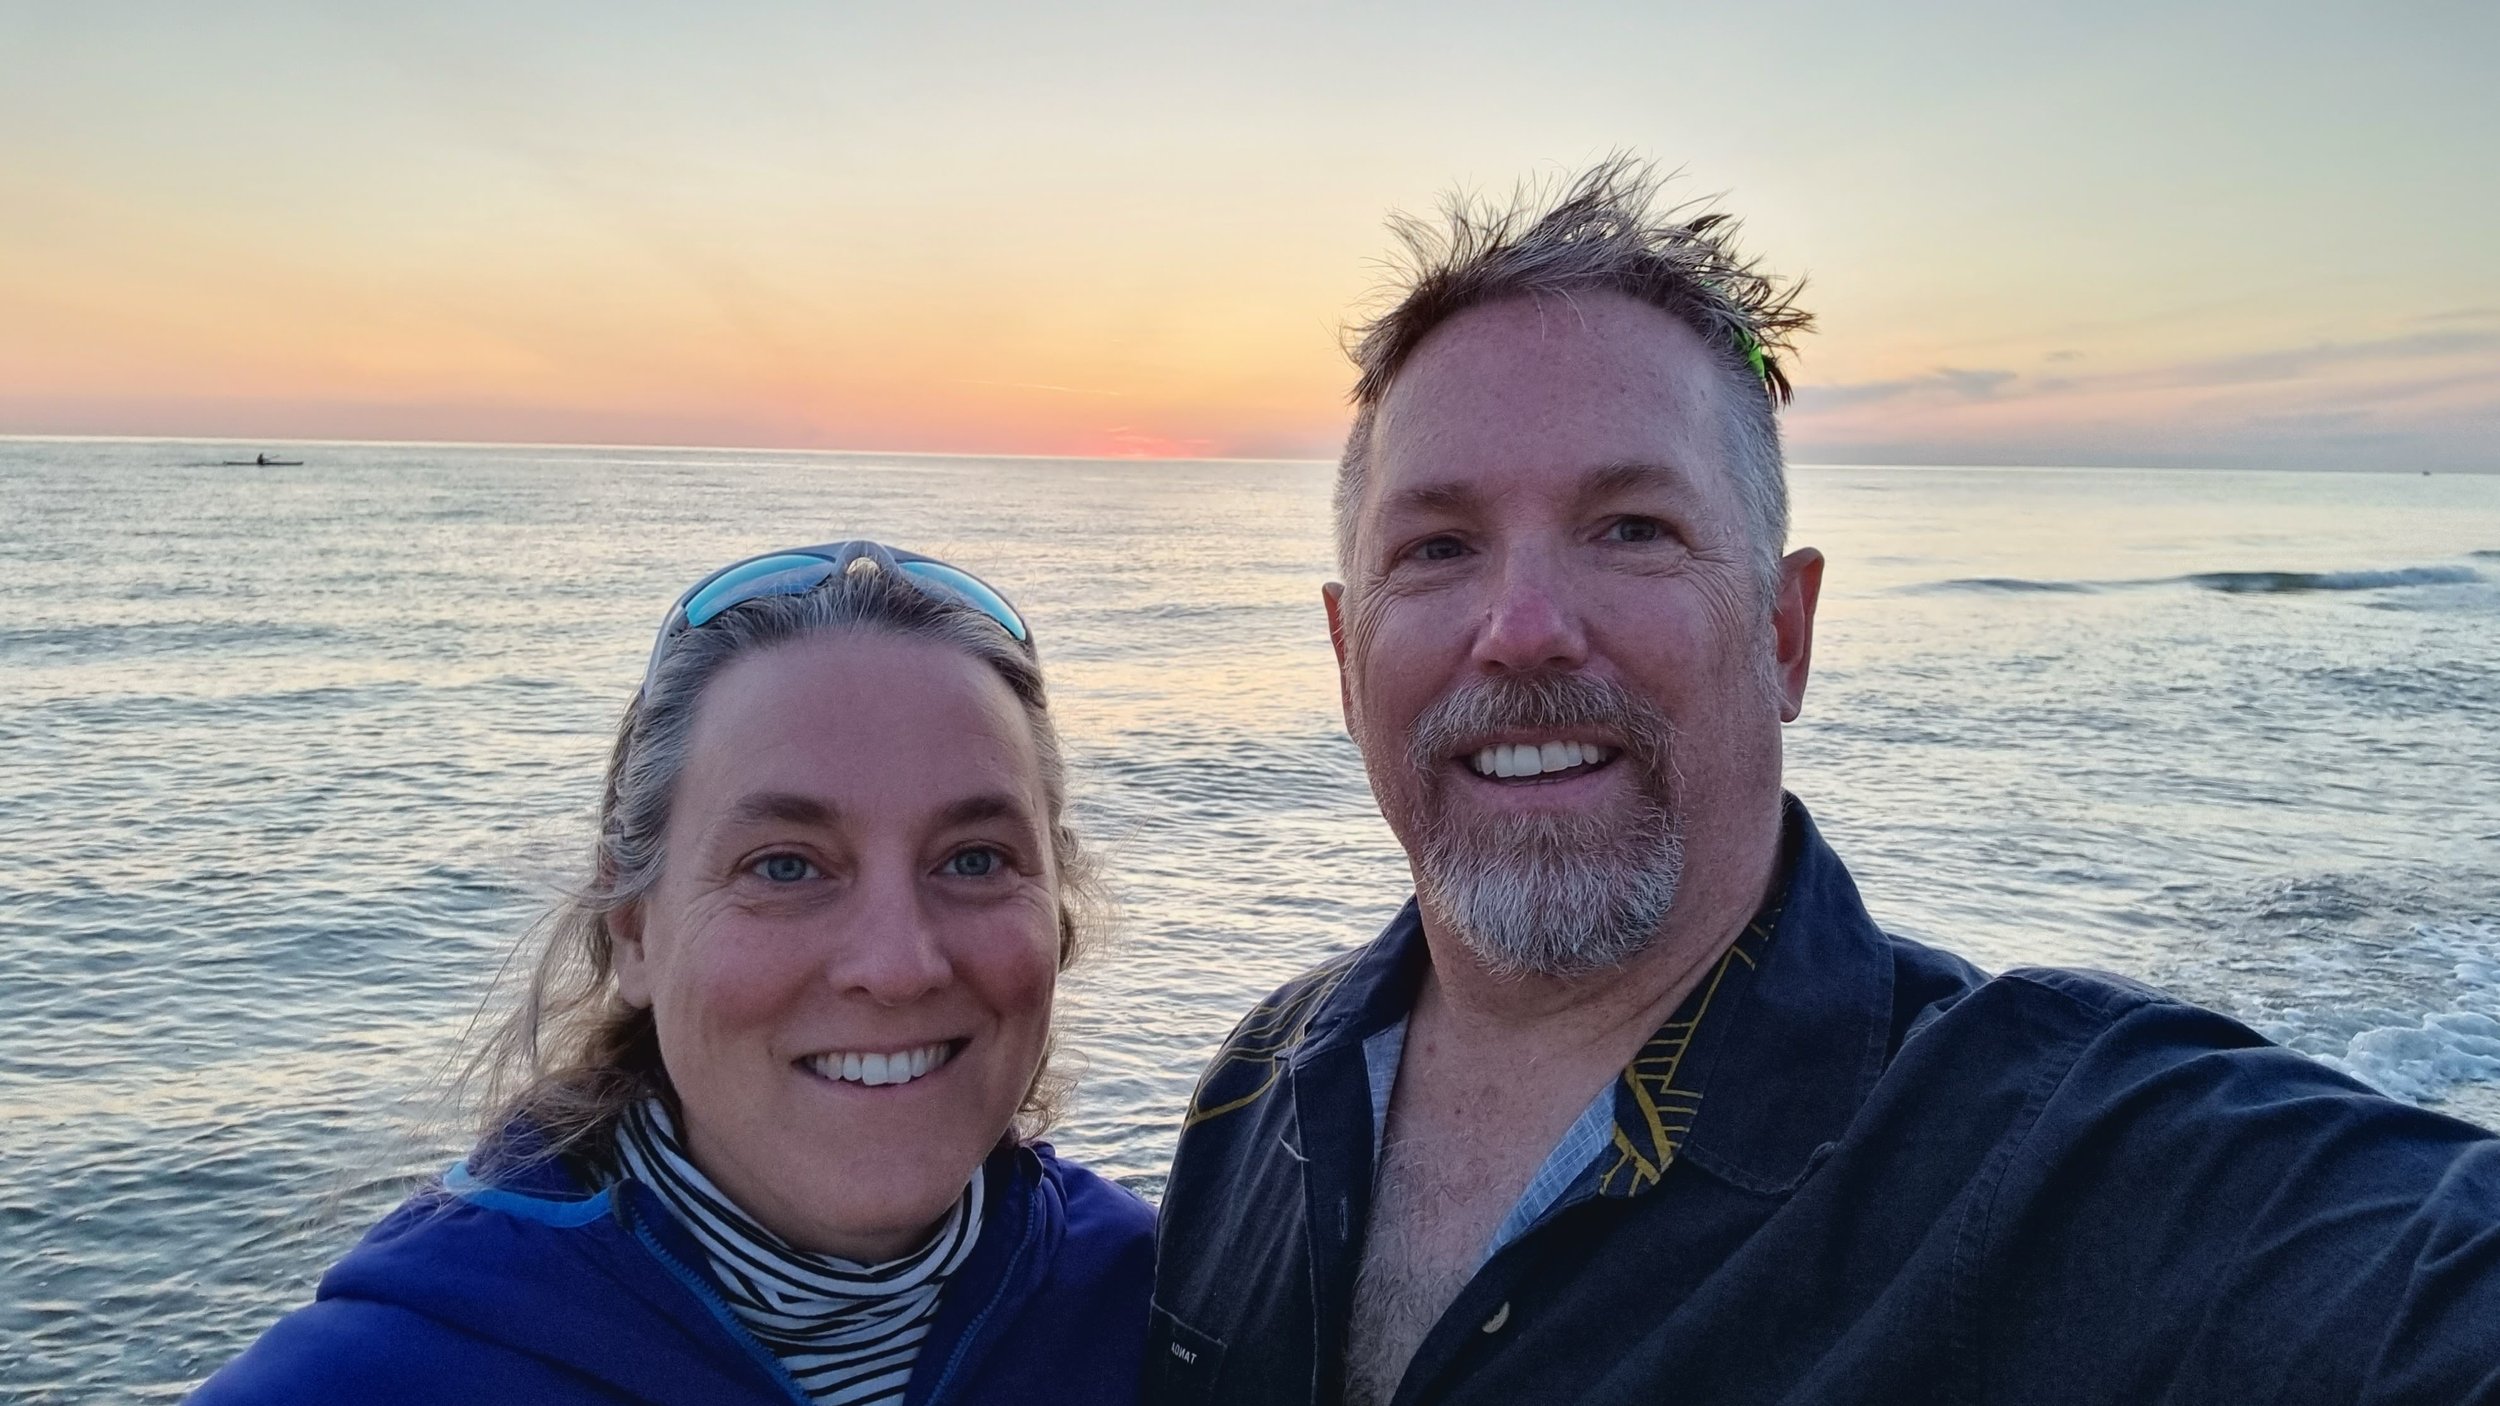
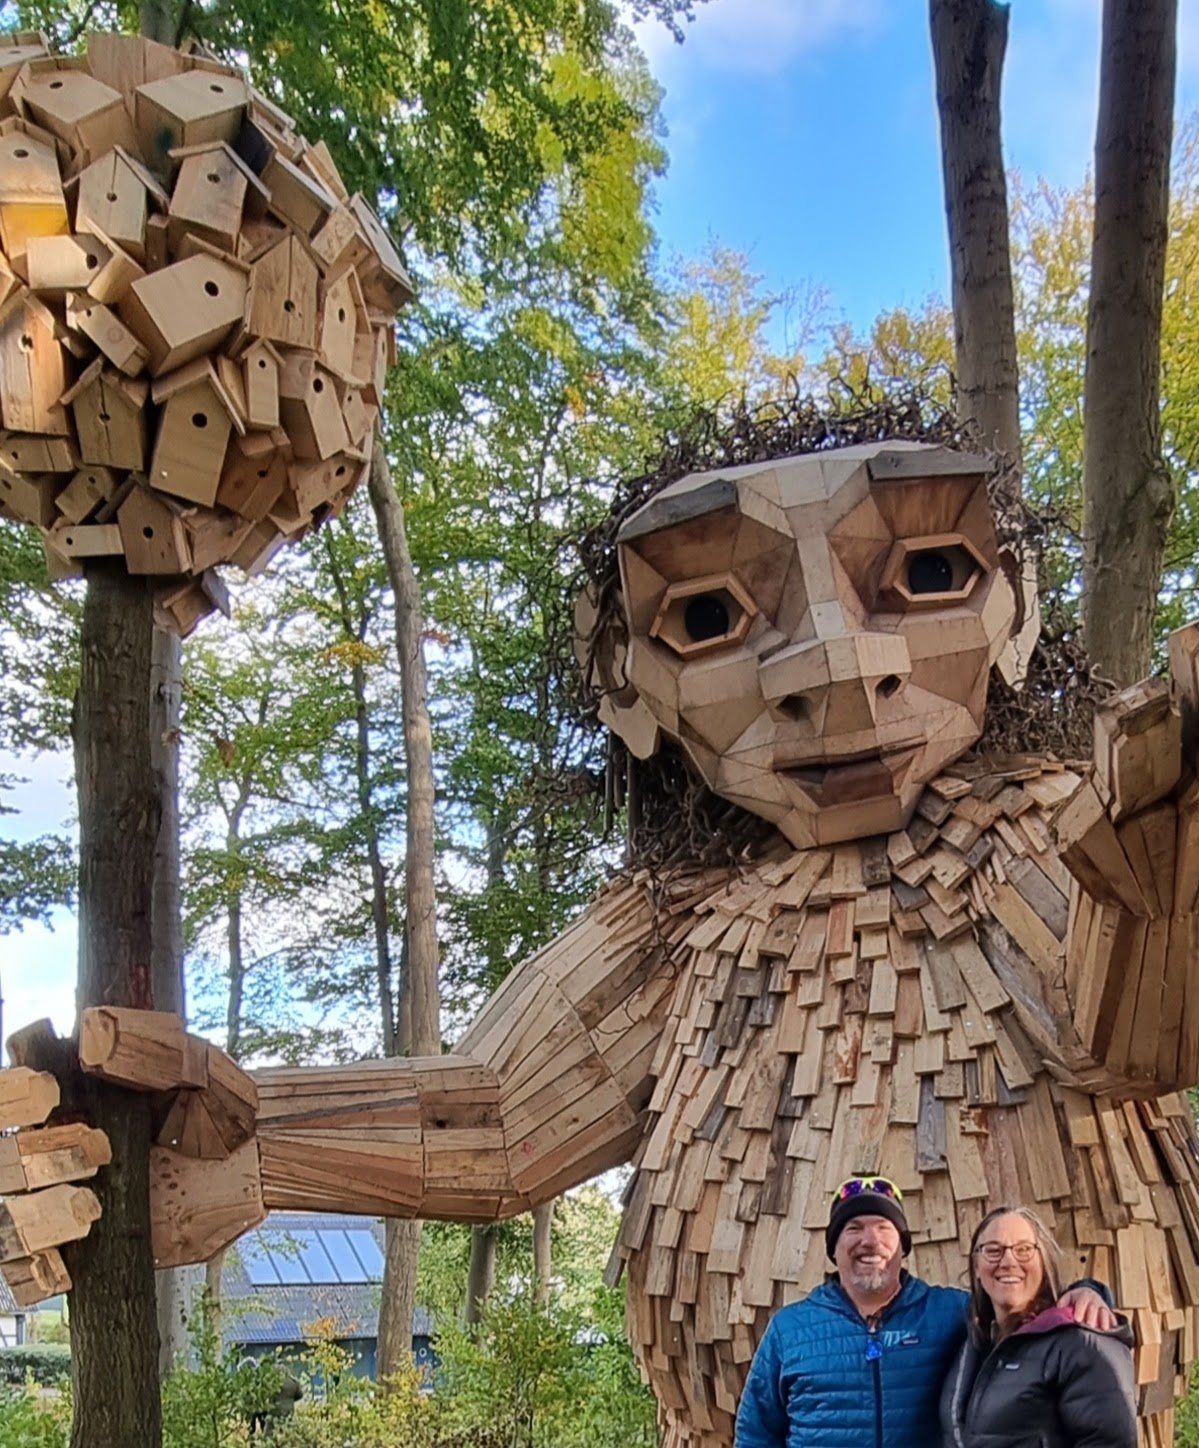
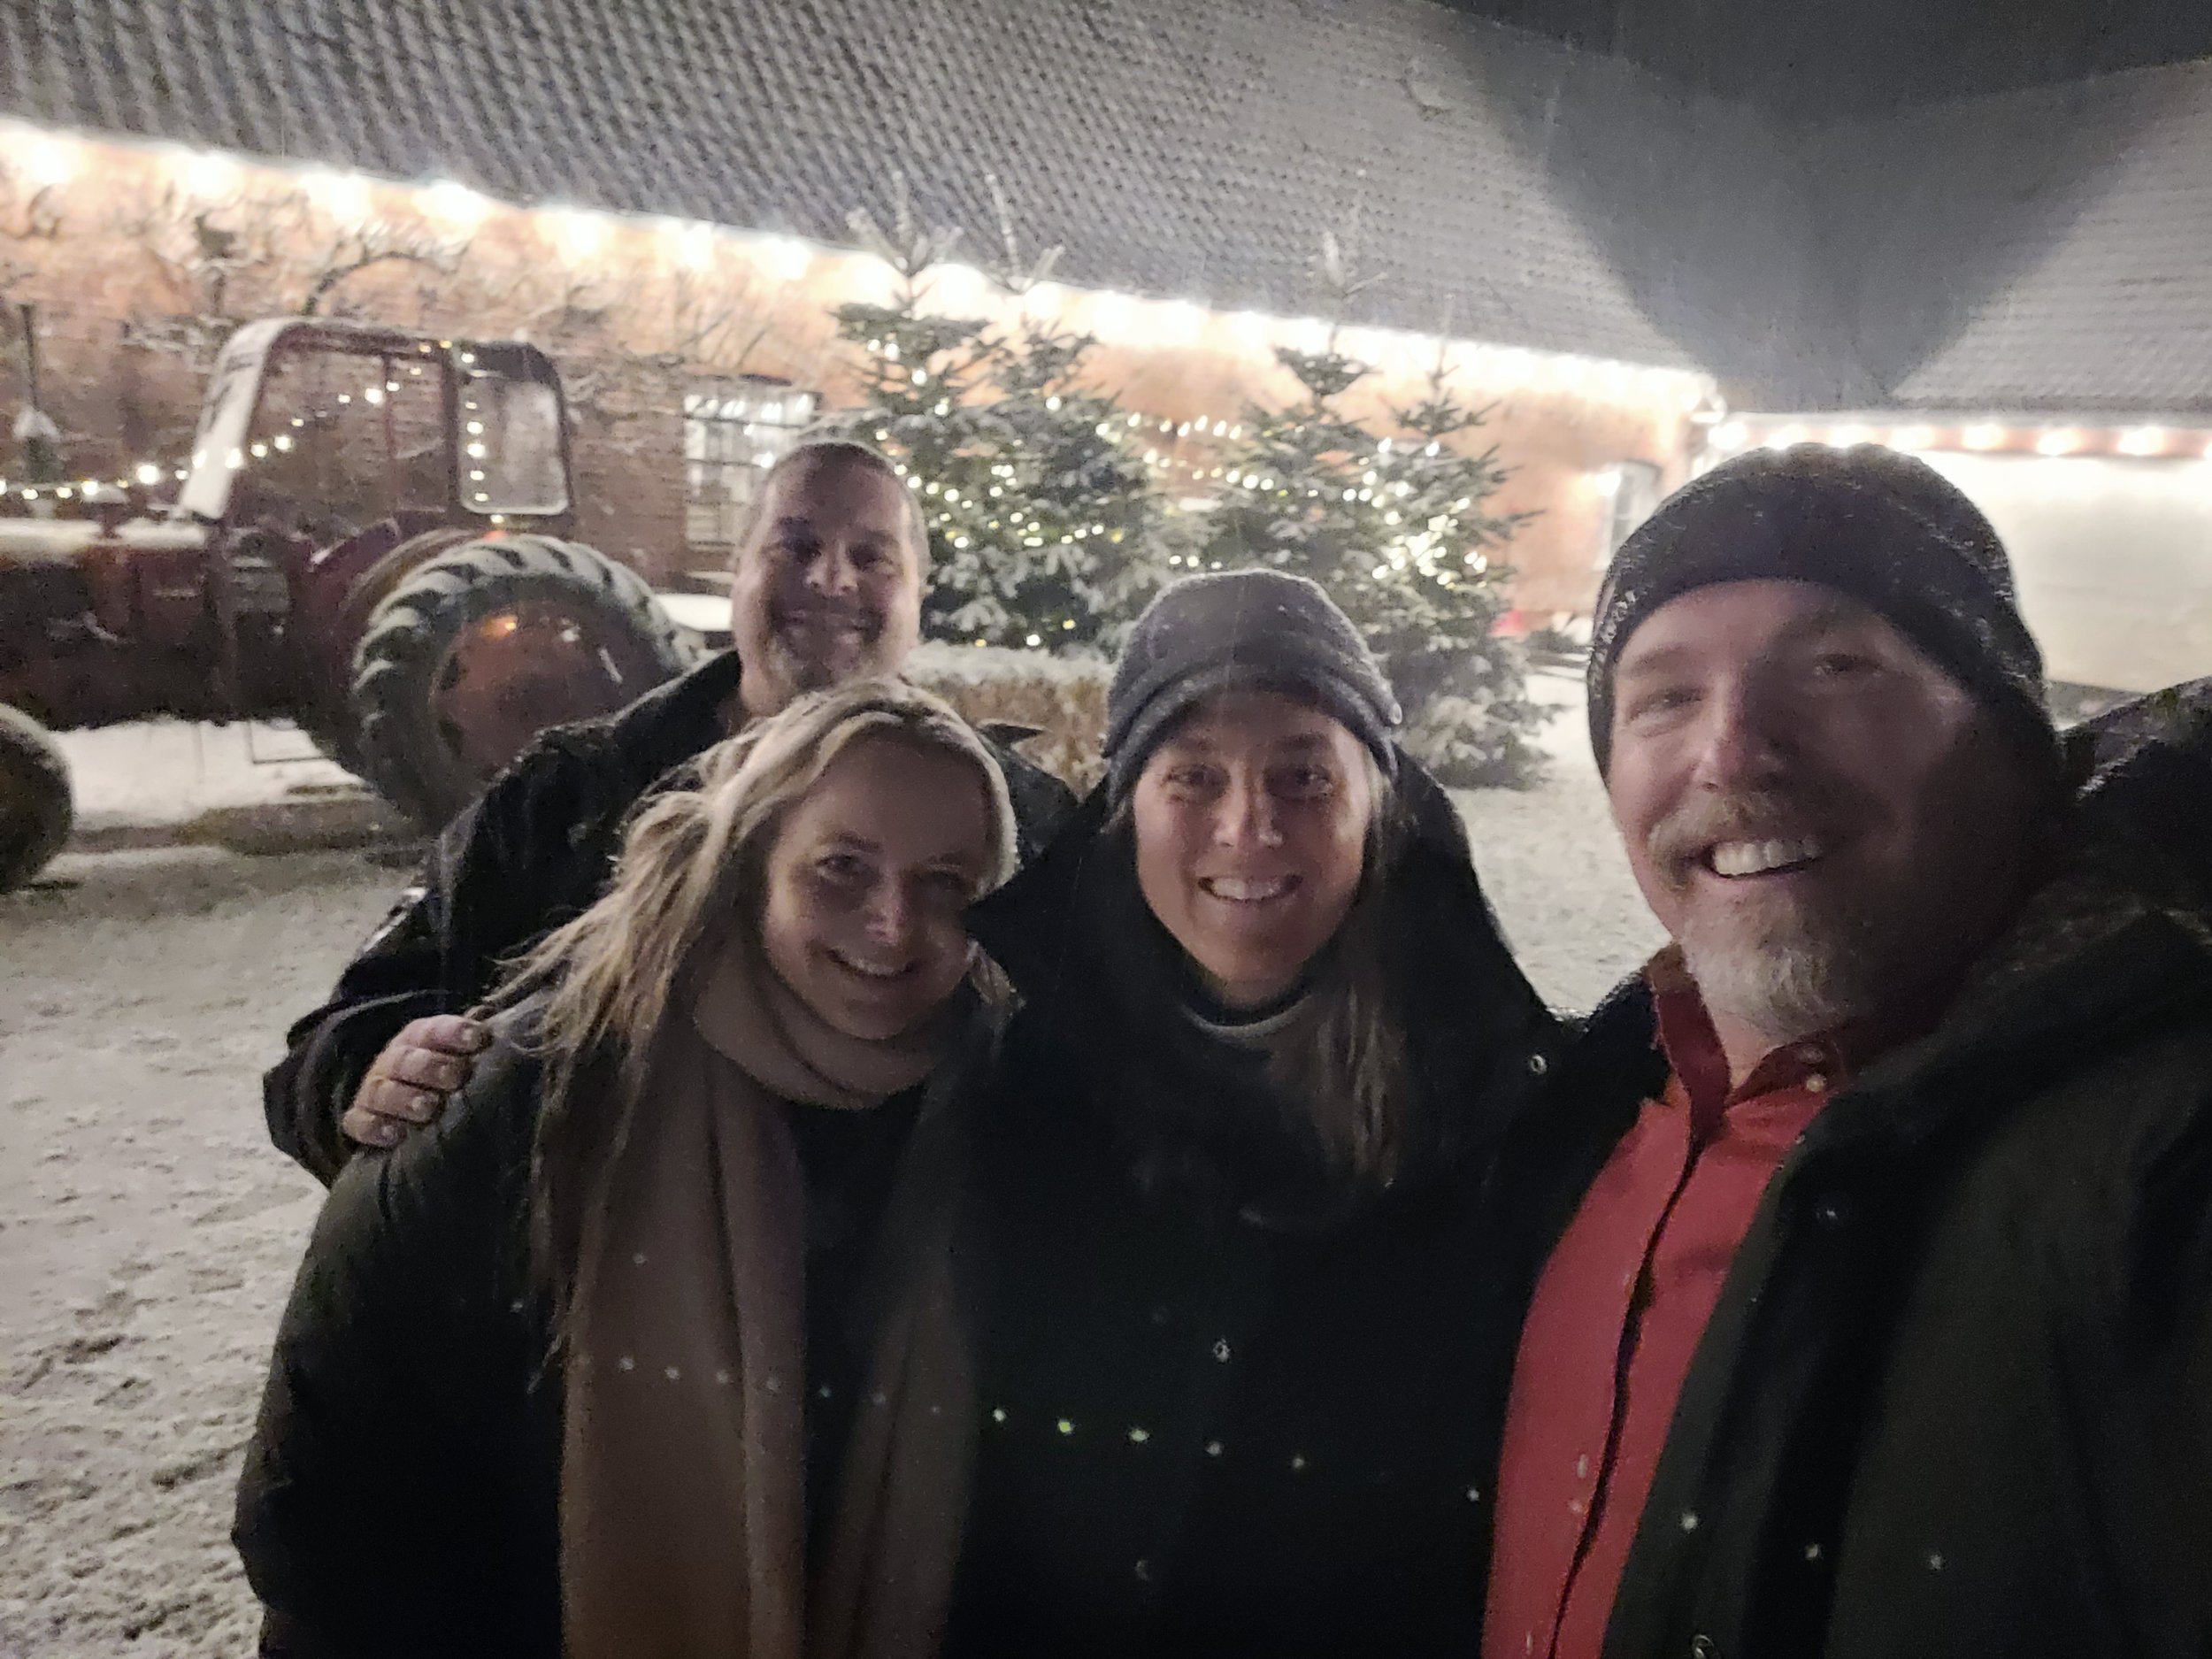
Kurt & Sarah
Gramsvej 3
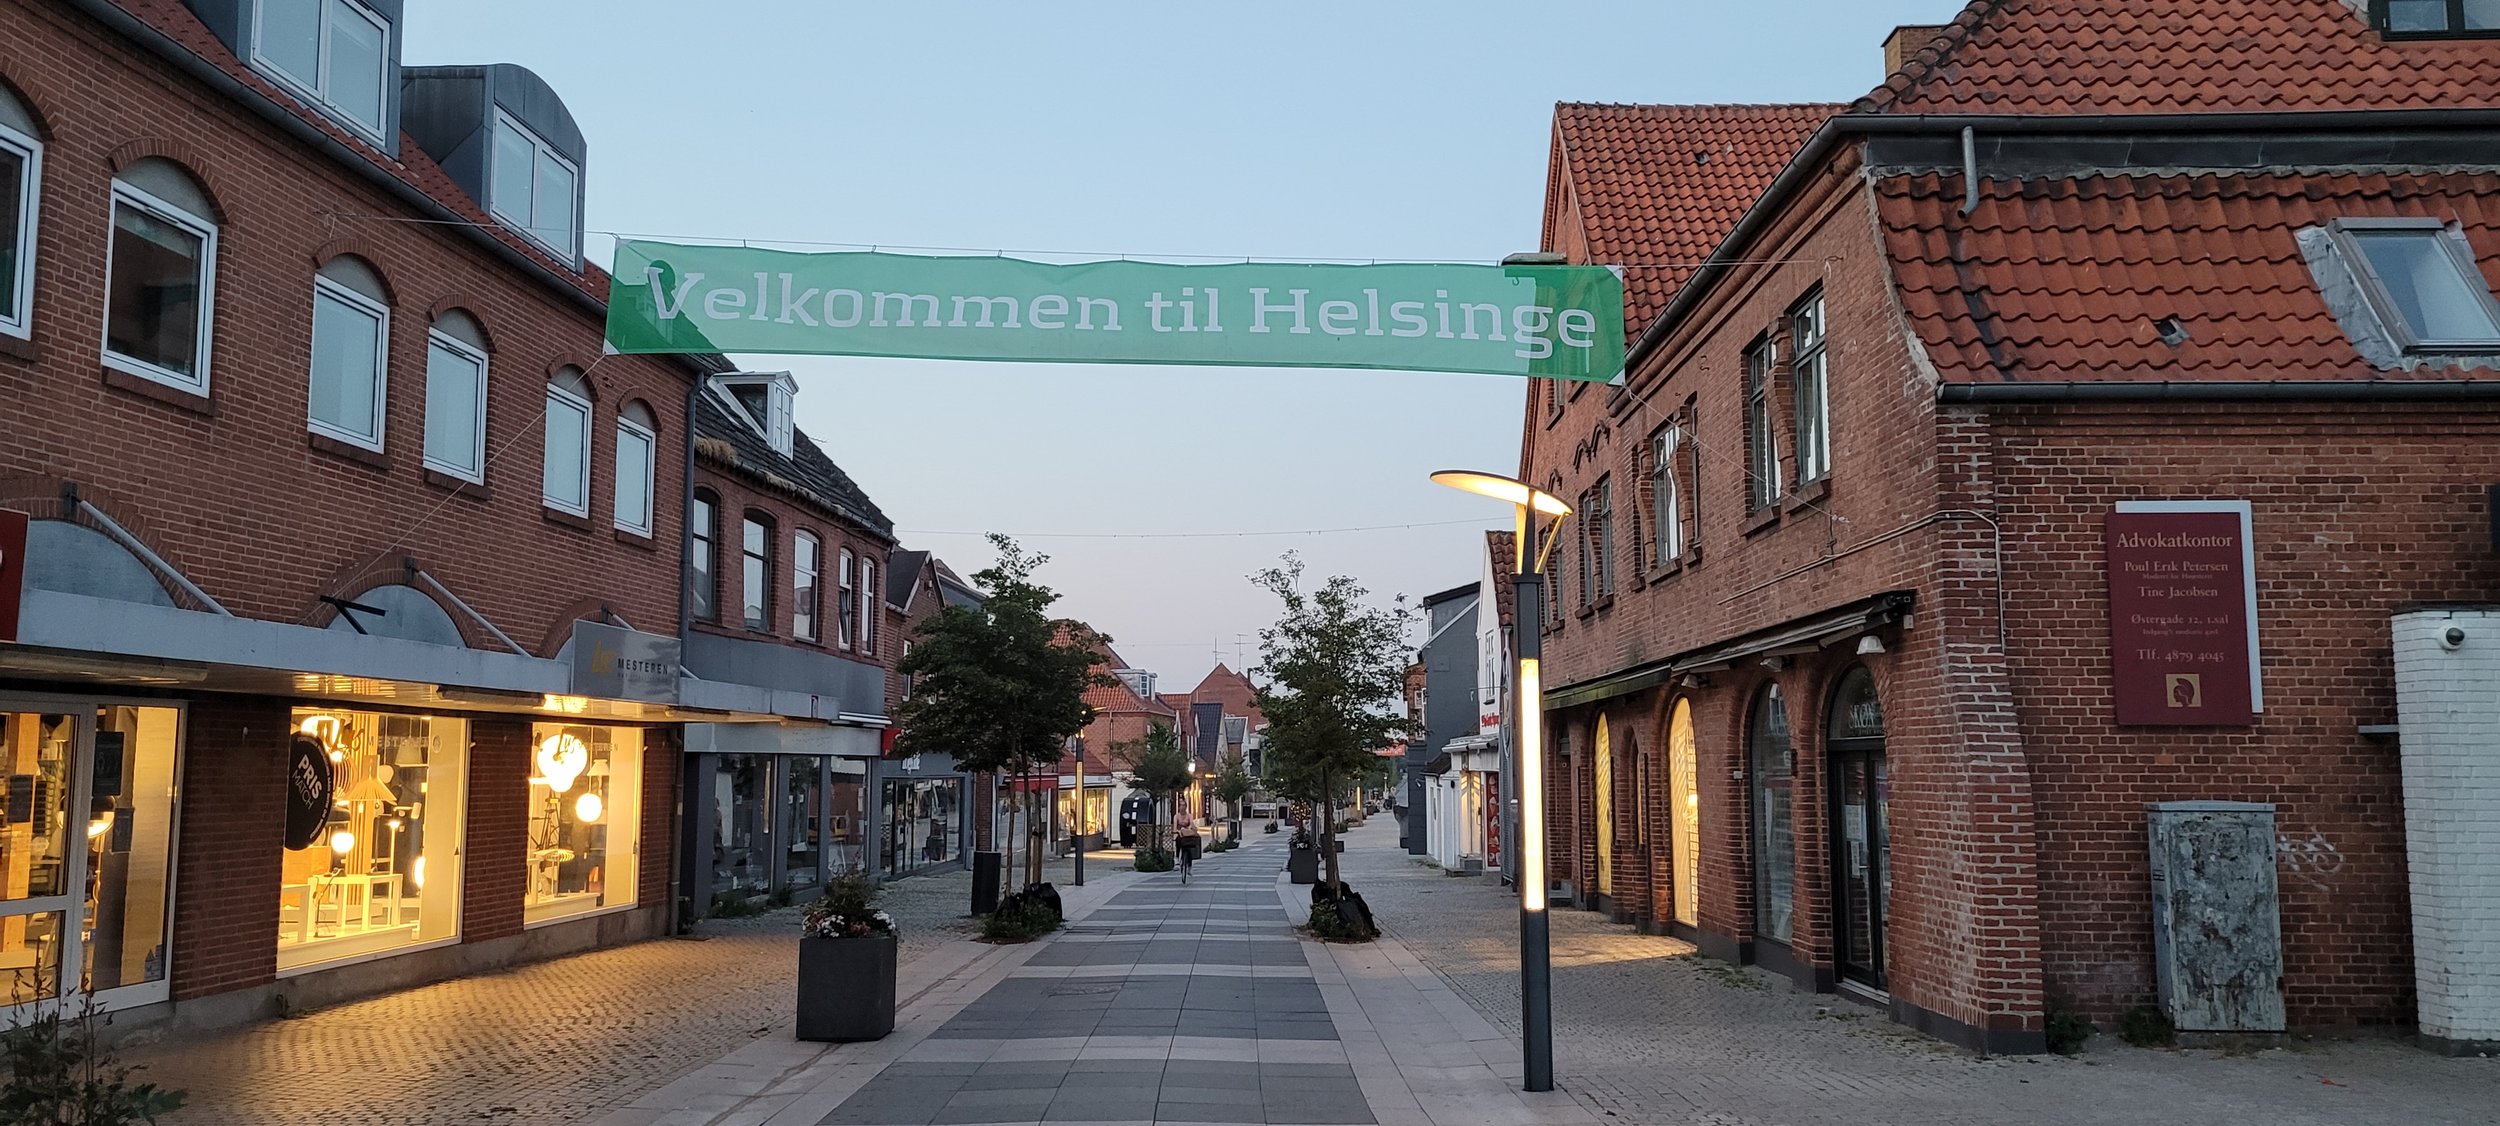
3200 Helsinge, Danmark

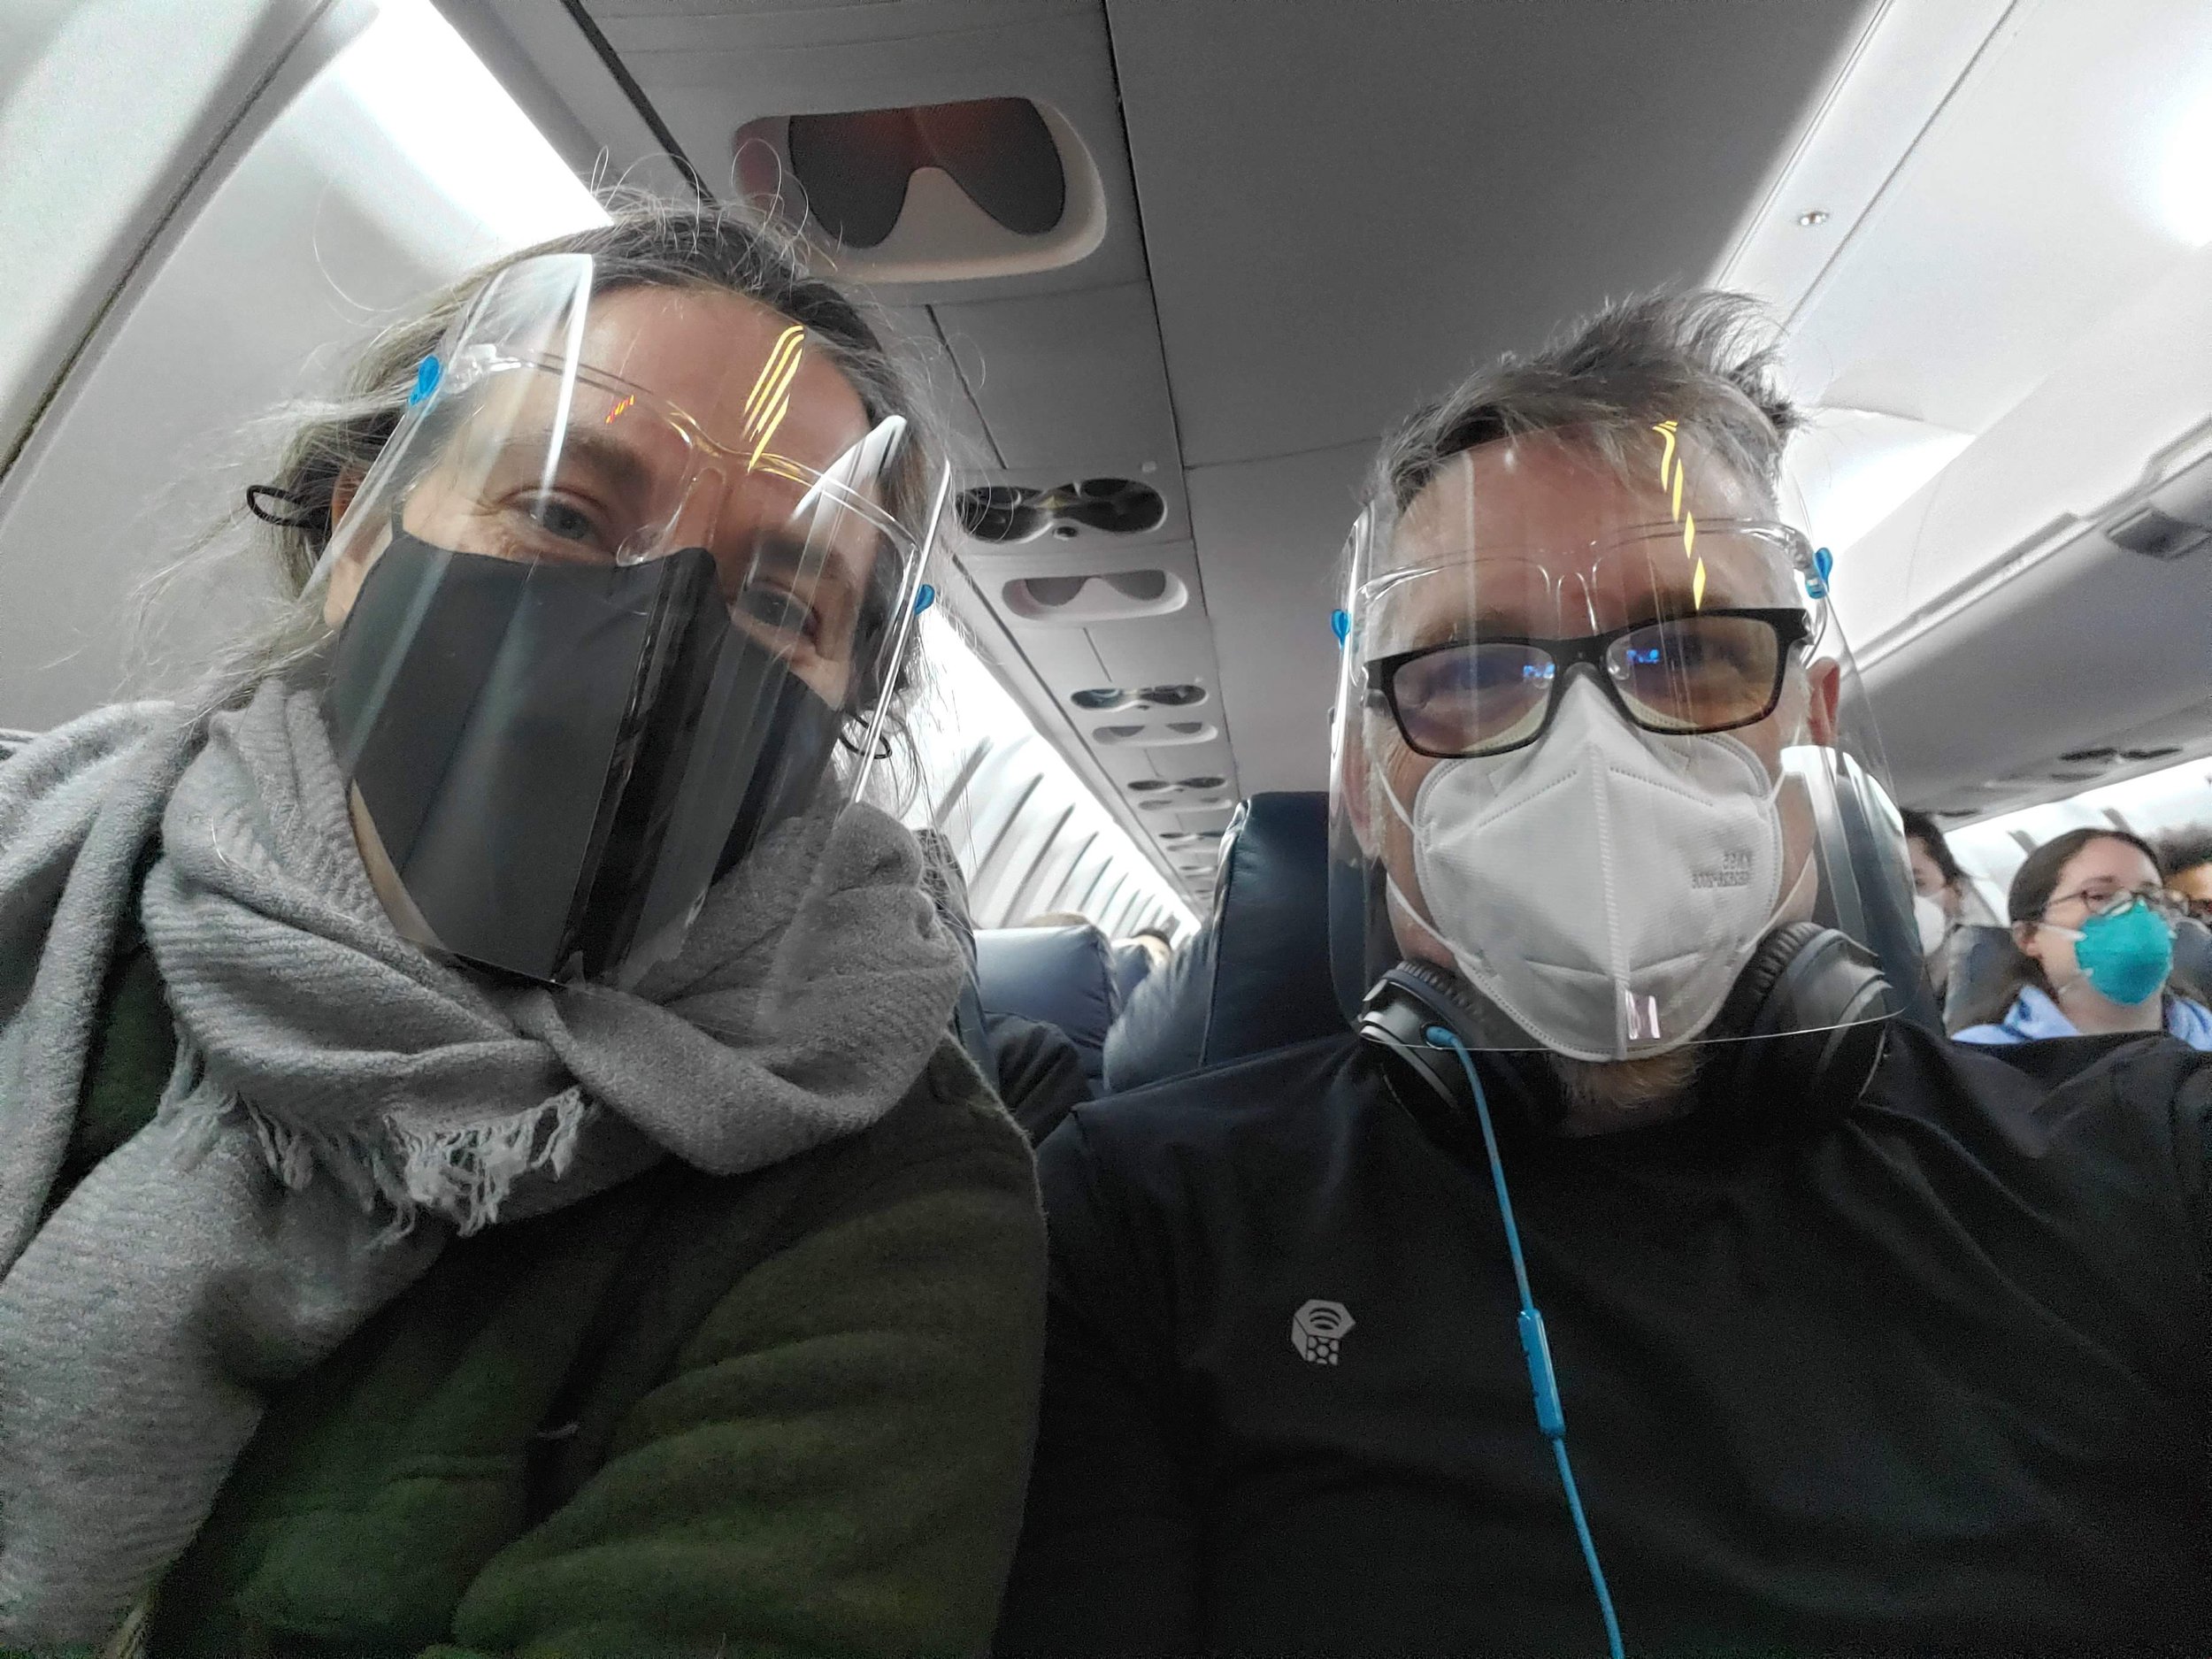
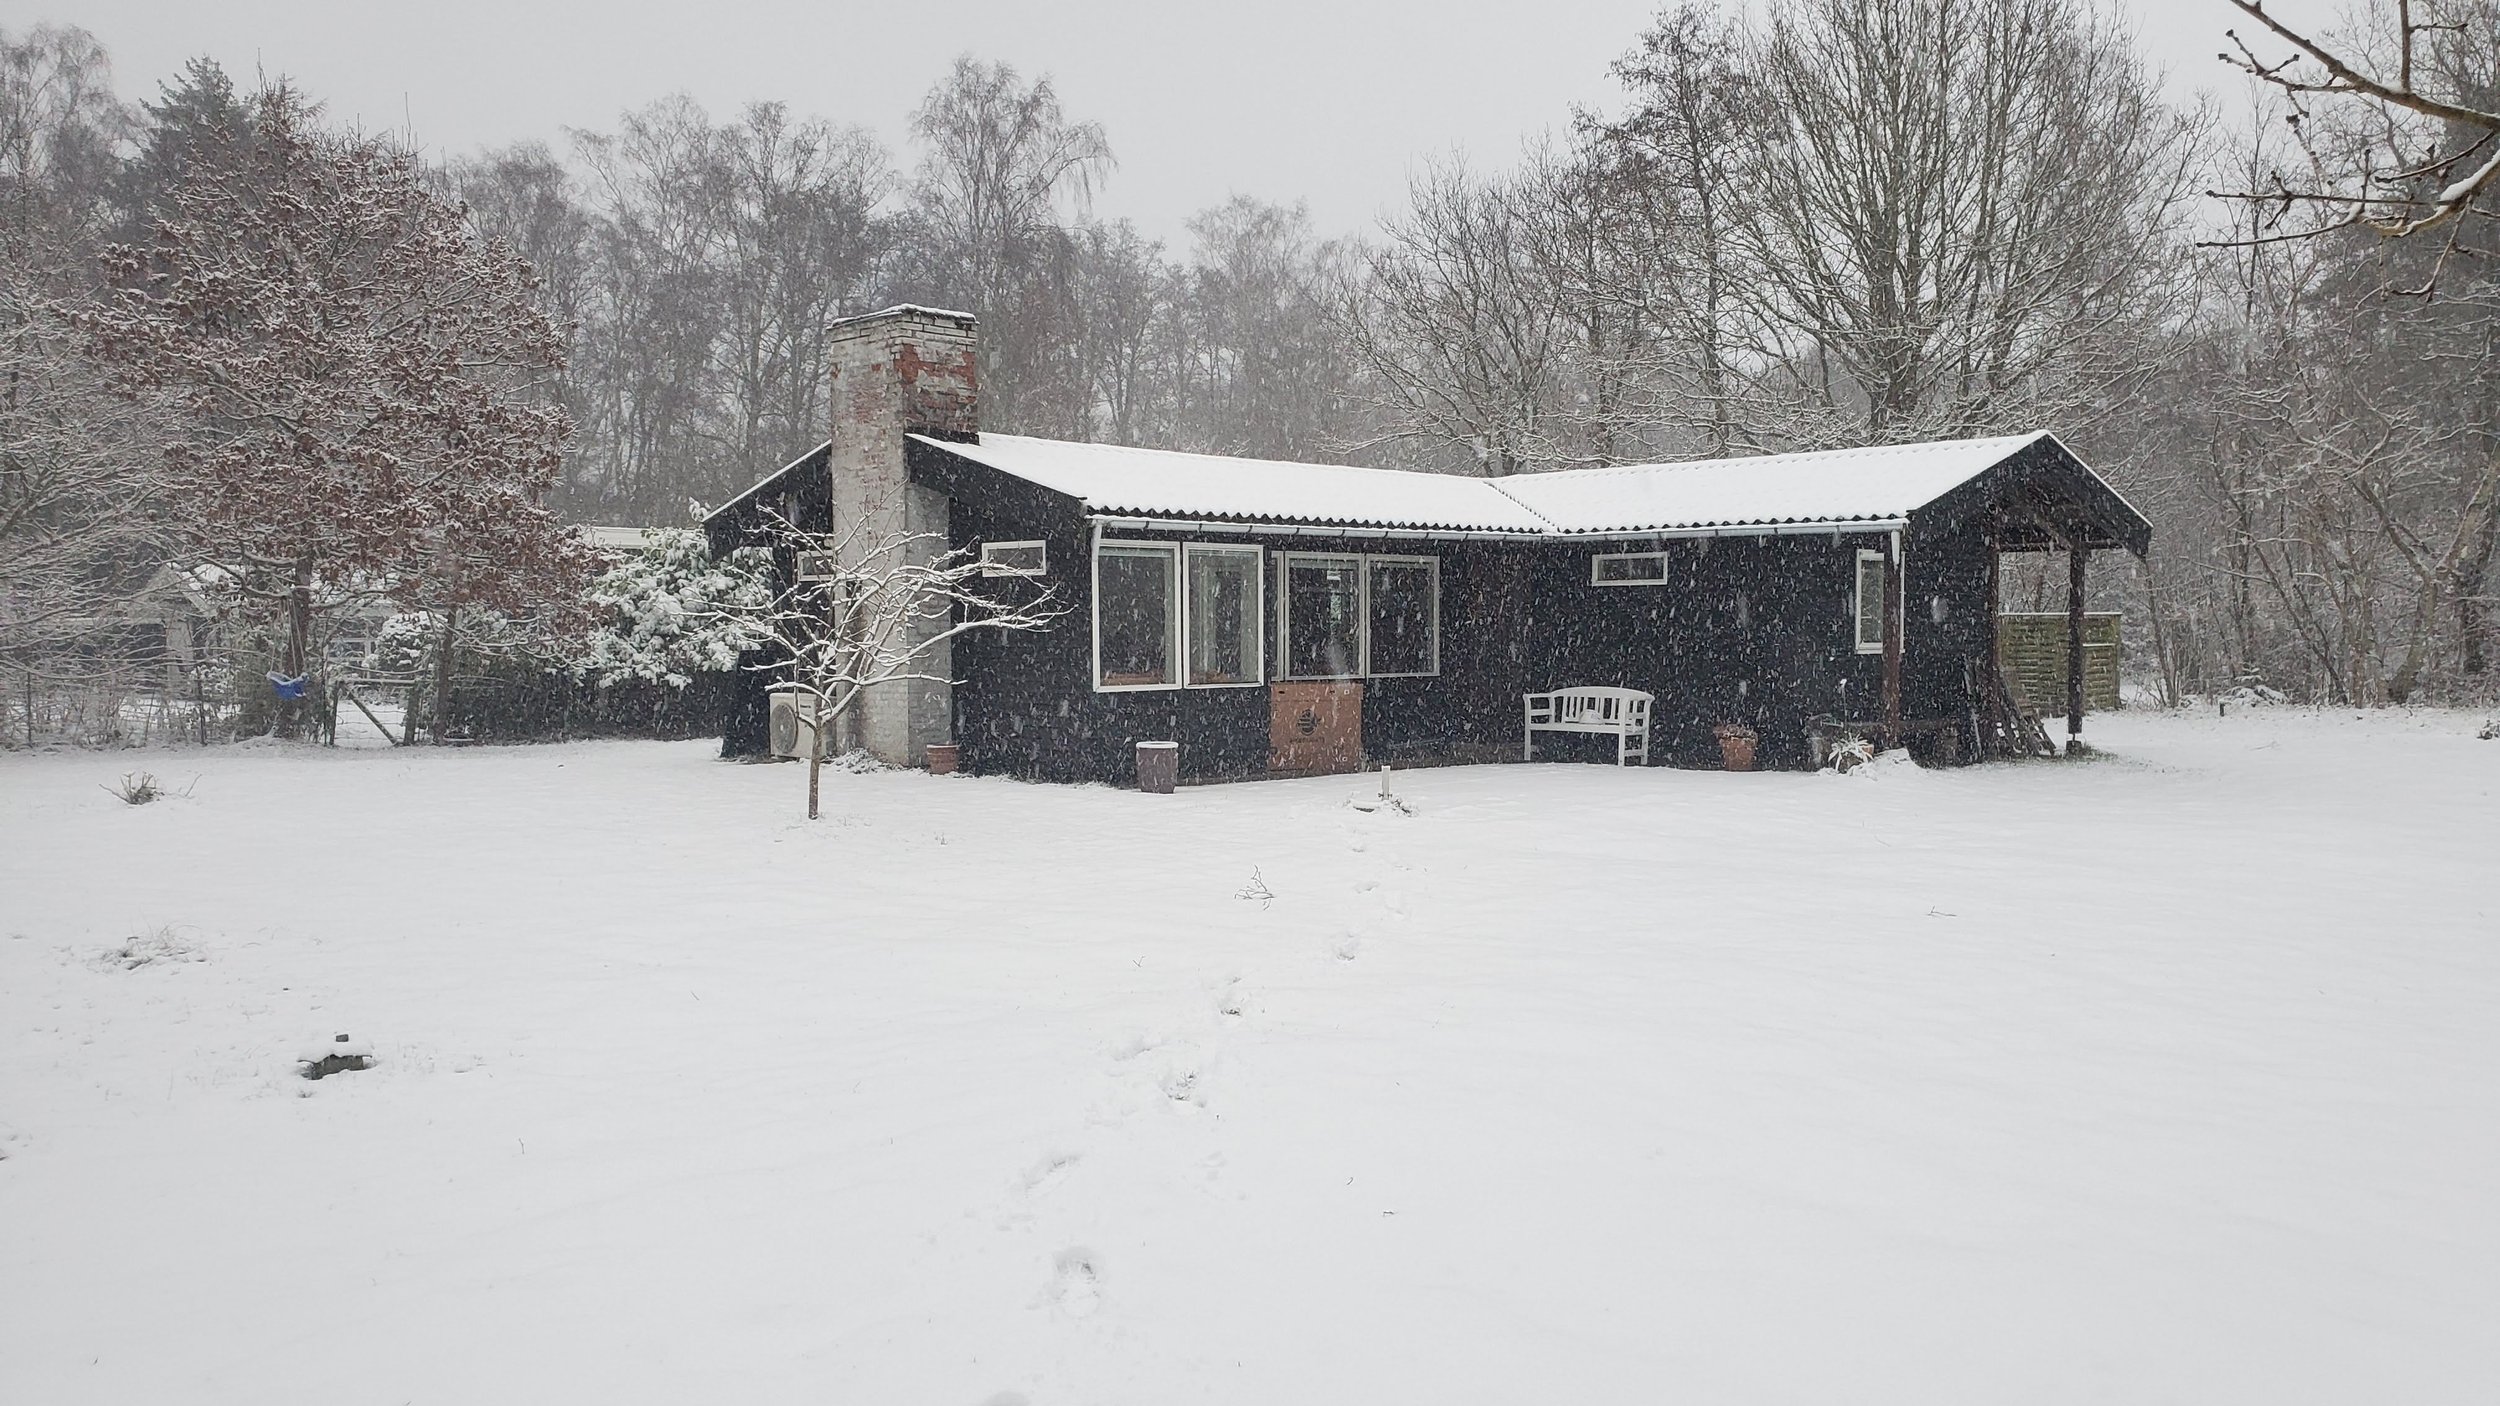
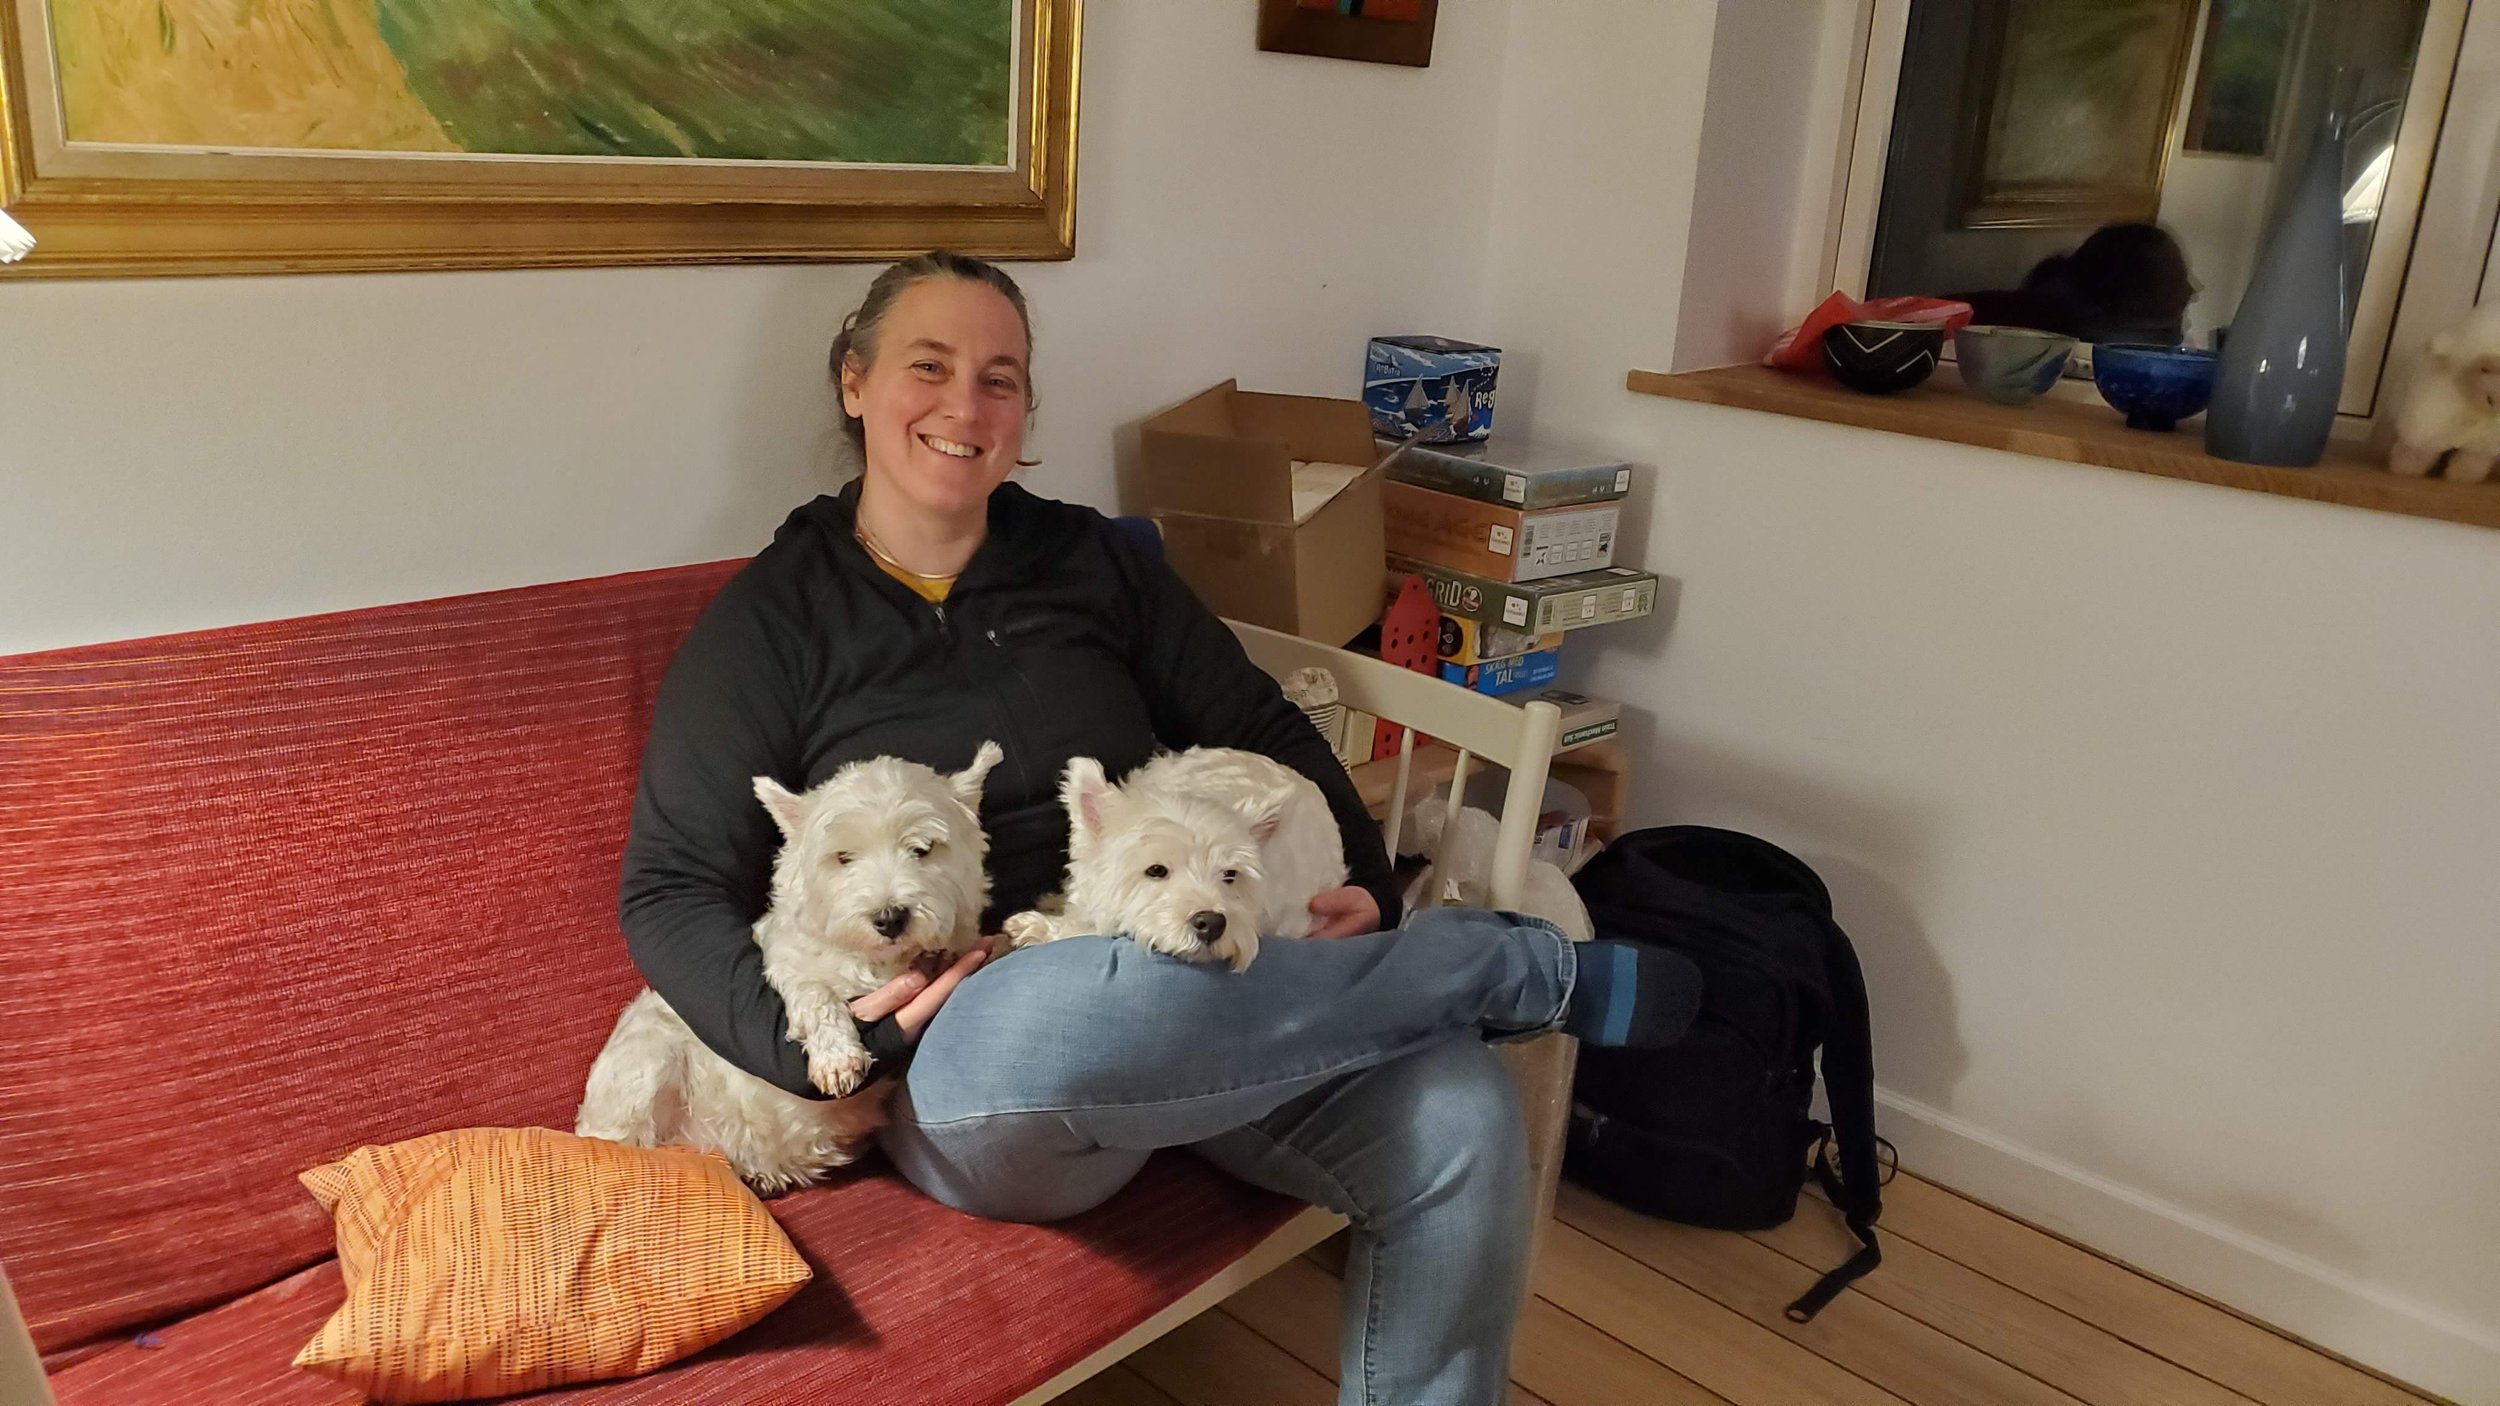
We are sitting in our house on a peaceful Sunday morning. It is week 51, and the days have less than 7 hours of daylight now. It’s the day before the solstice and our one year anniversary of living in Denmark  is fast approaching. We have now experienced all the seasons and have learned a lot about our new country. 

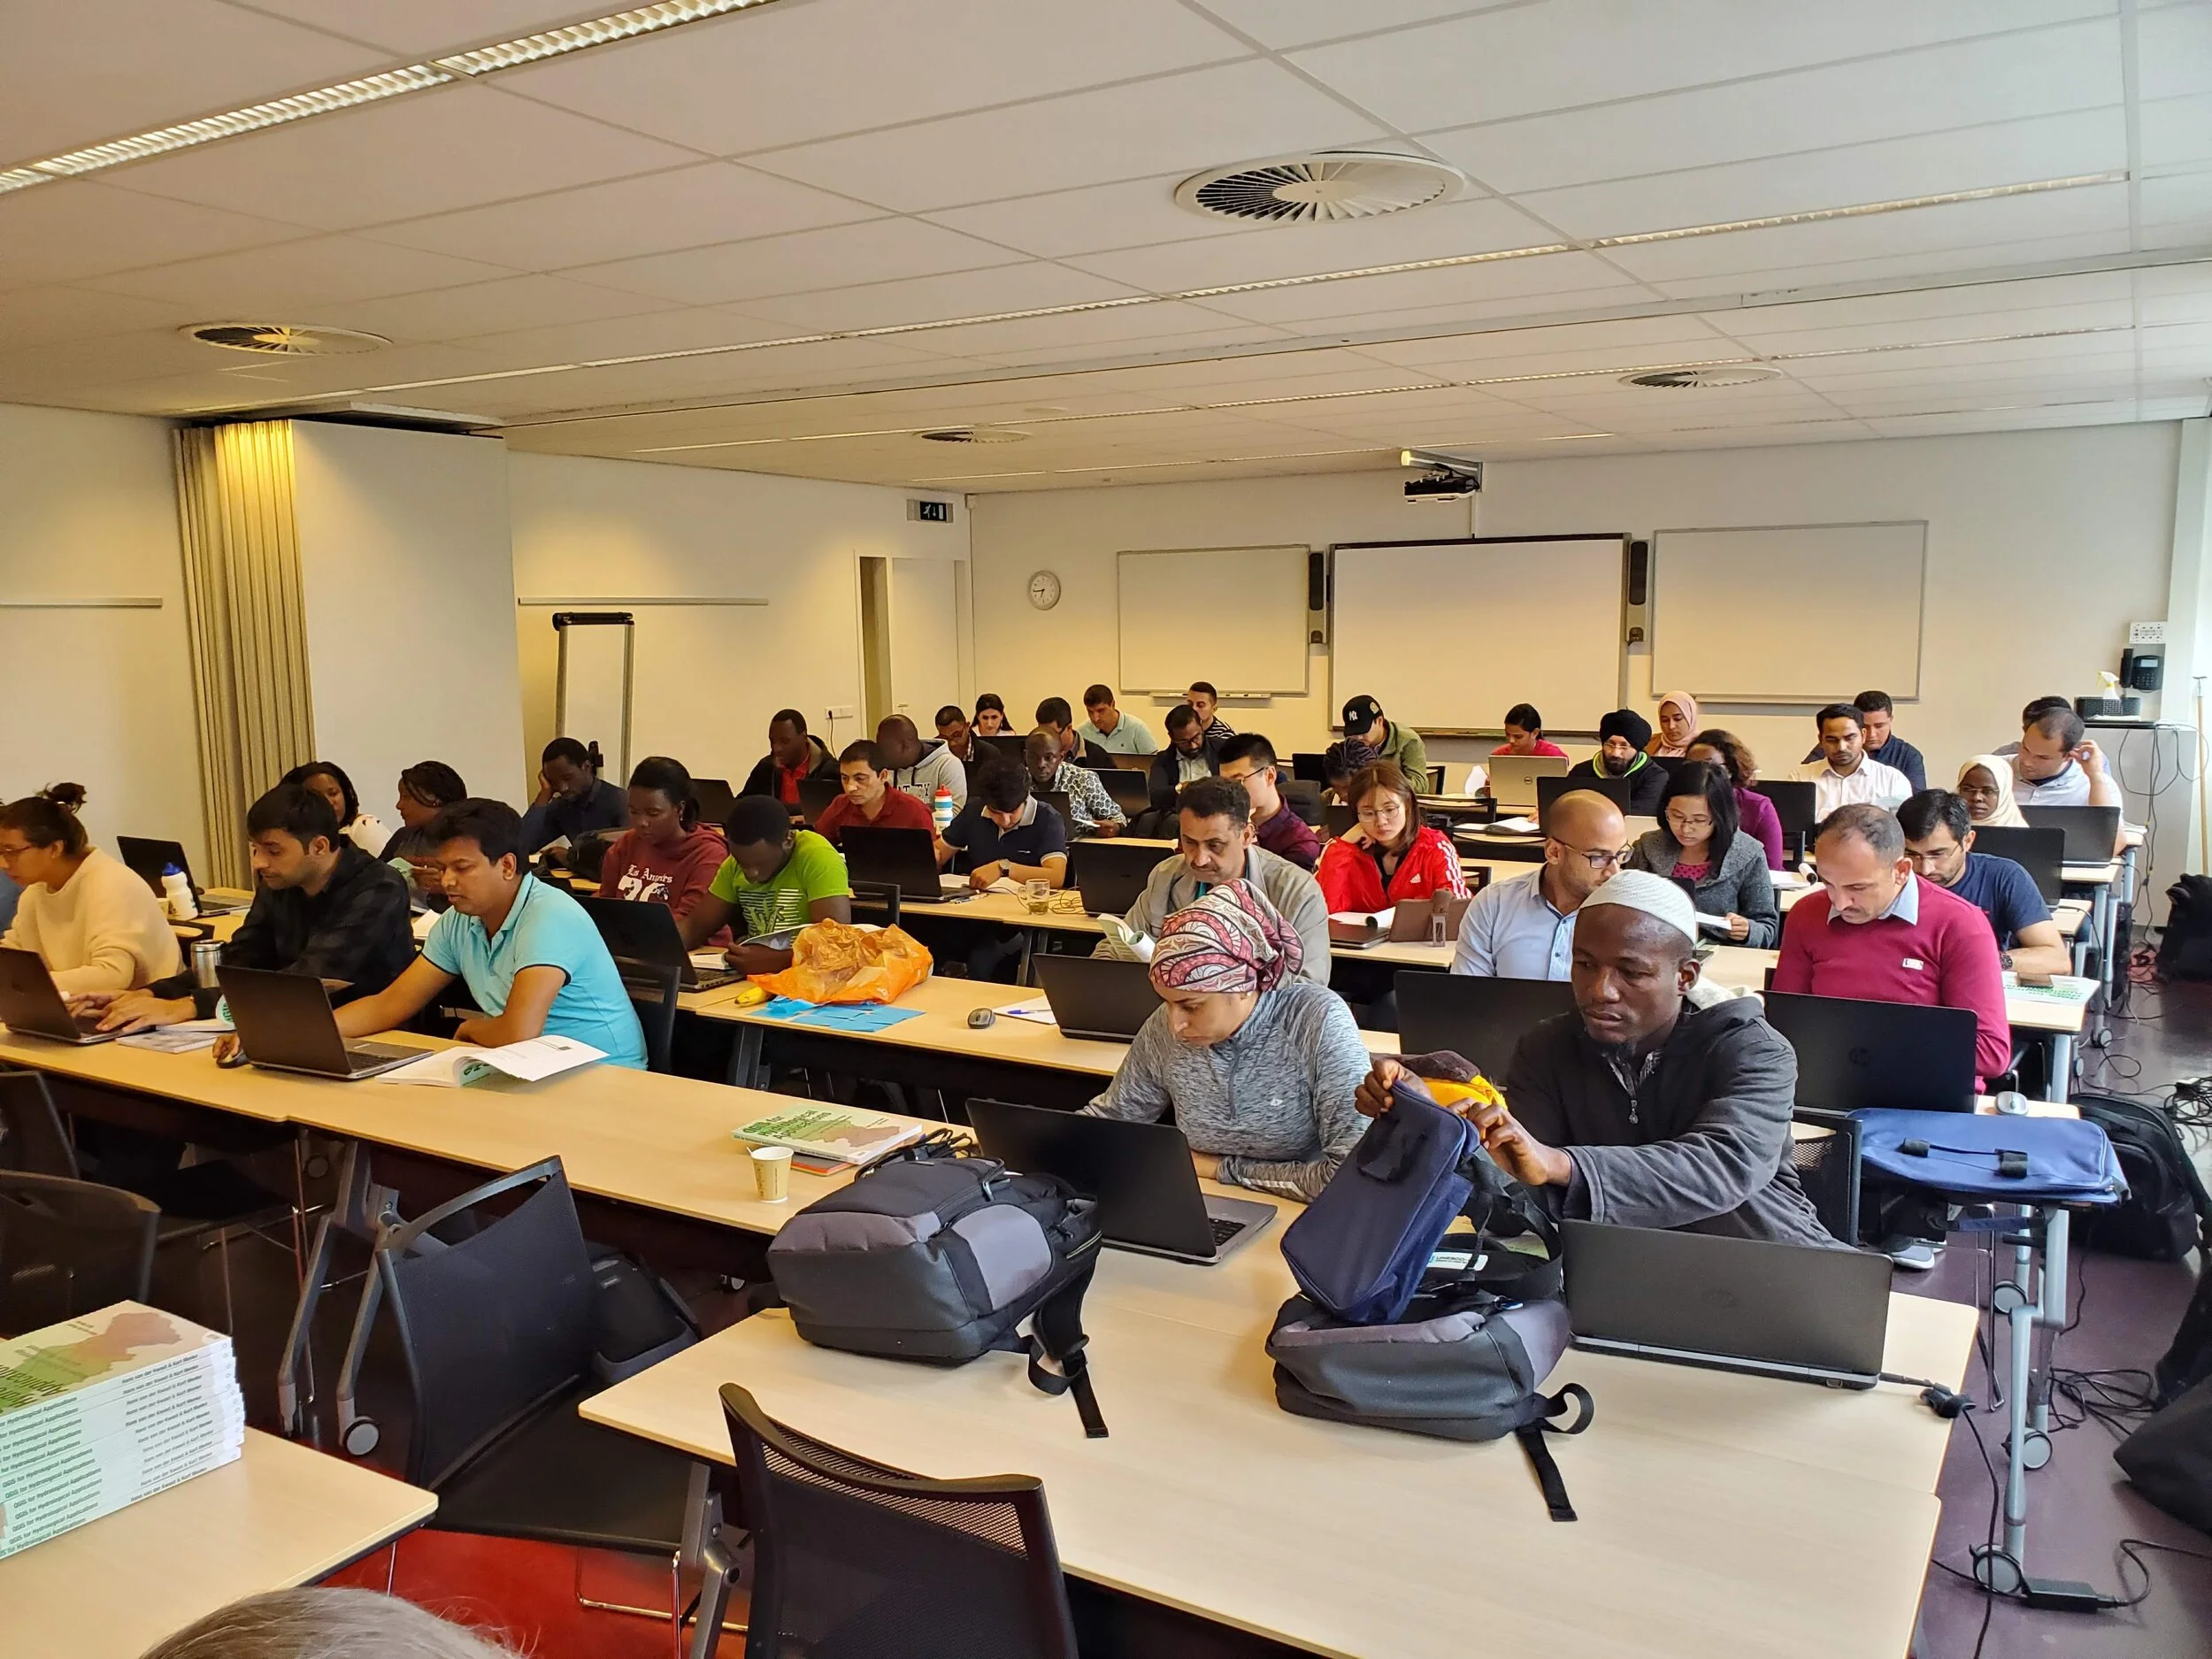
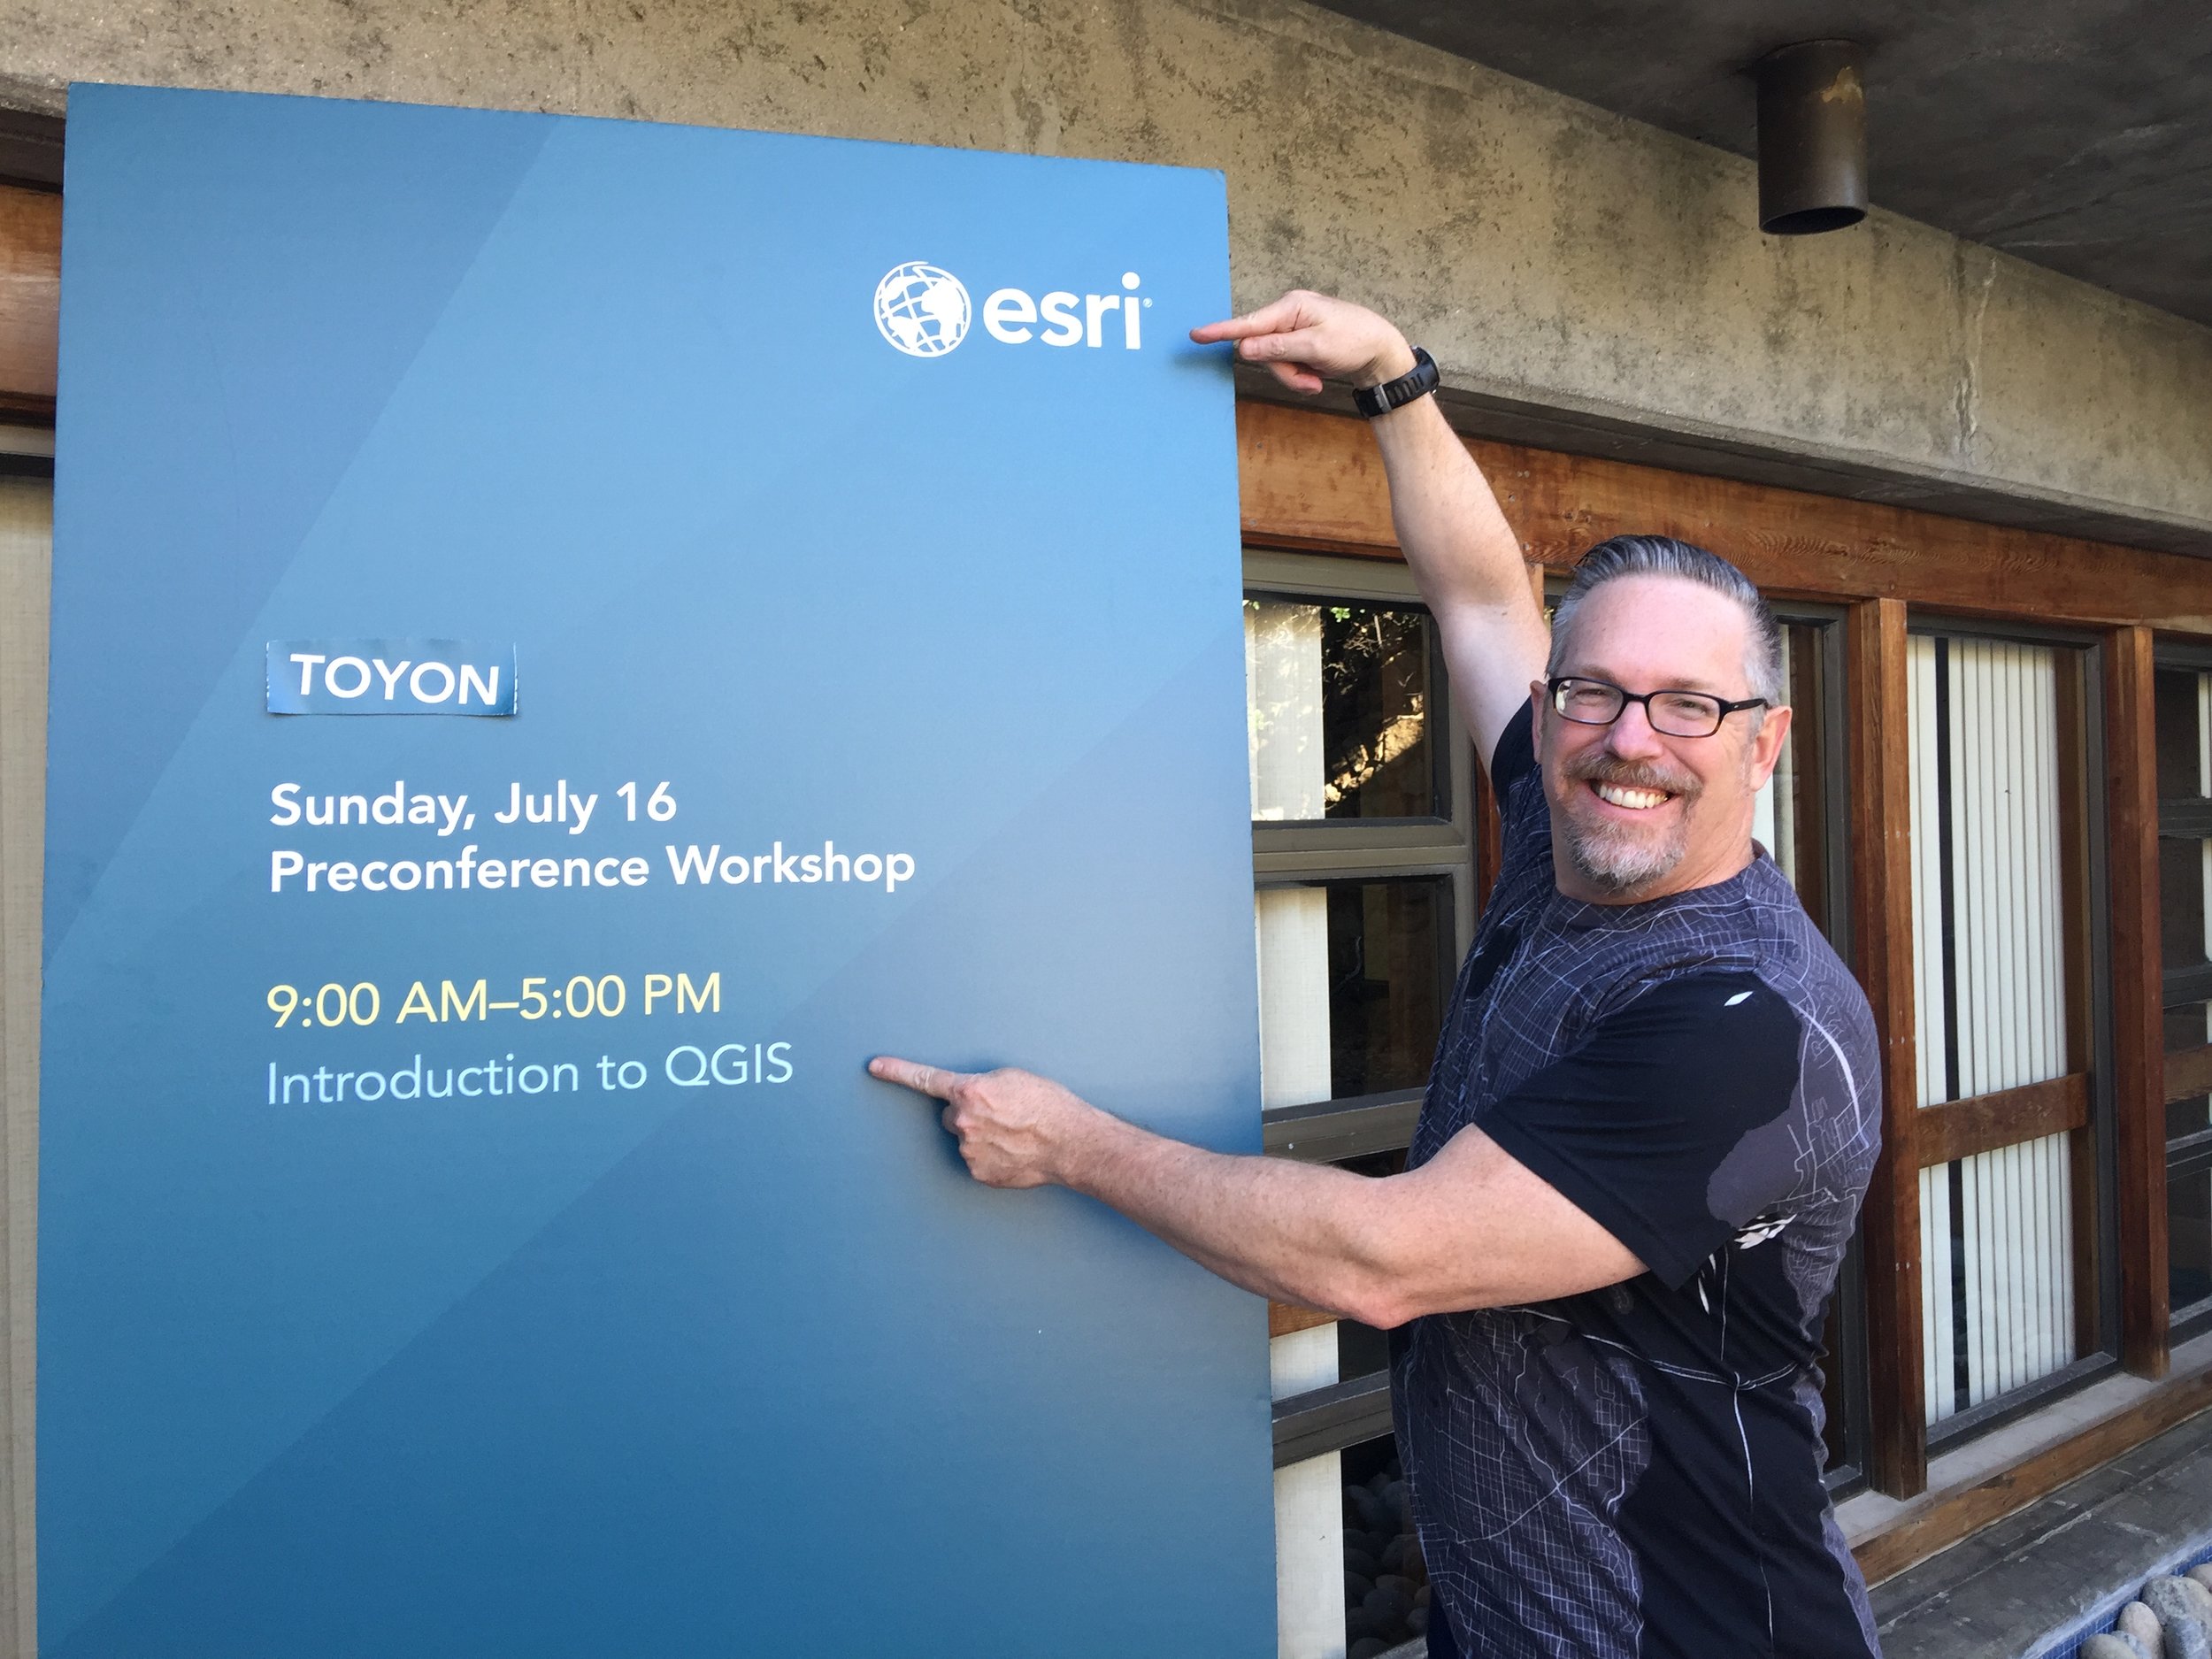
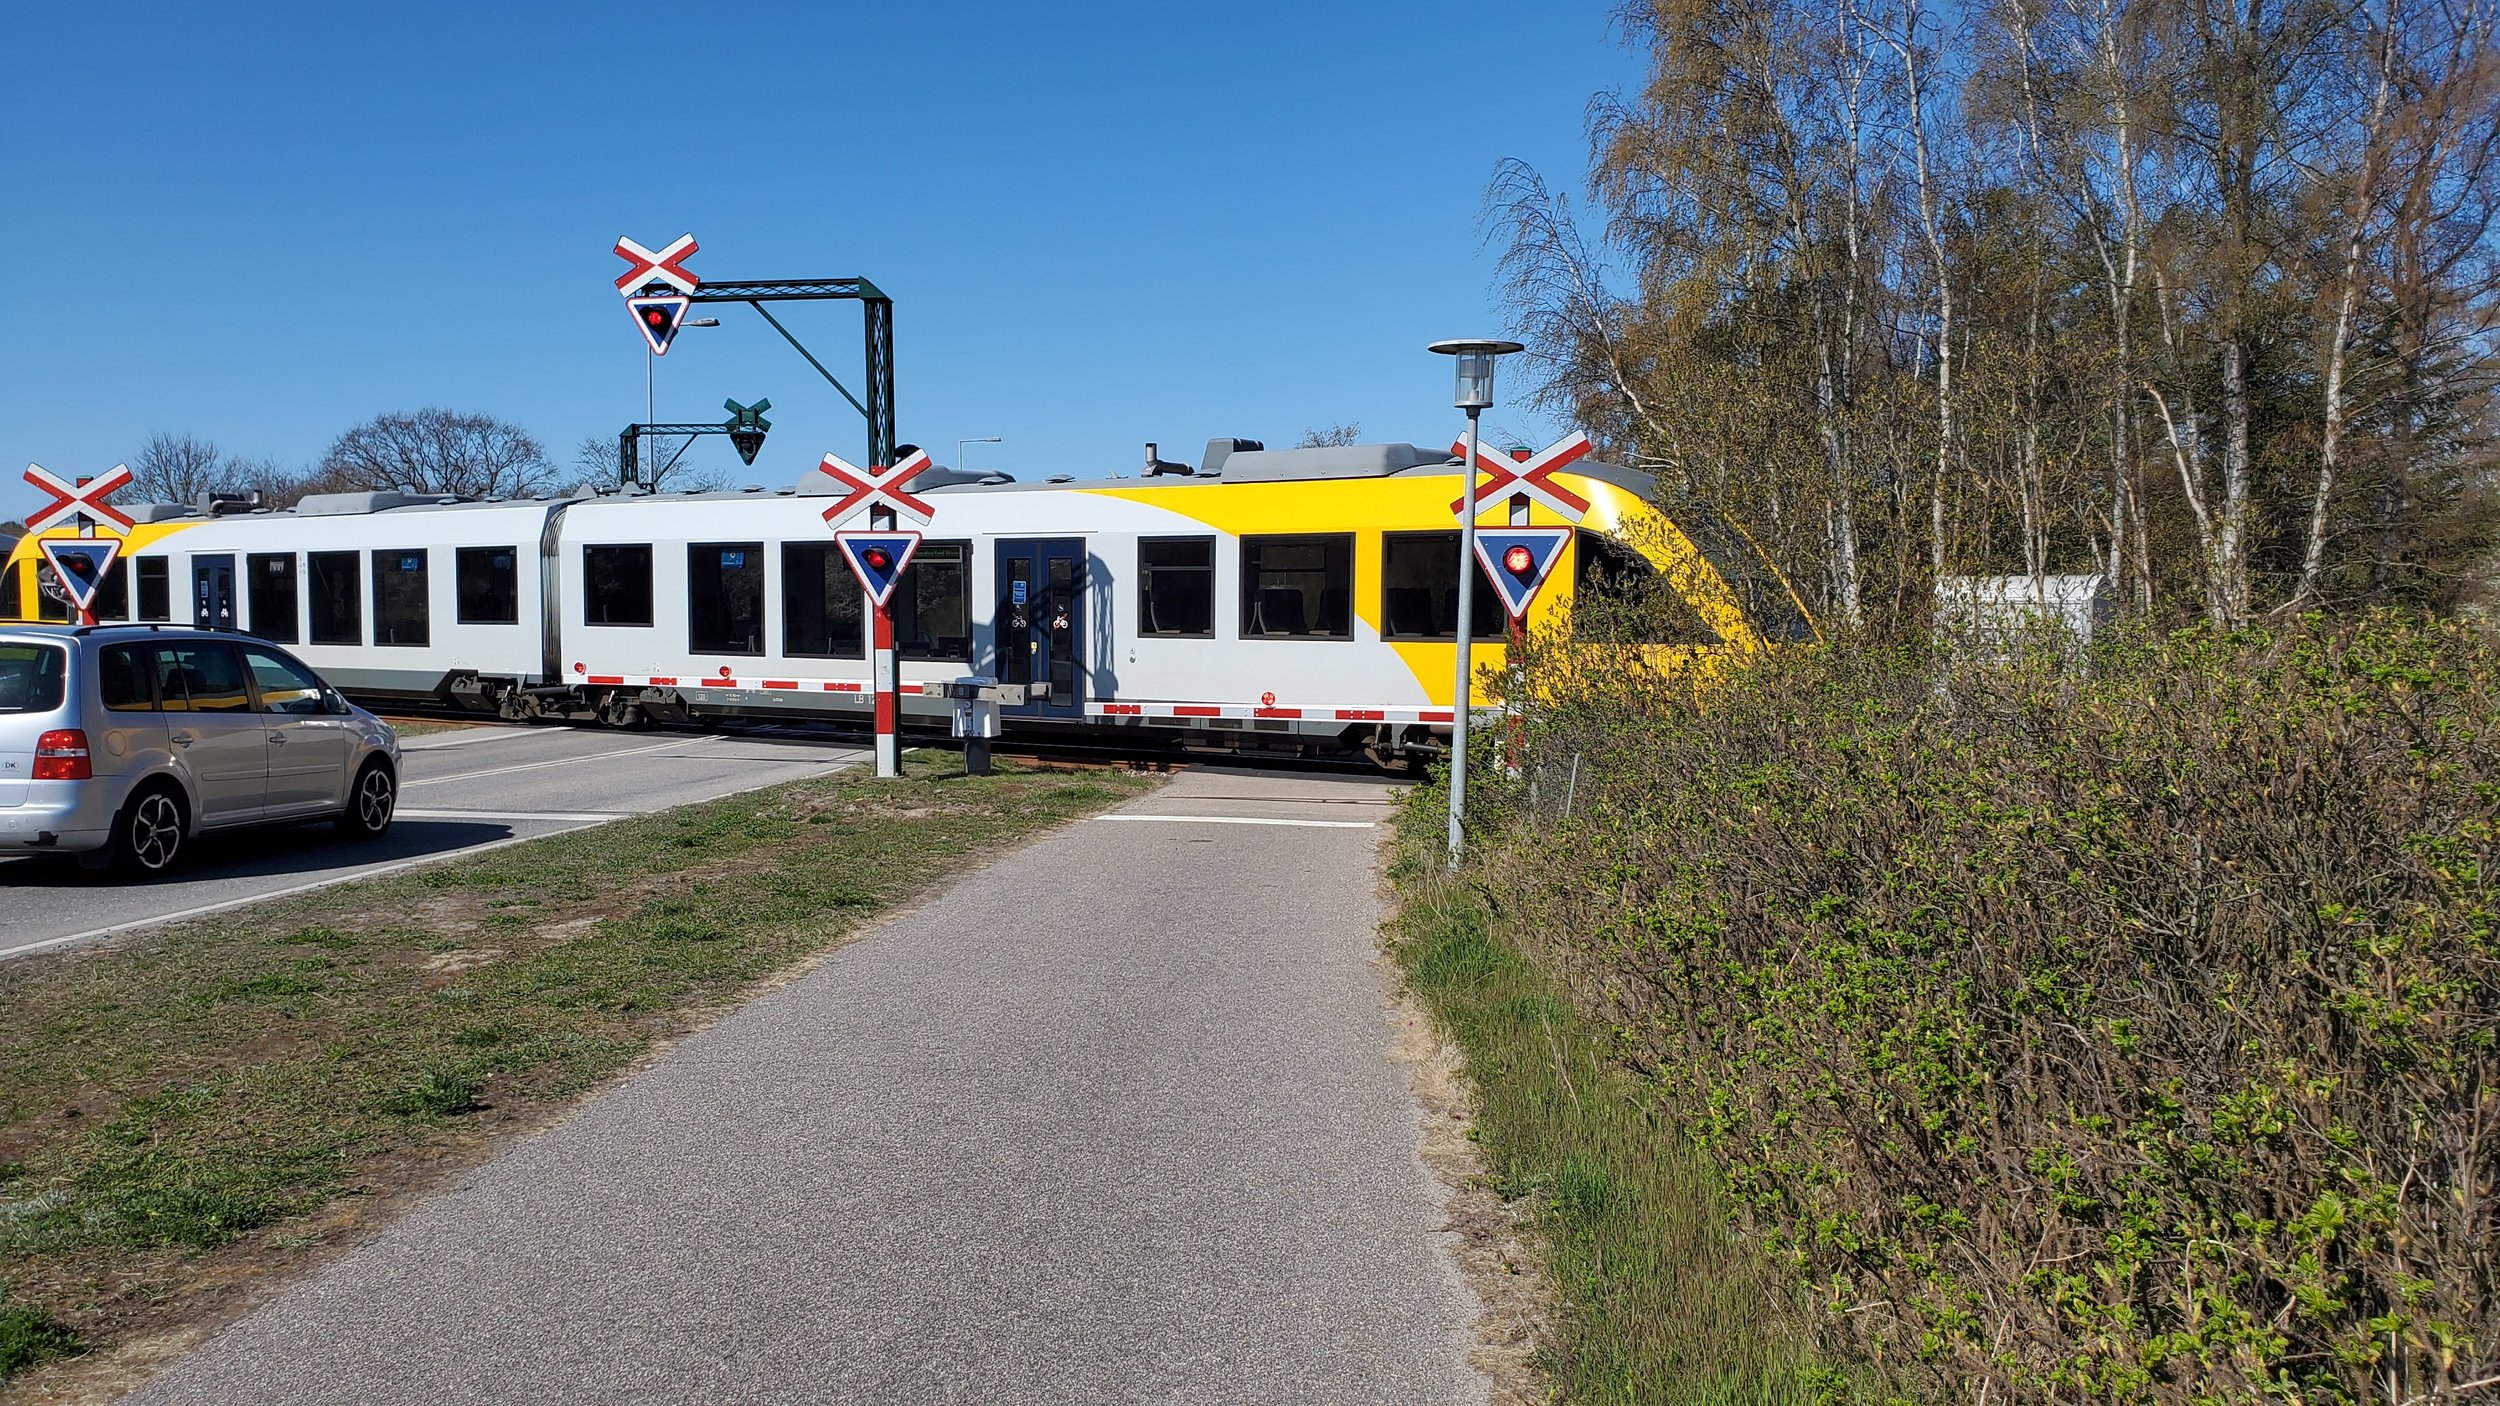
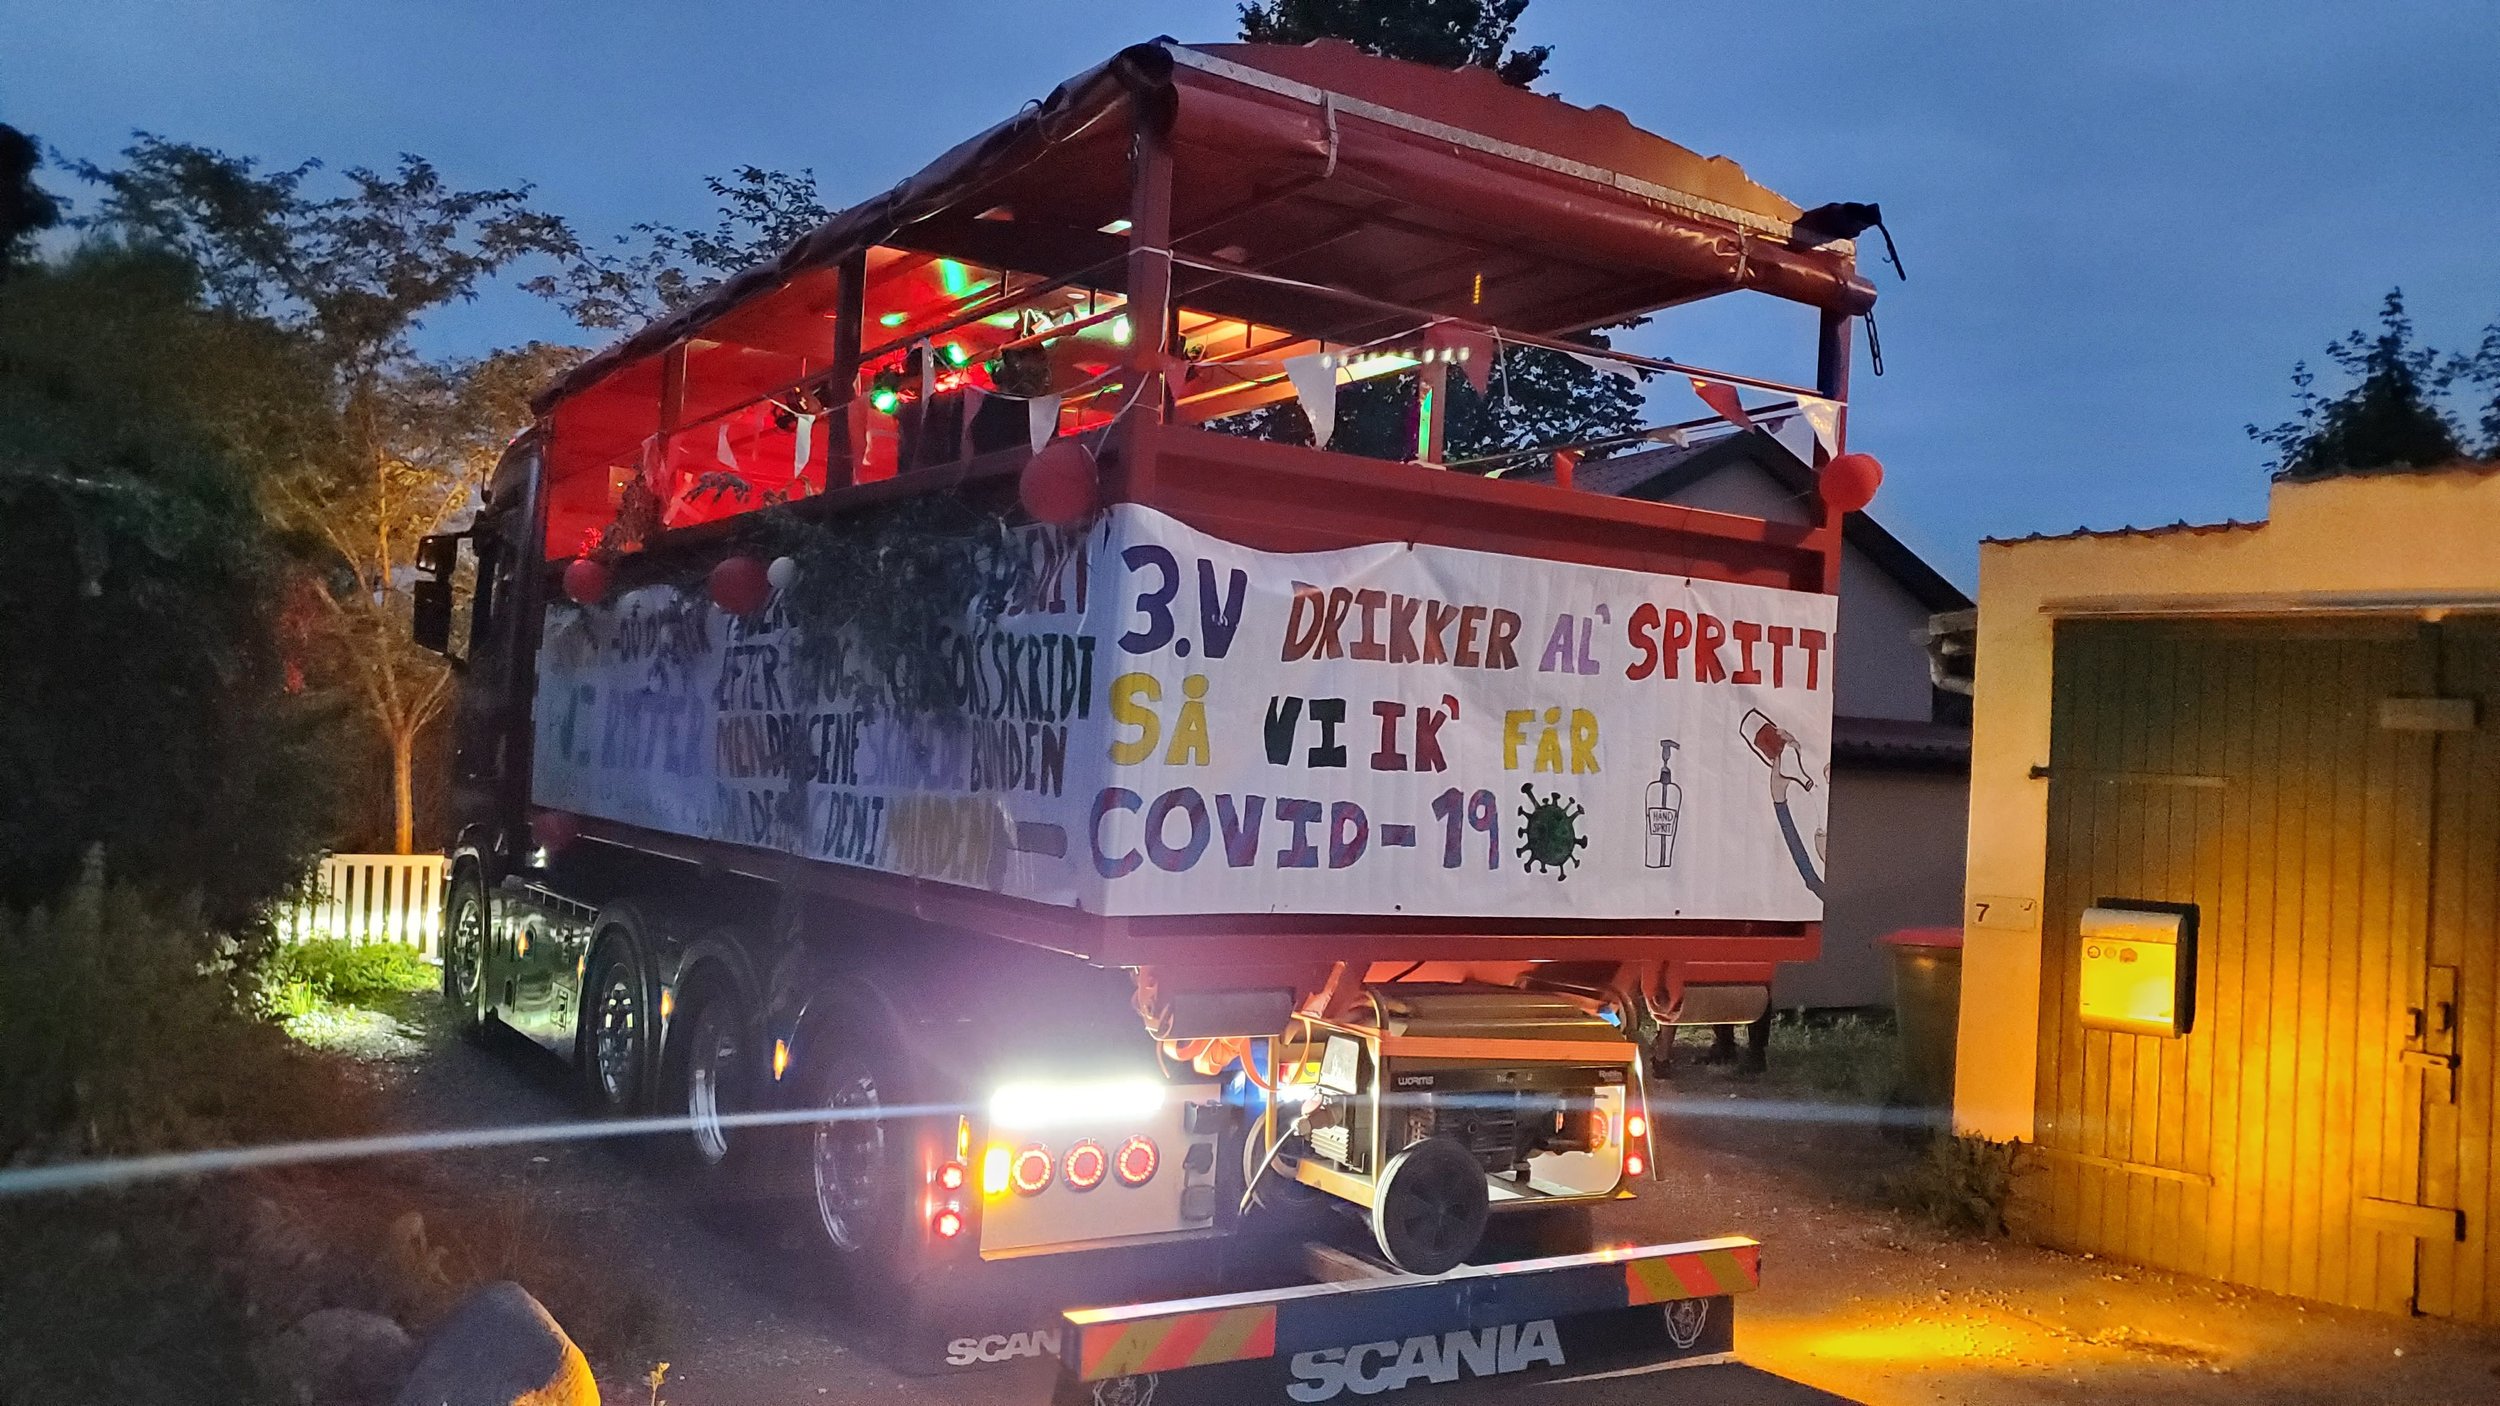
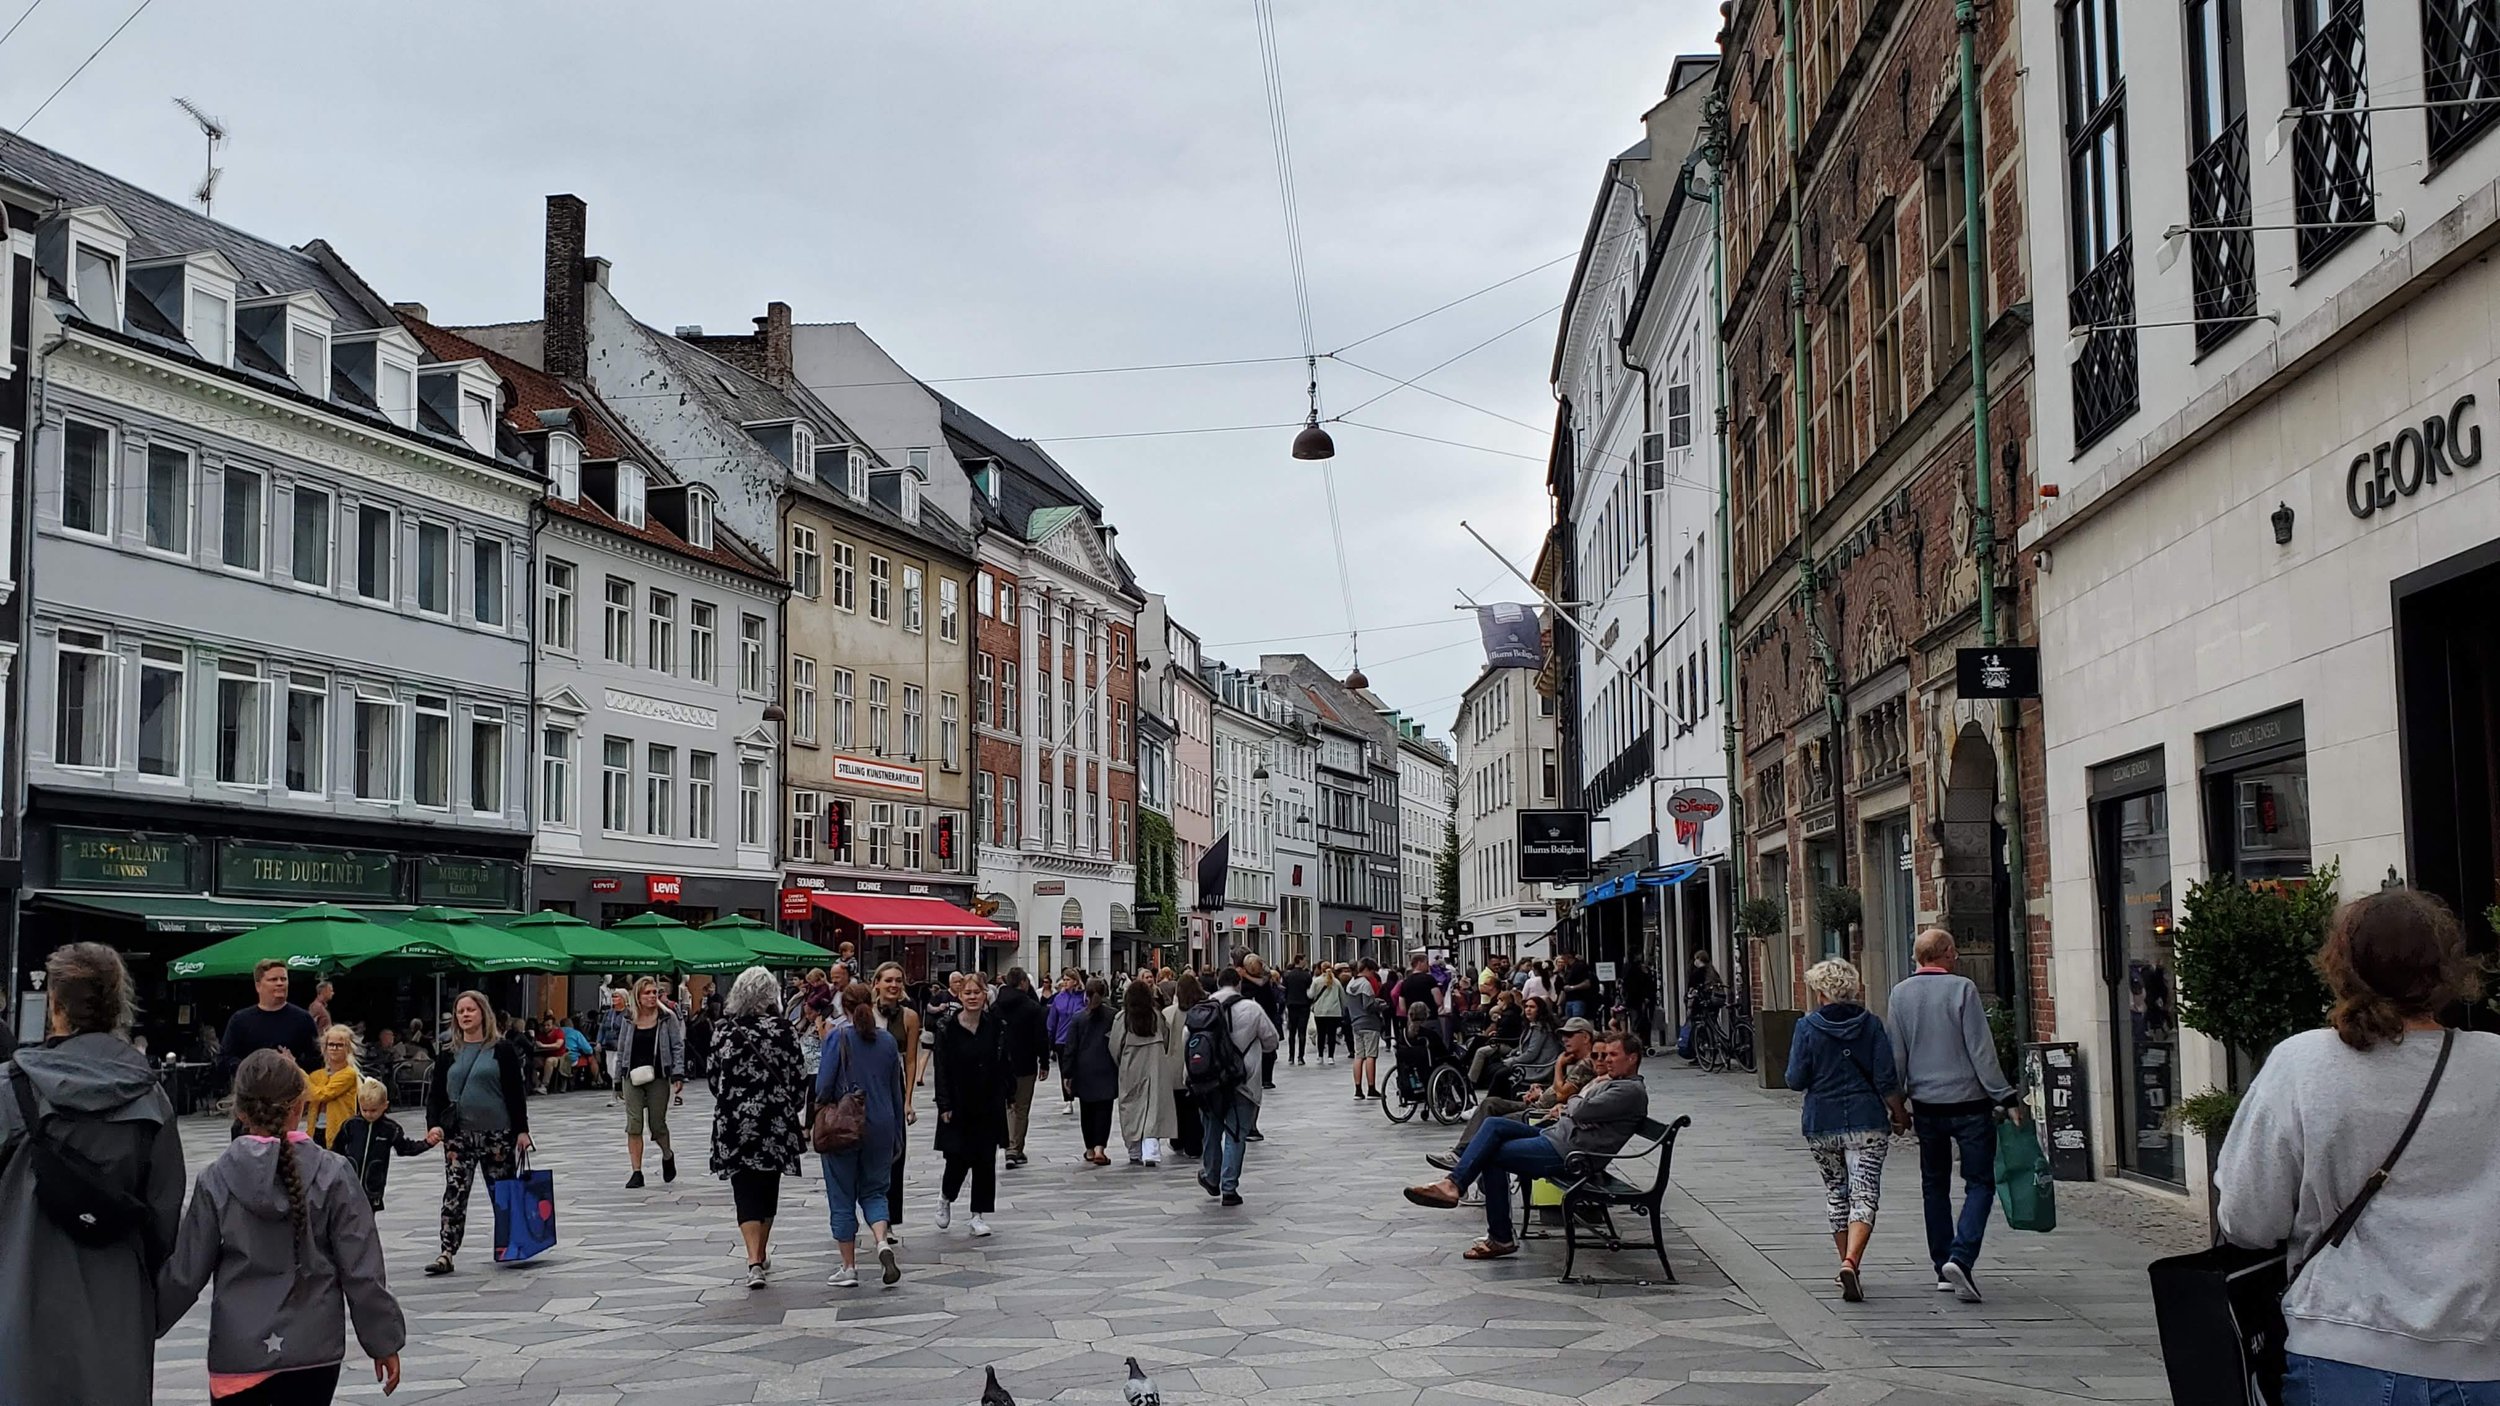
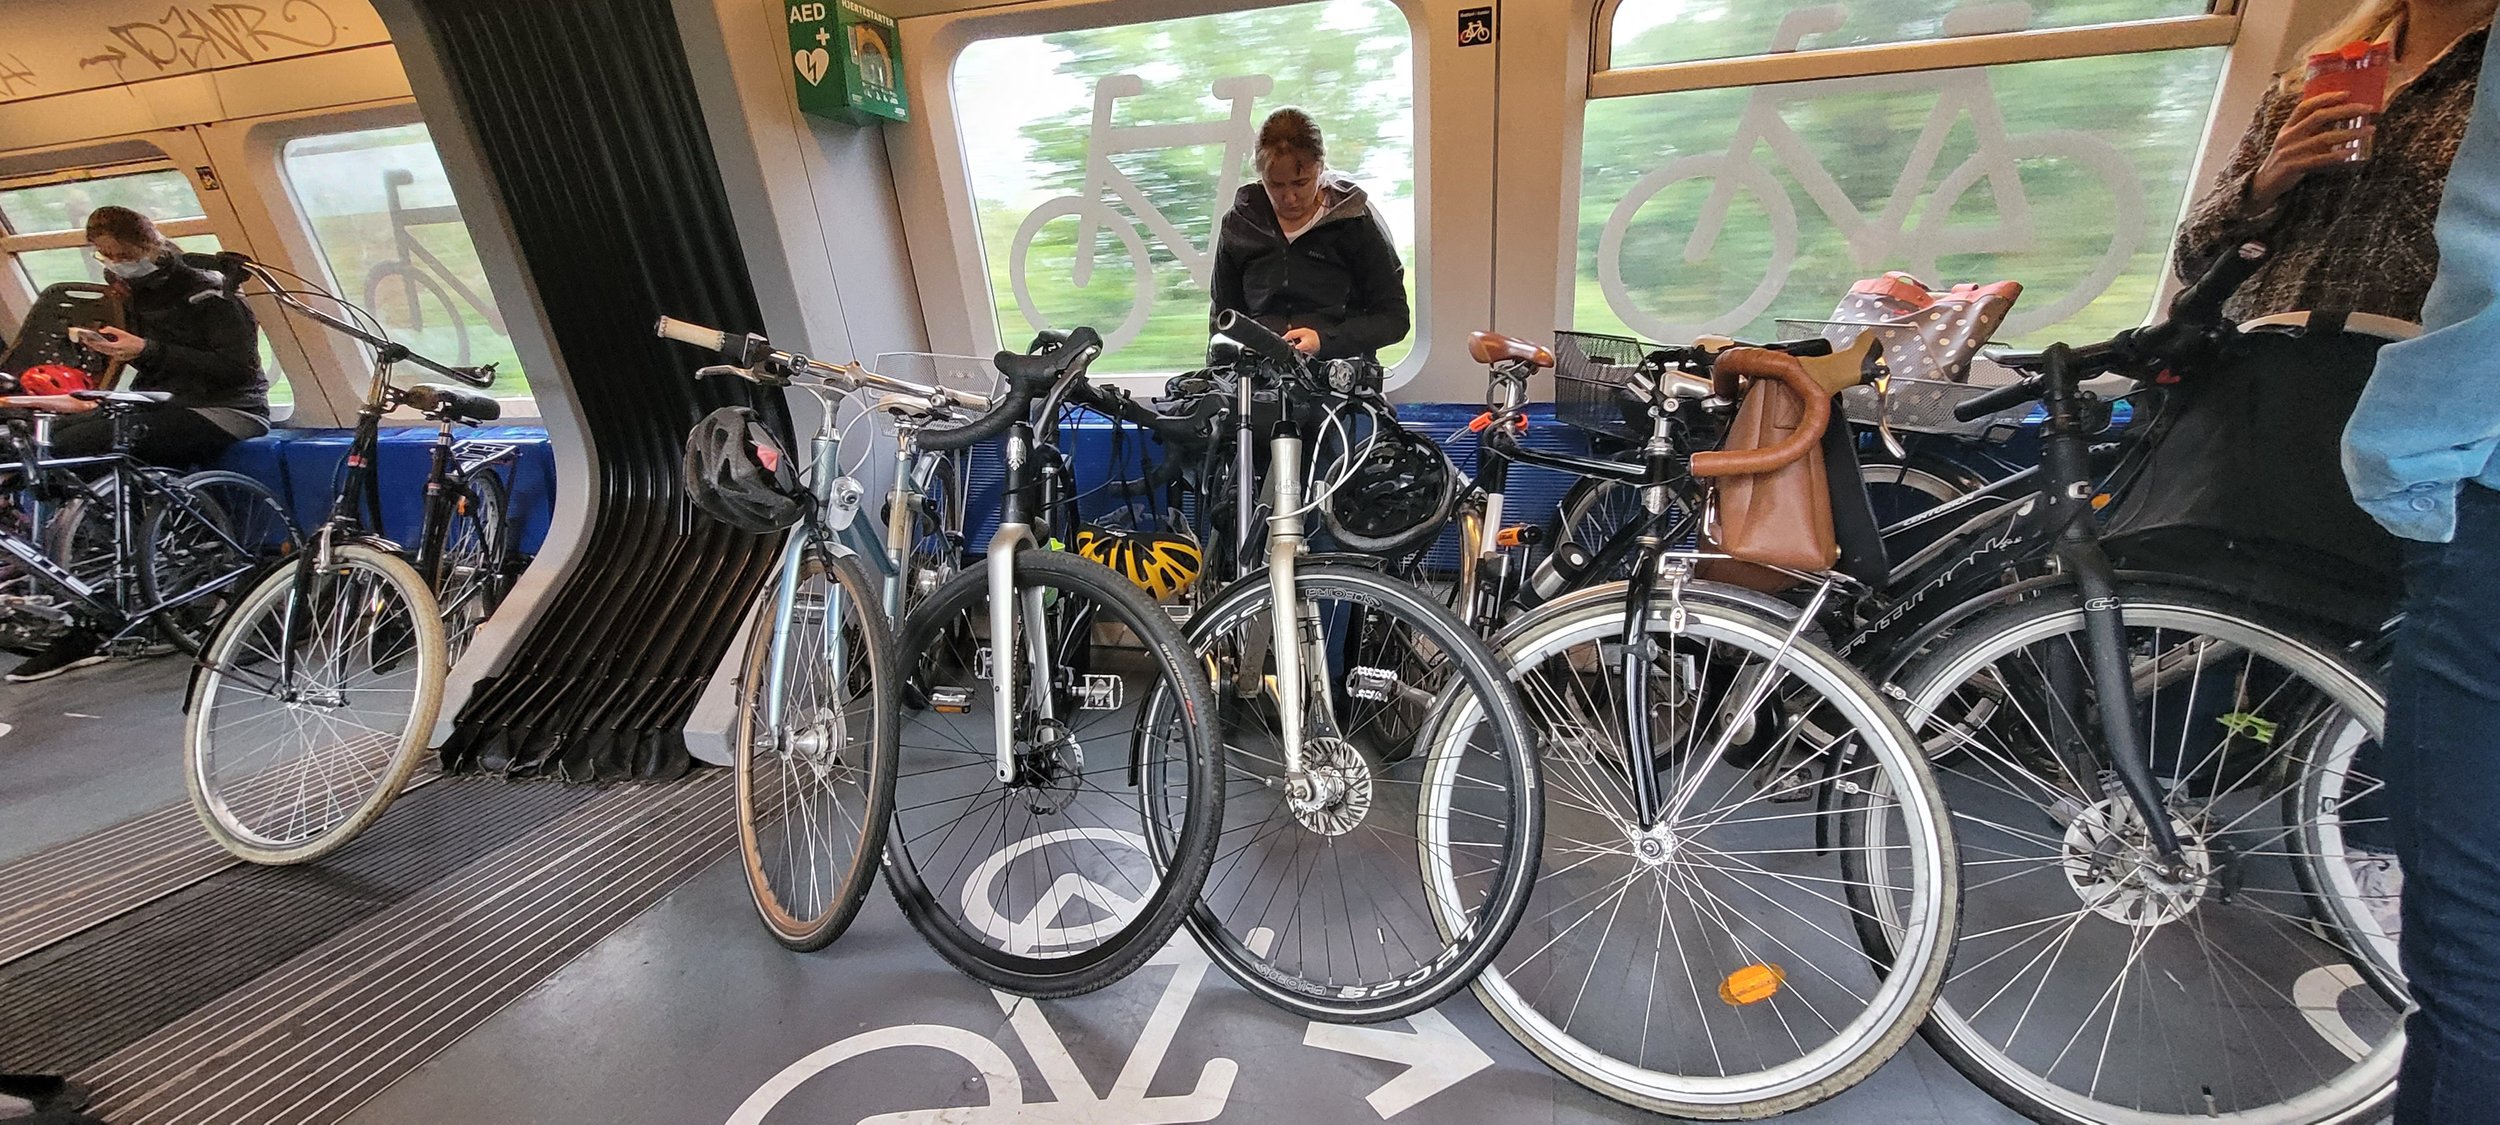
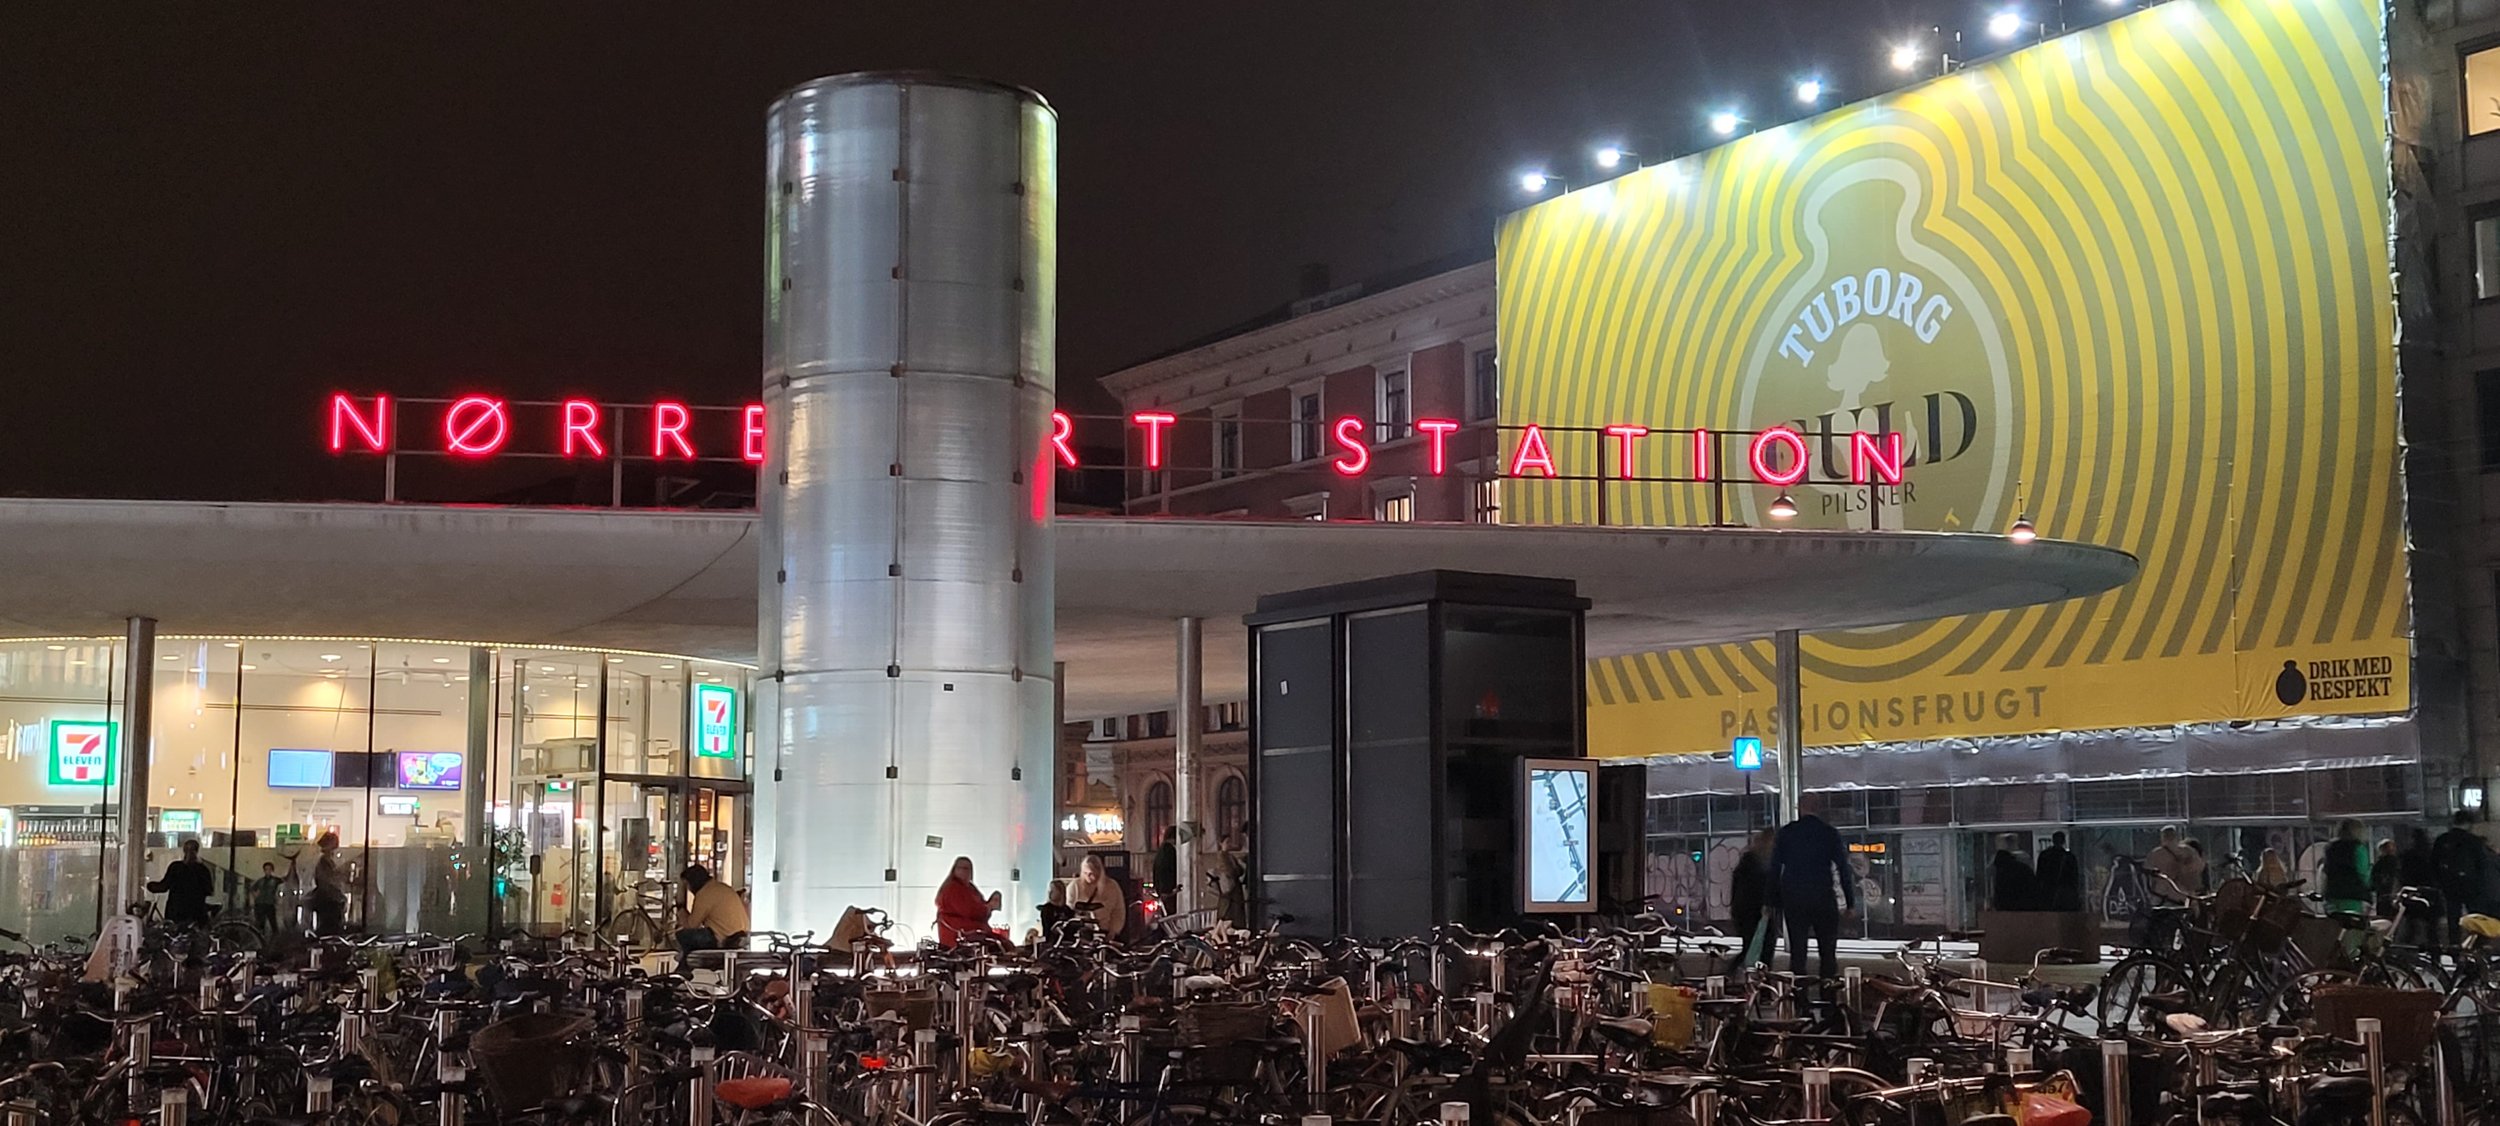
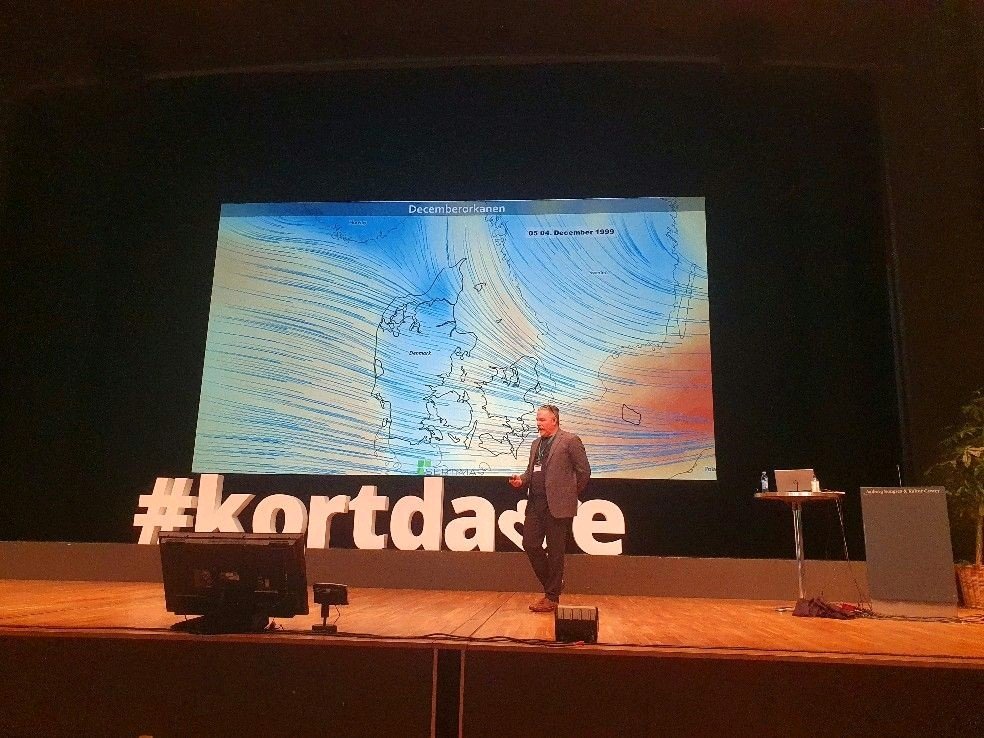
It has been a whirlwind of a year but we are more settled than we have been in quite awhile.The topic of discussion this morning is whether to meet some new Danish friends for dinner tonight - with the now typical concerns around COVID safety. Here the vaccination rate is high (77%) and testing is quick, easy and free. We can just walk down the street and get tested anytime we want. This fall, we were lucky enough to experience a 3 month period when all COVID restrictions were lifted. Kurt regularly took the train into Copenhagen to go to the office and attended a multi-day in person conference. Sarah began seeing clients for the first time in a year and a half and travelled to Germany to assist an aquatic bodywork training. But now the Omicron variant is raging, and Denmark is seeing a record number of cases. On the plus side we got our Corona boosters yesterday. 

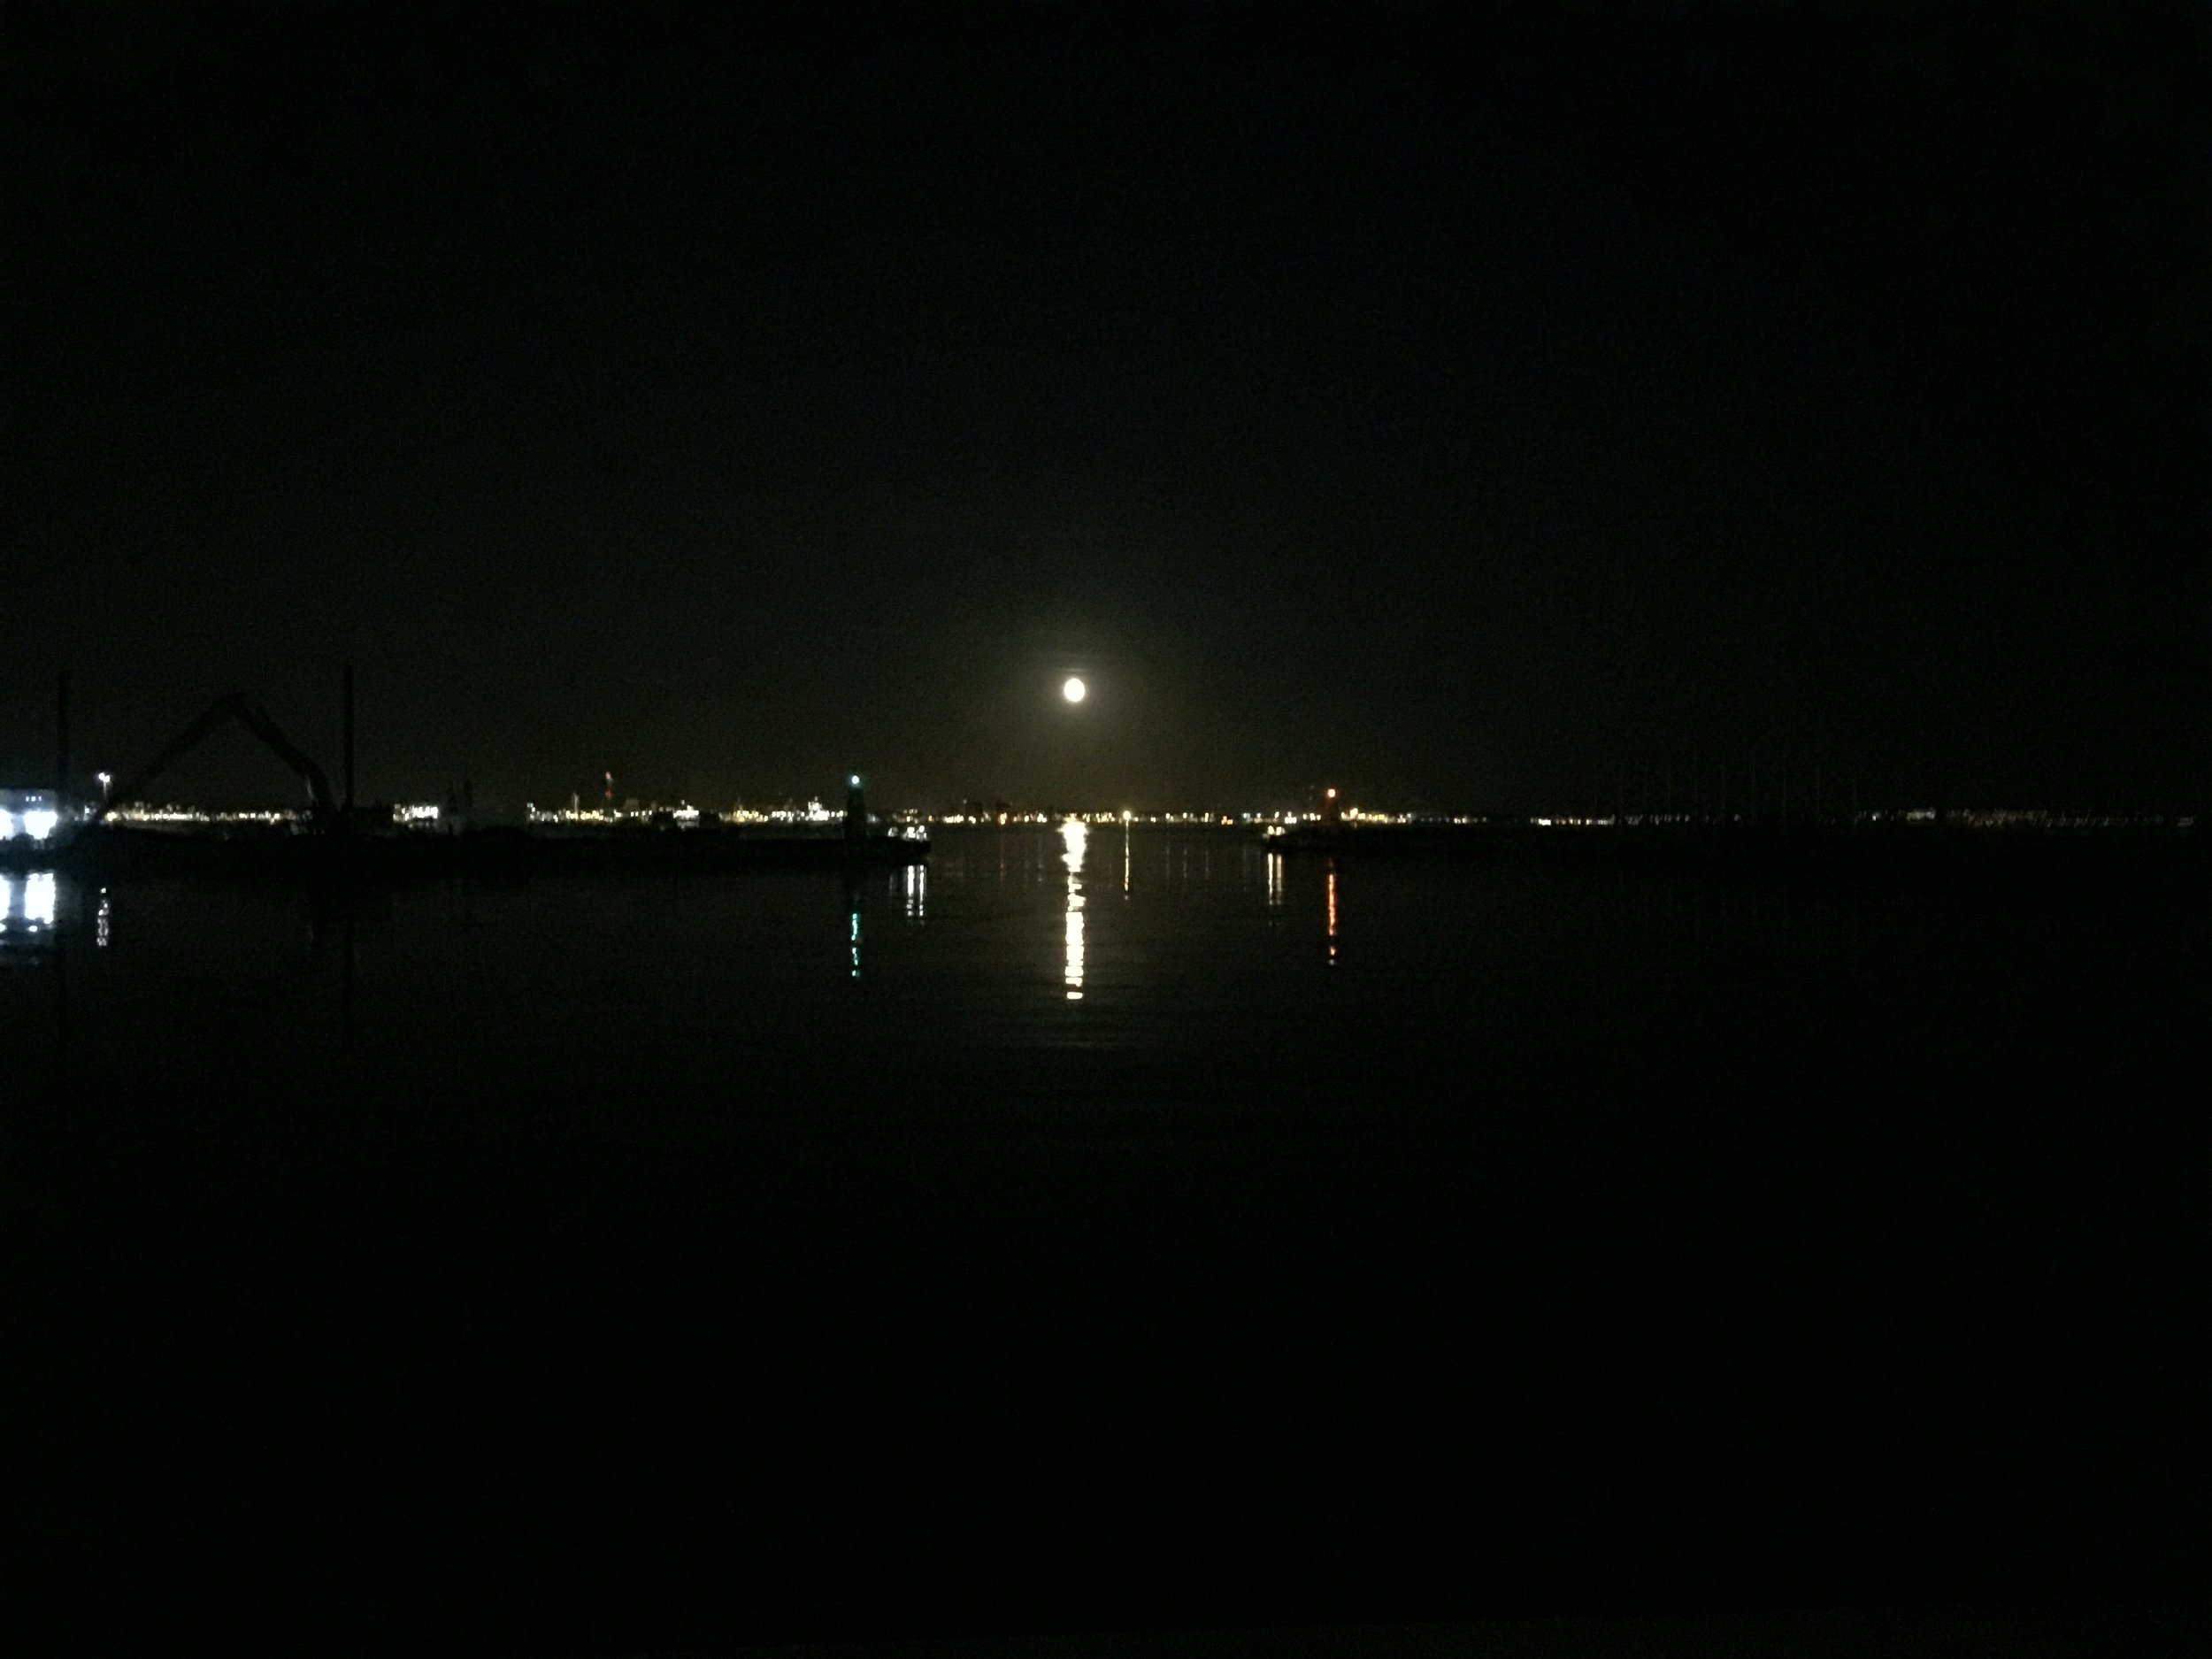
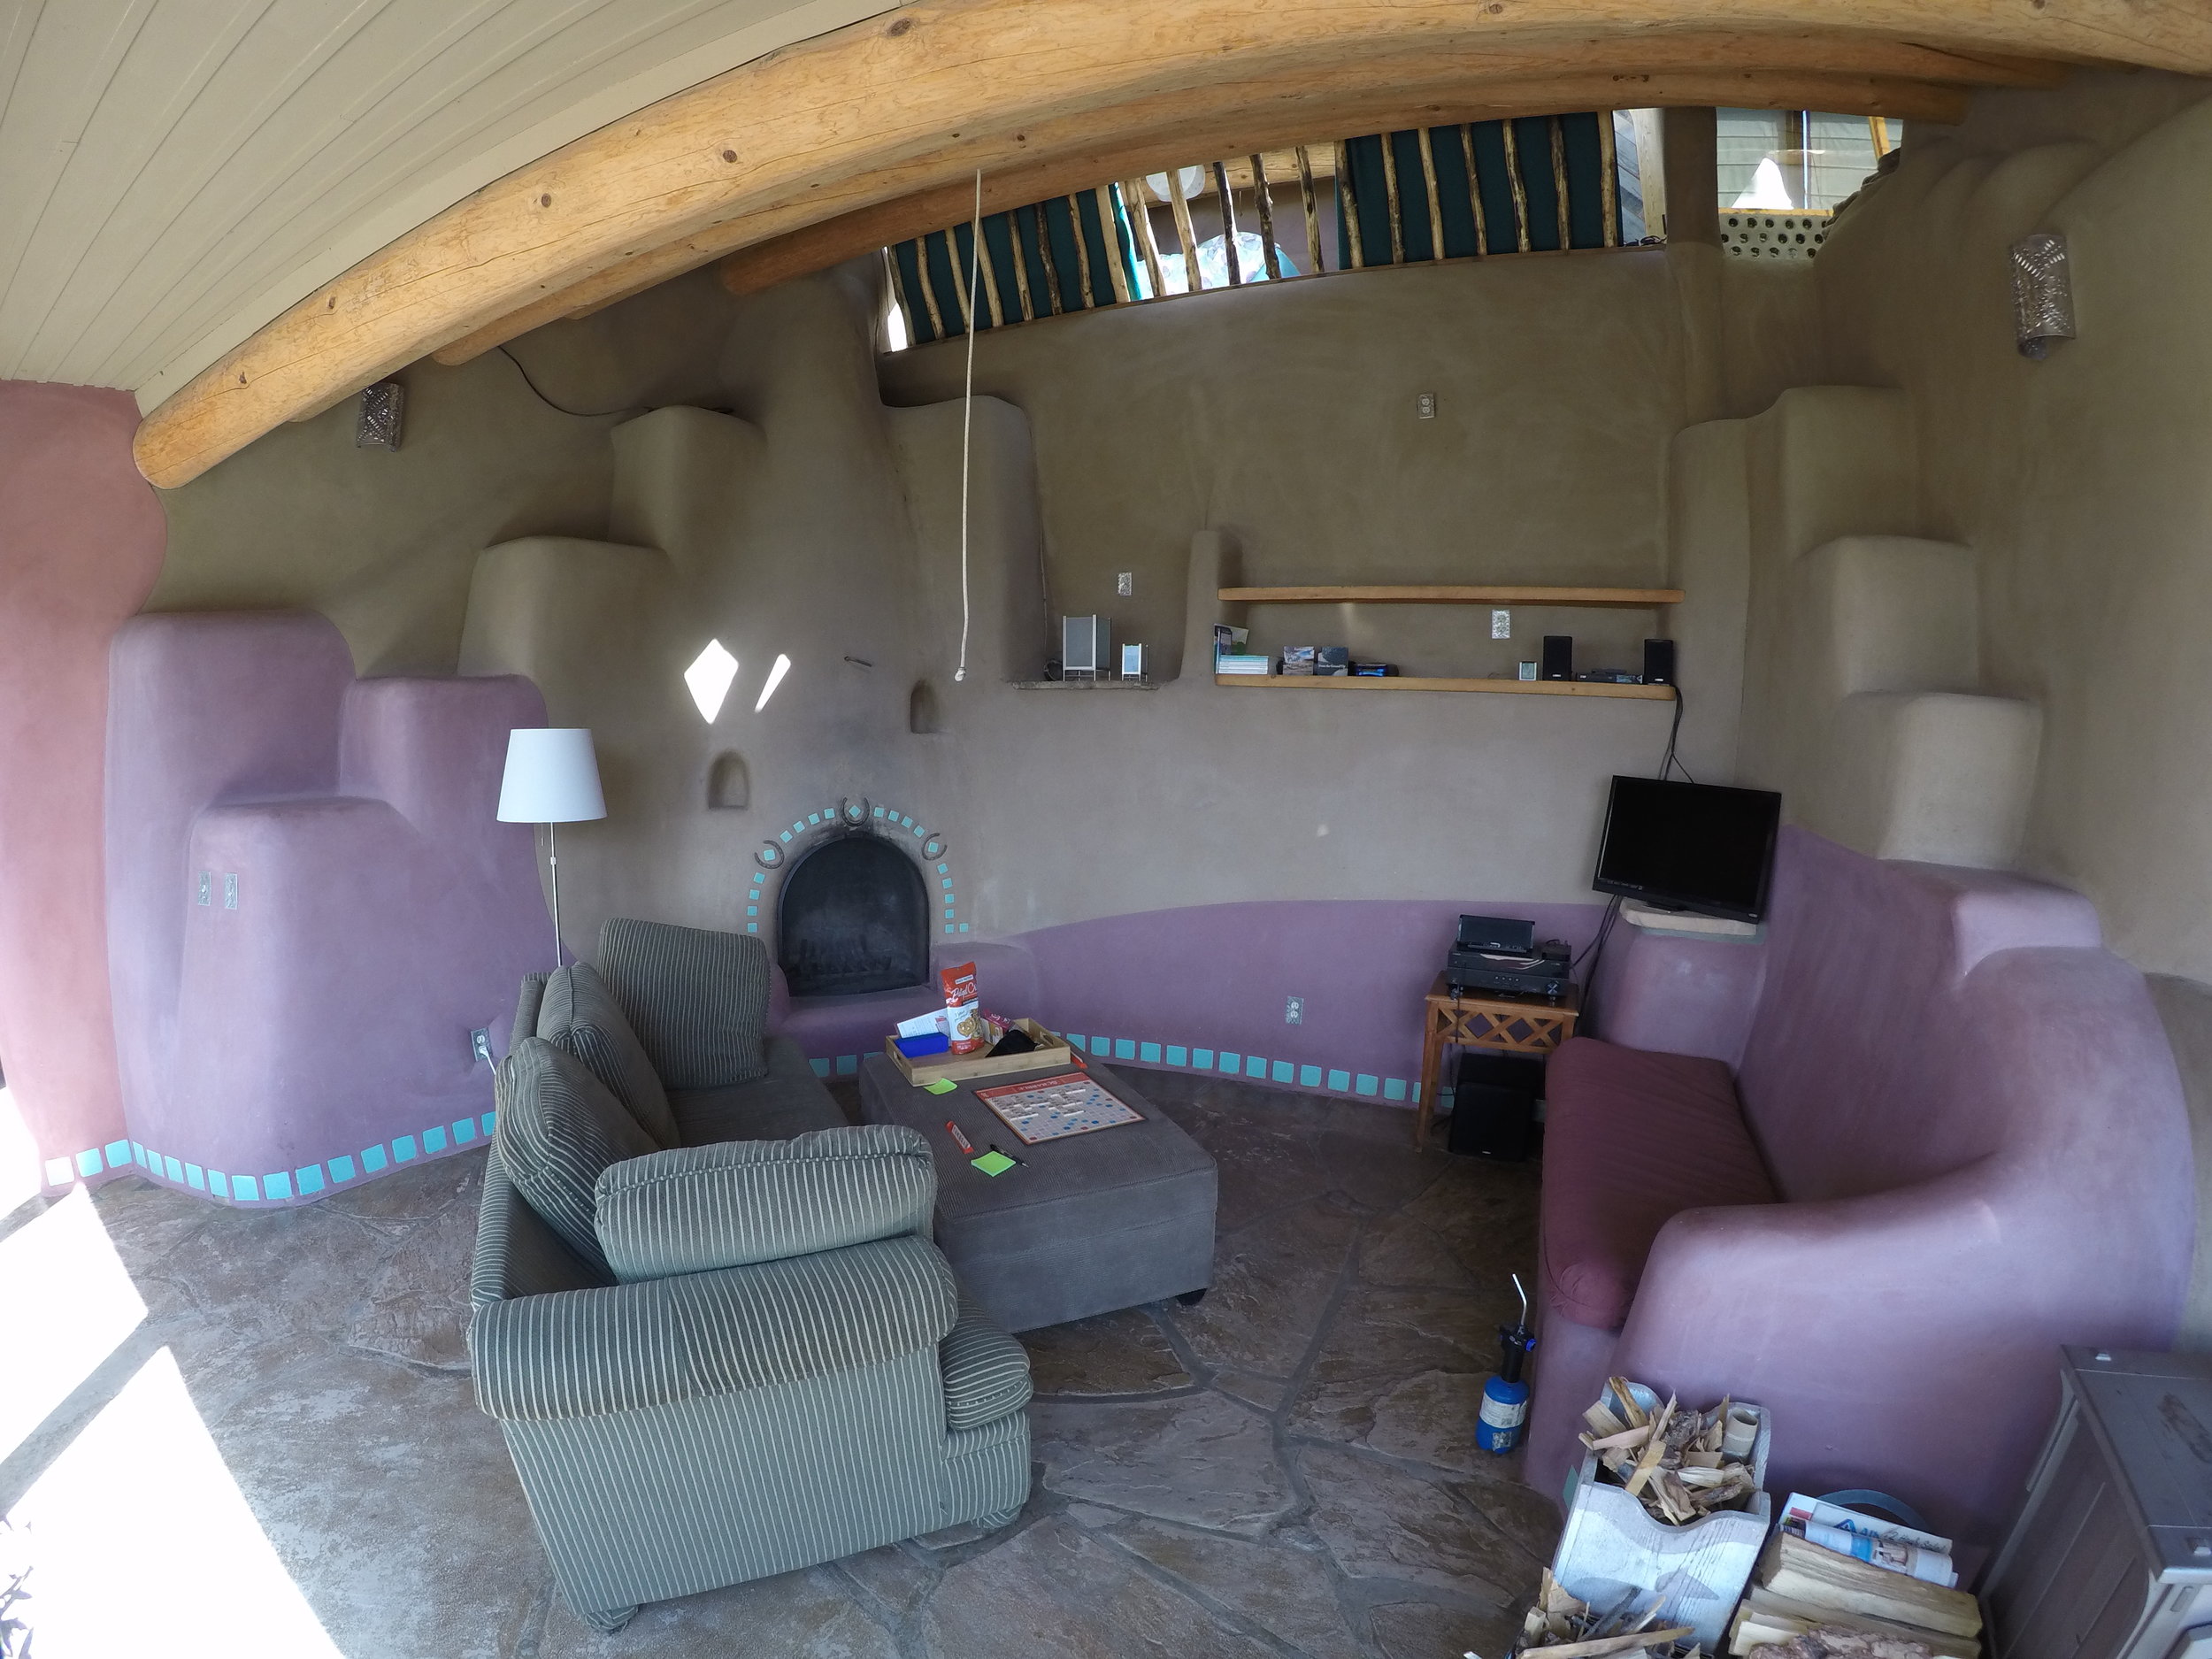
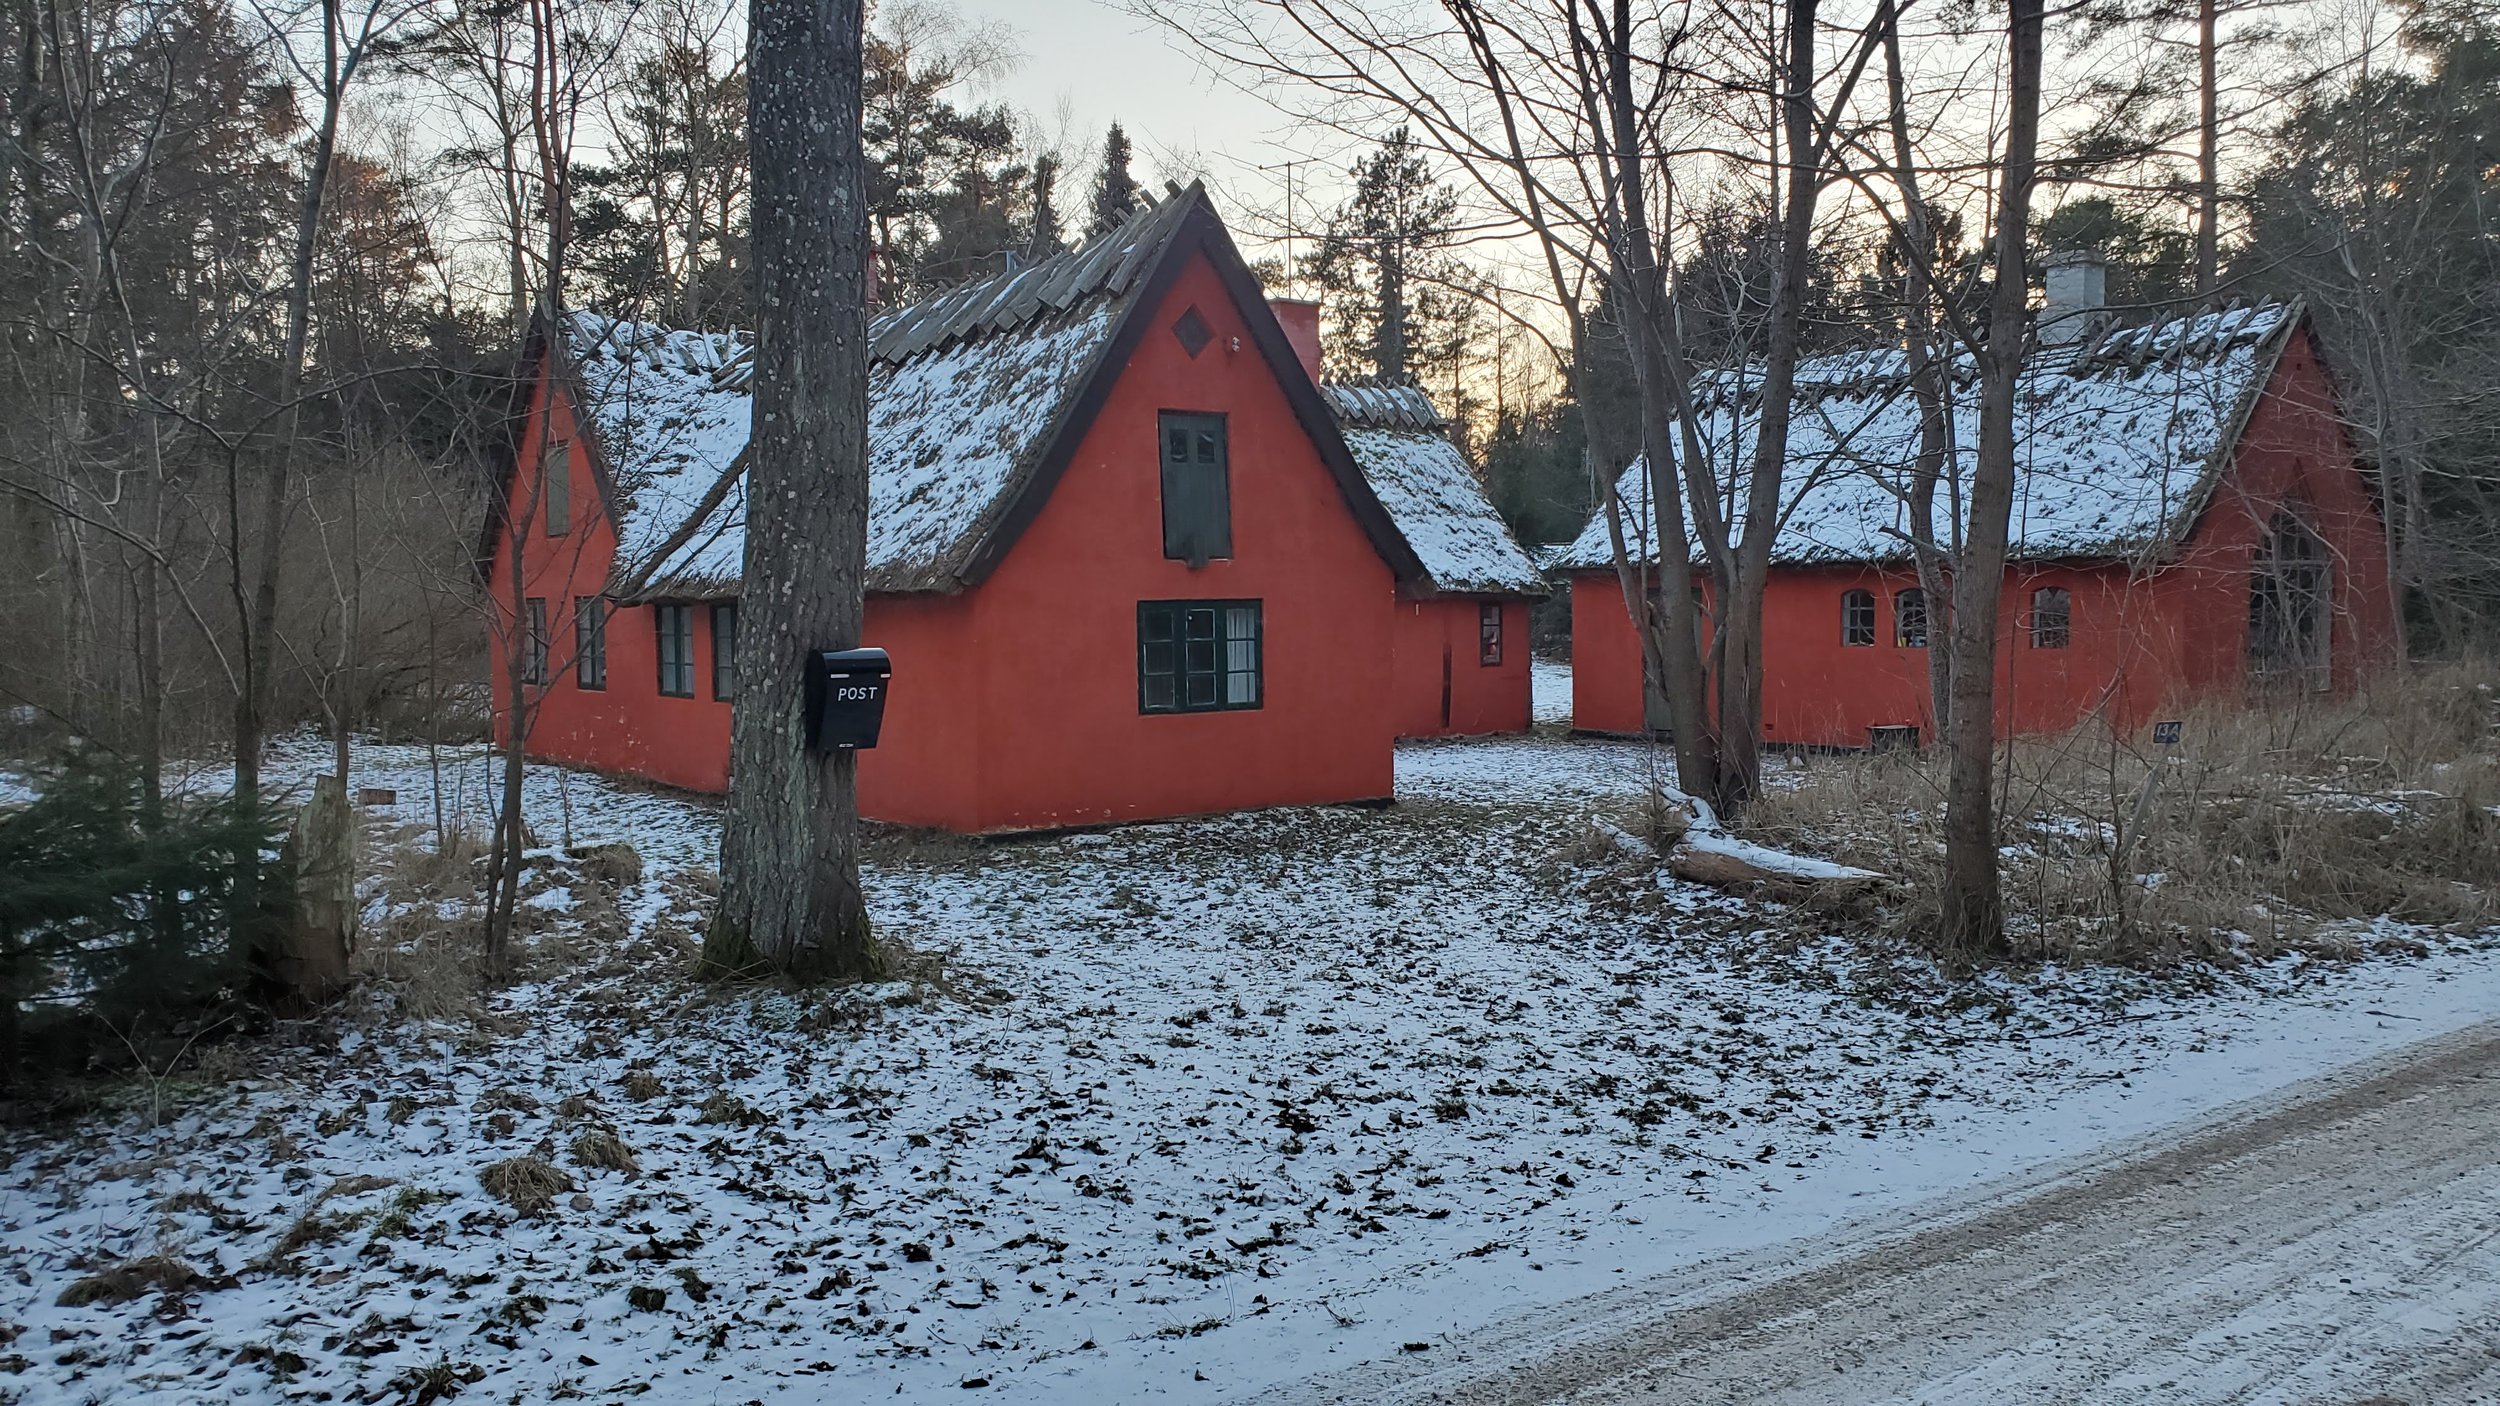
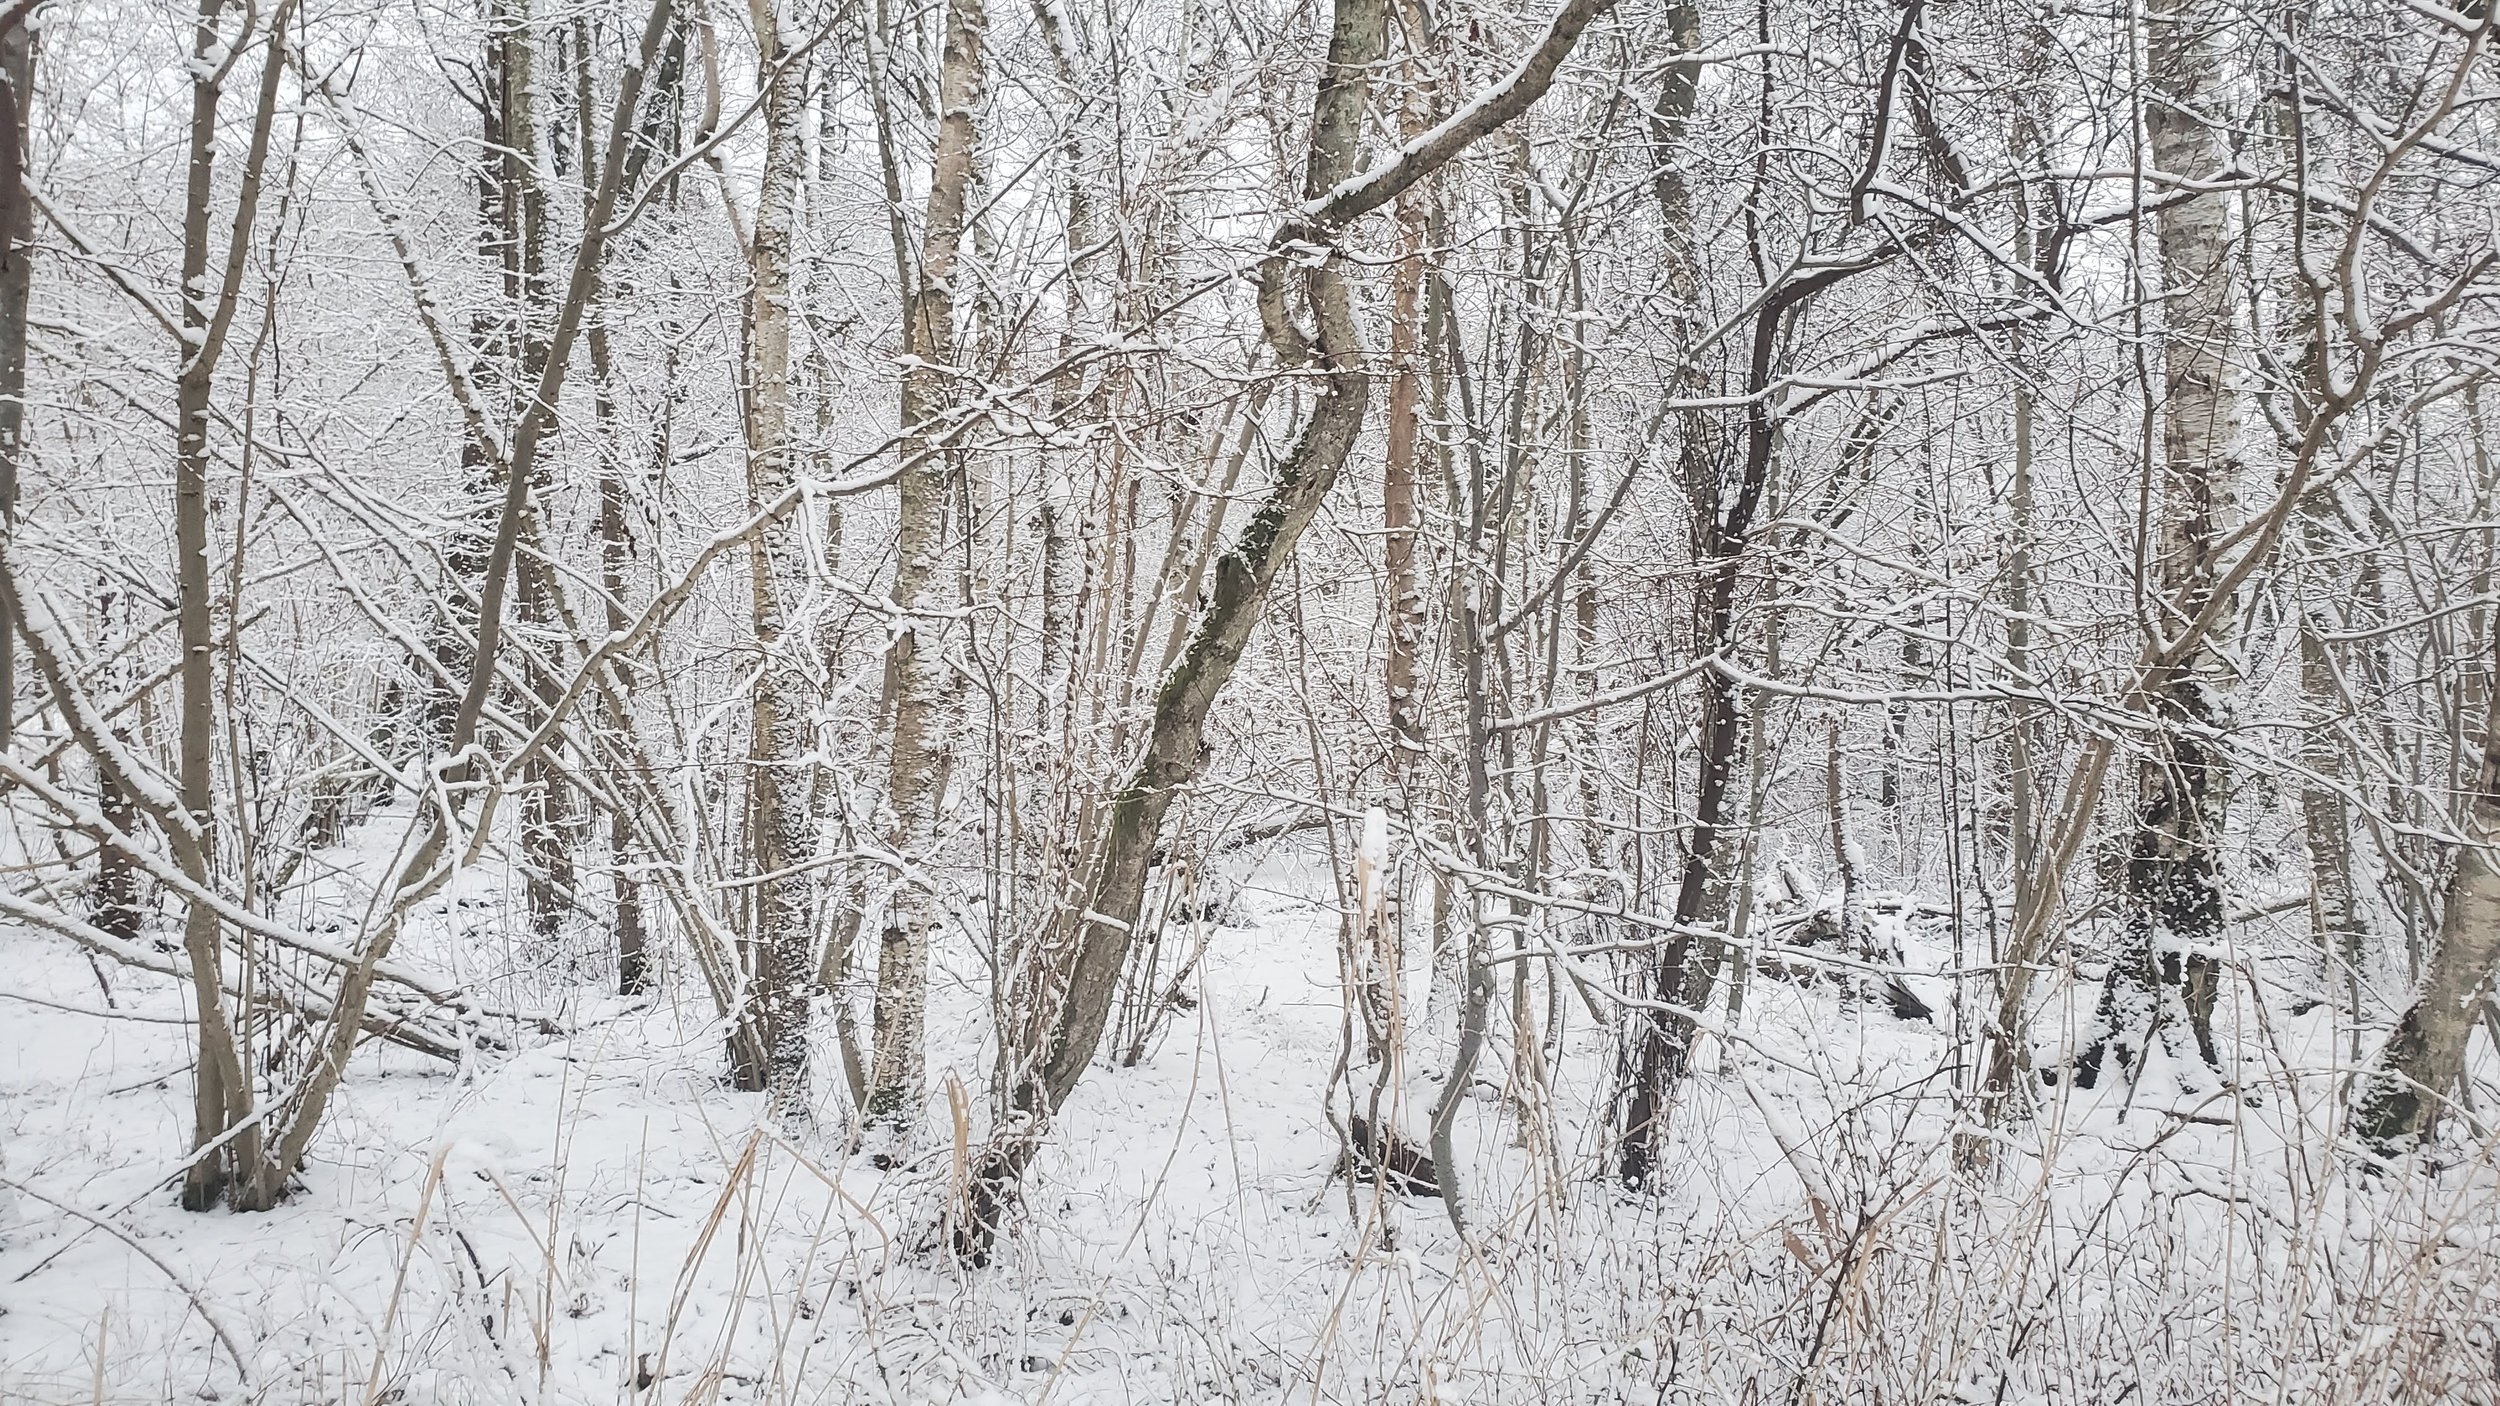
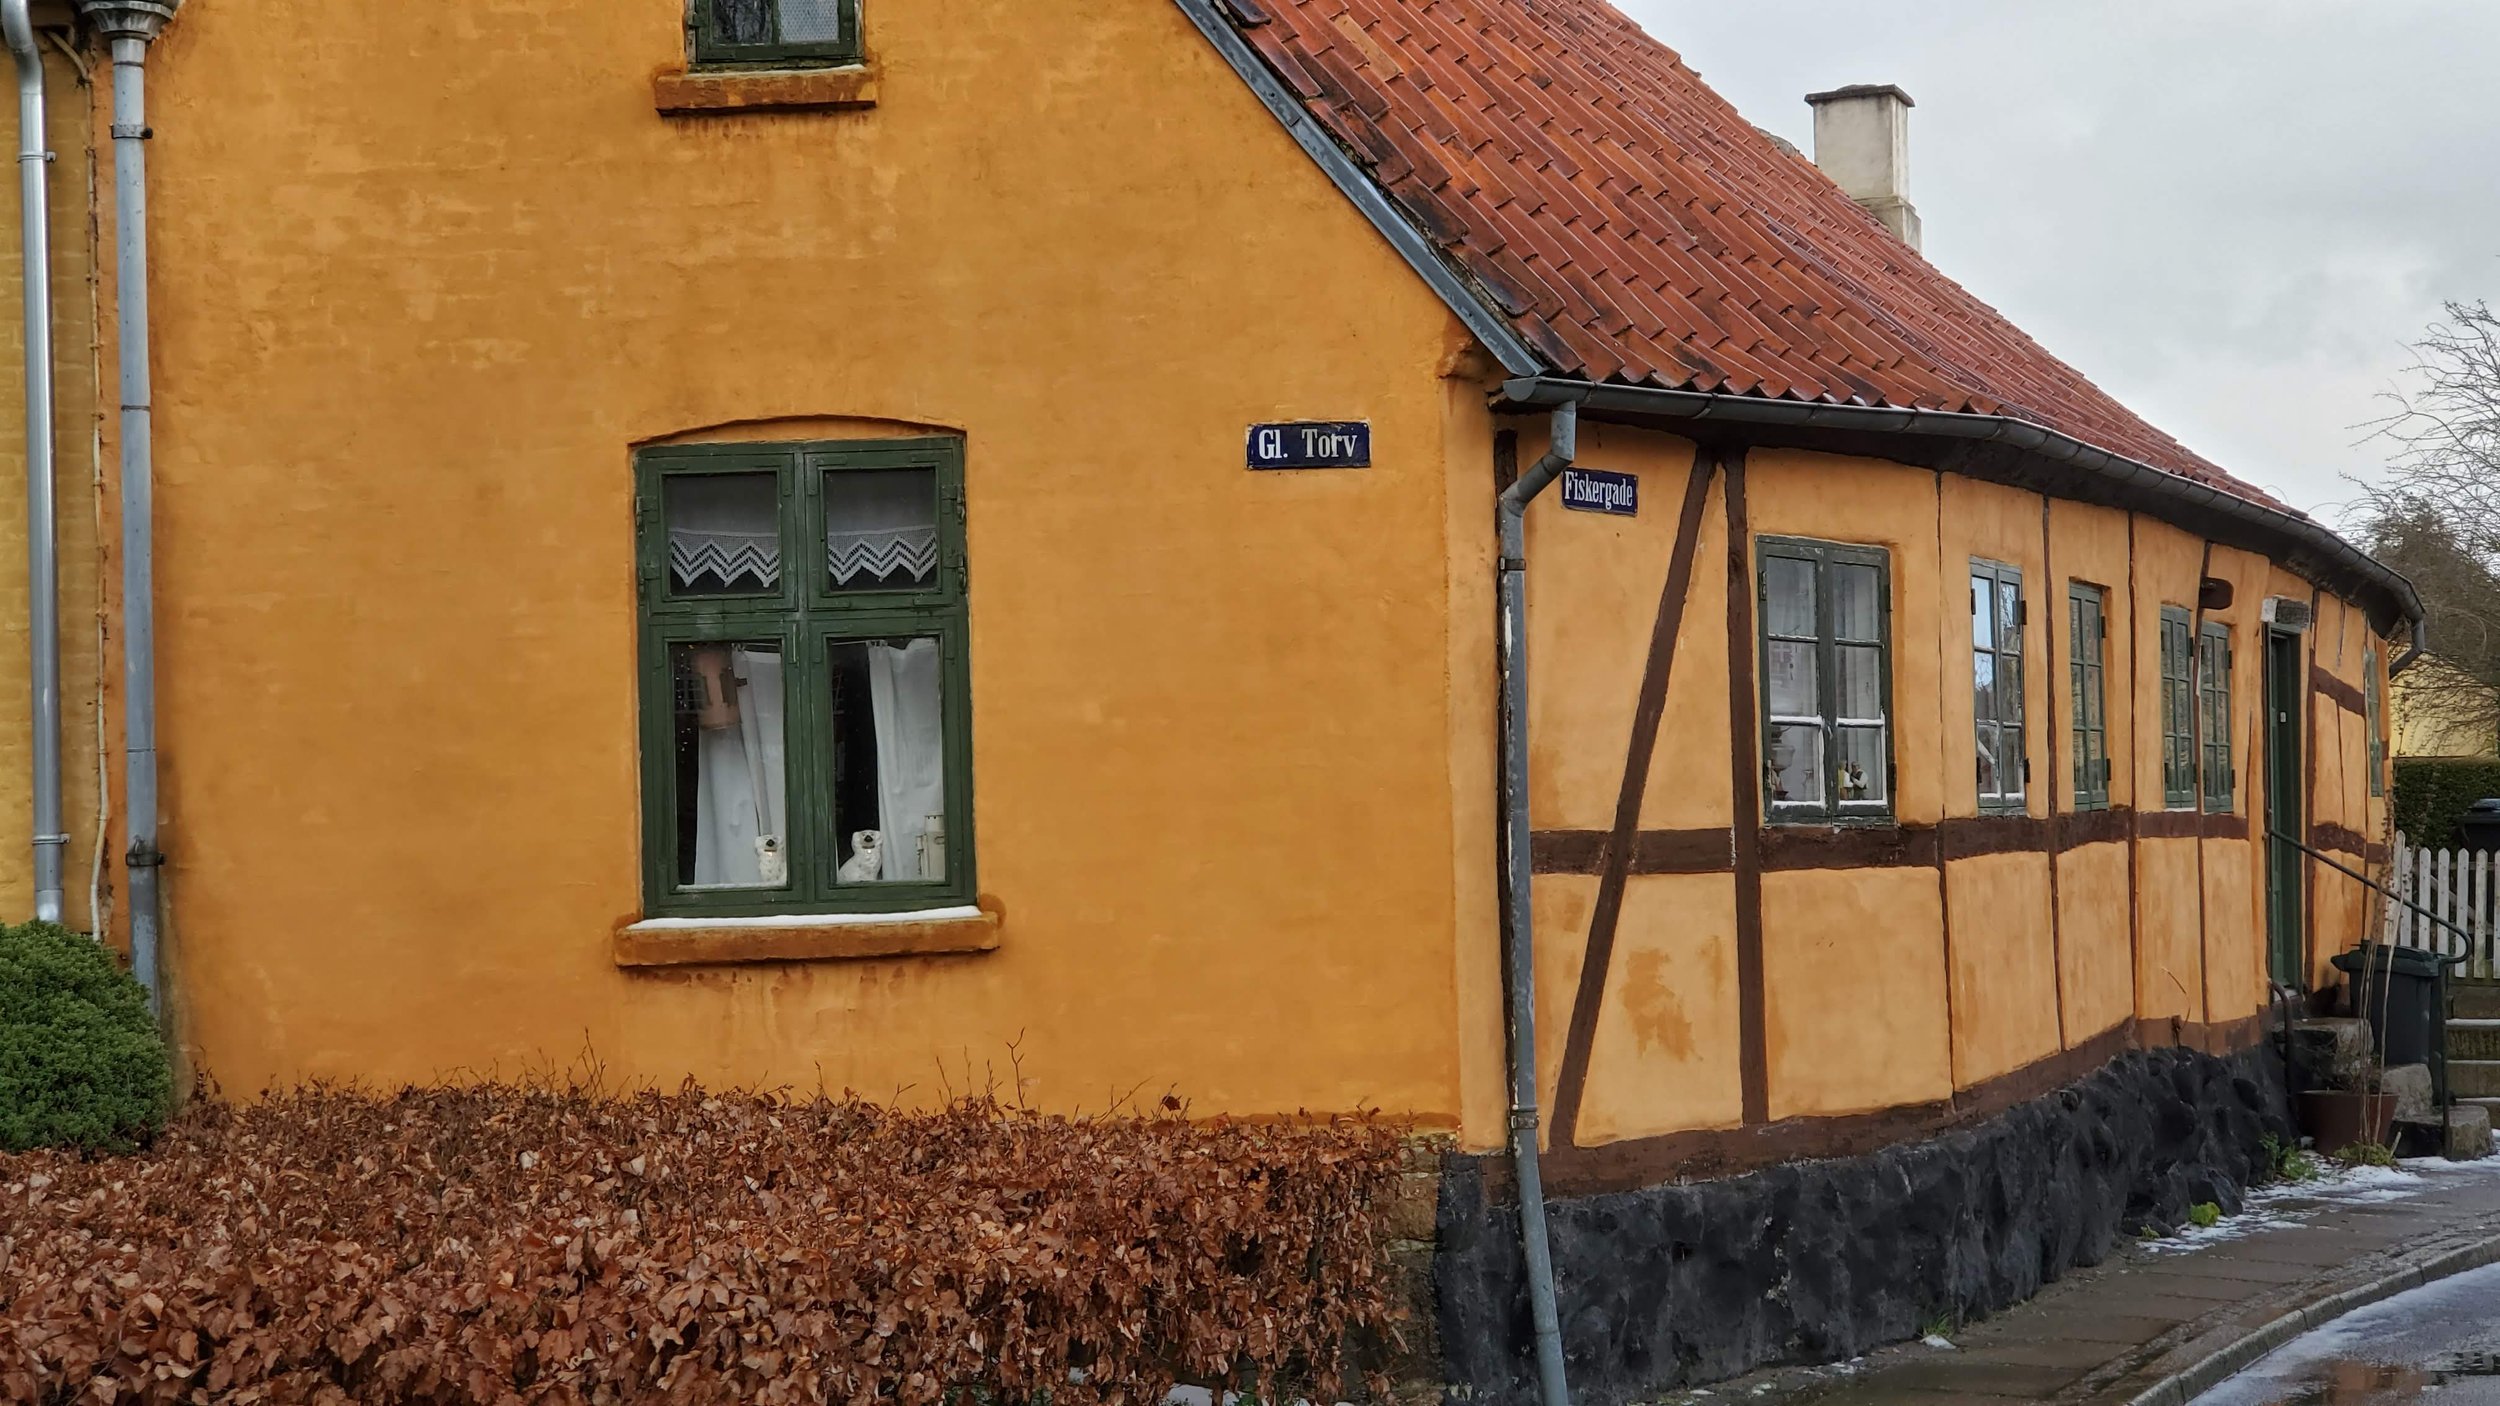
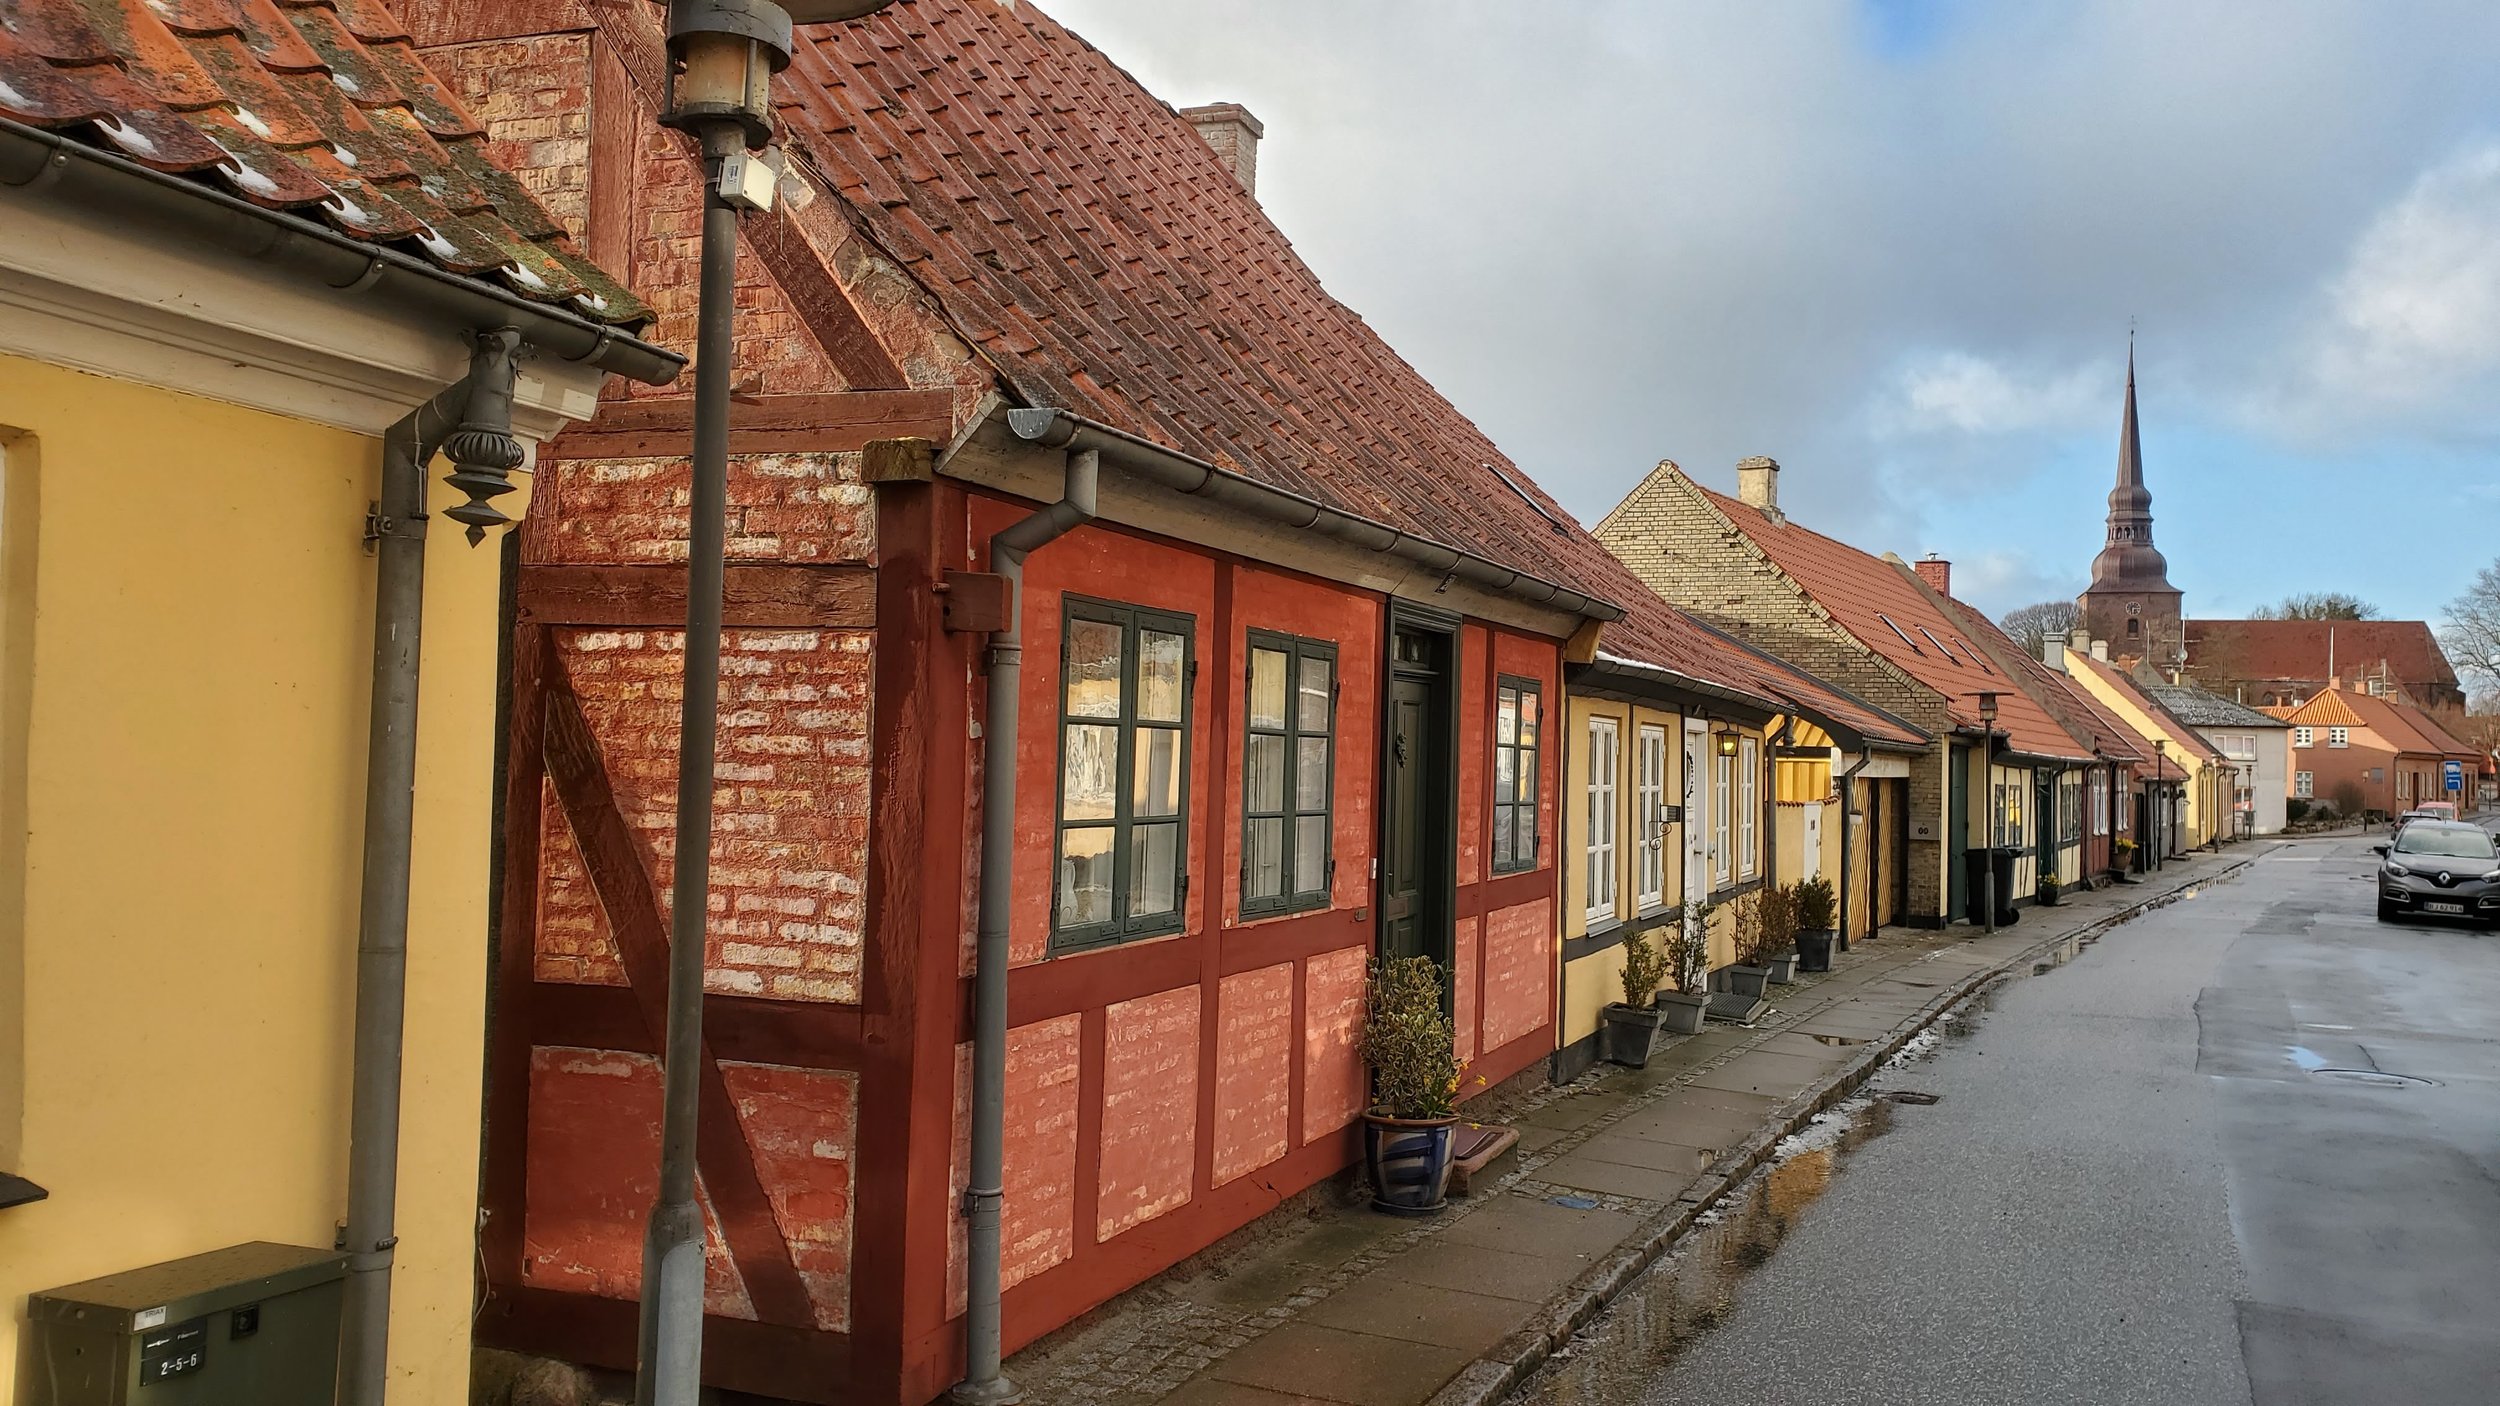
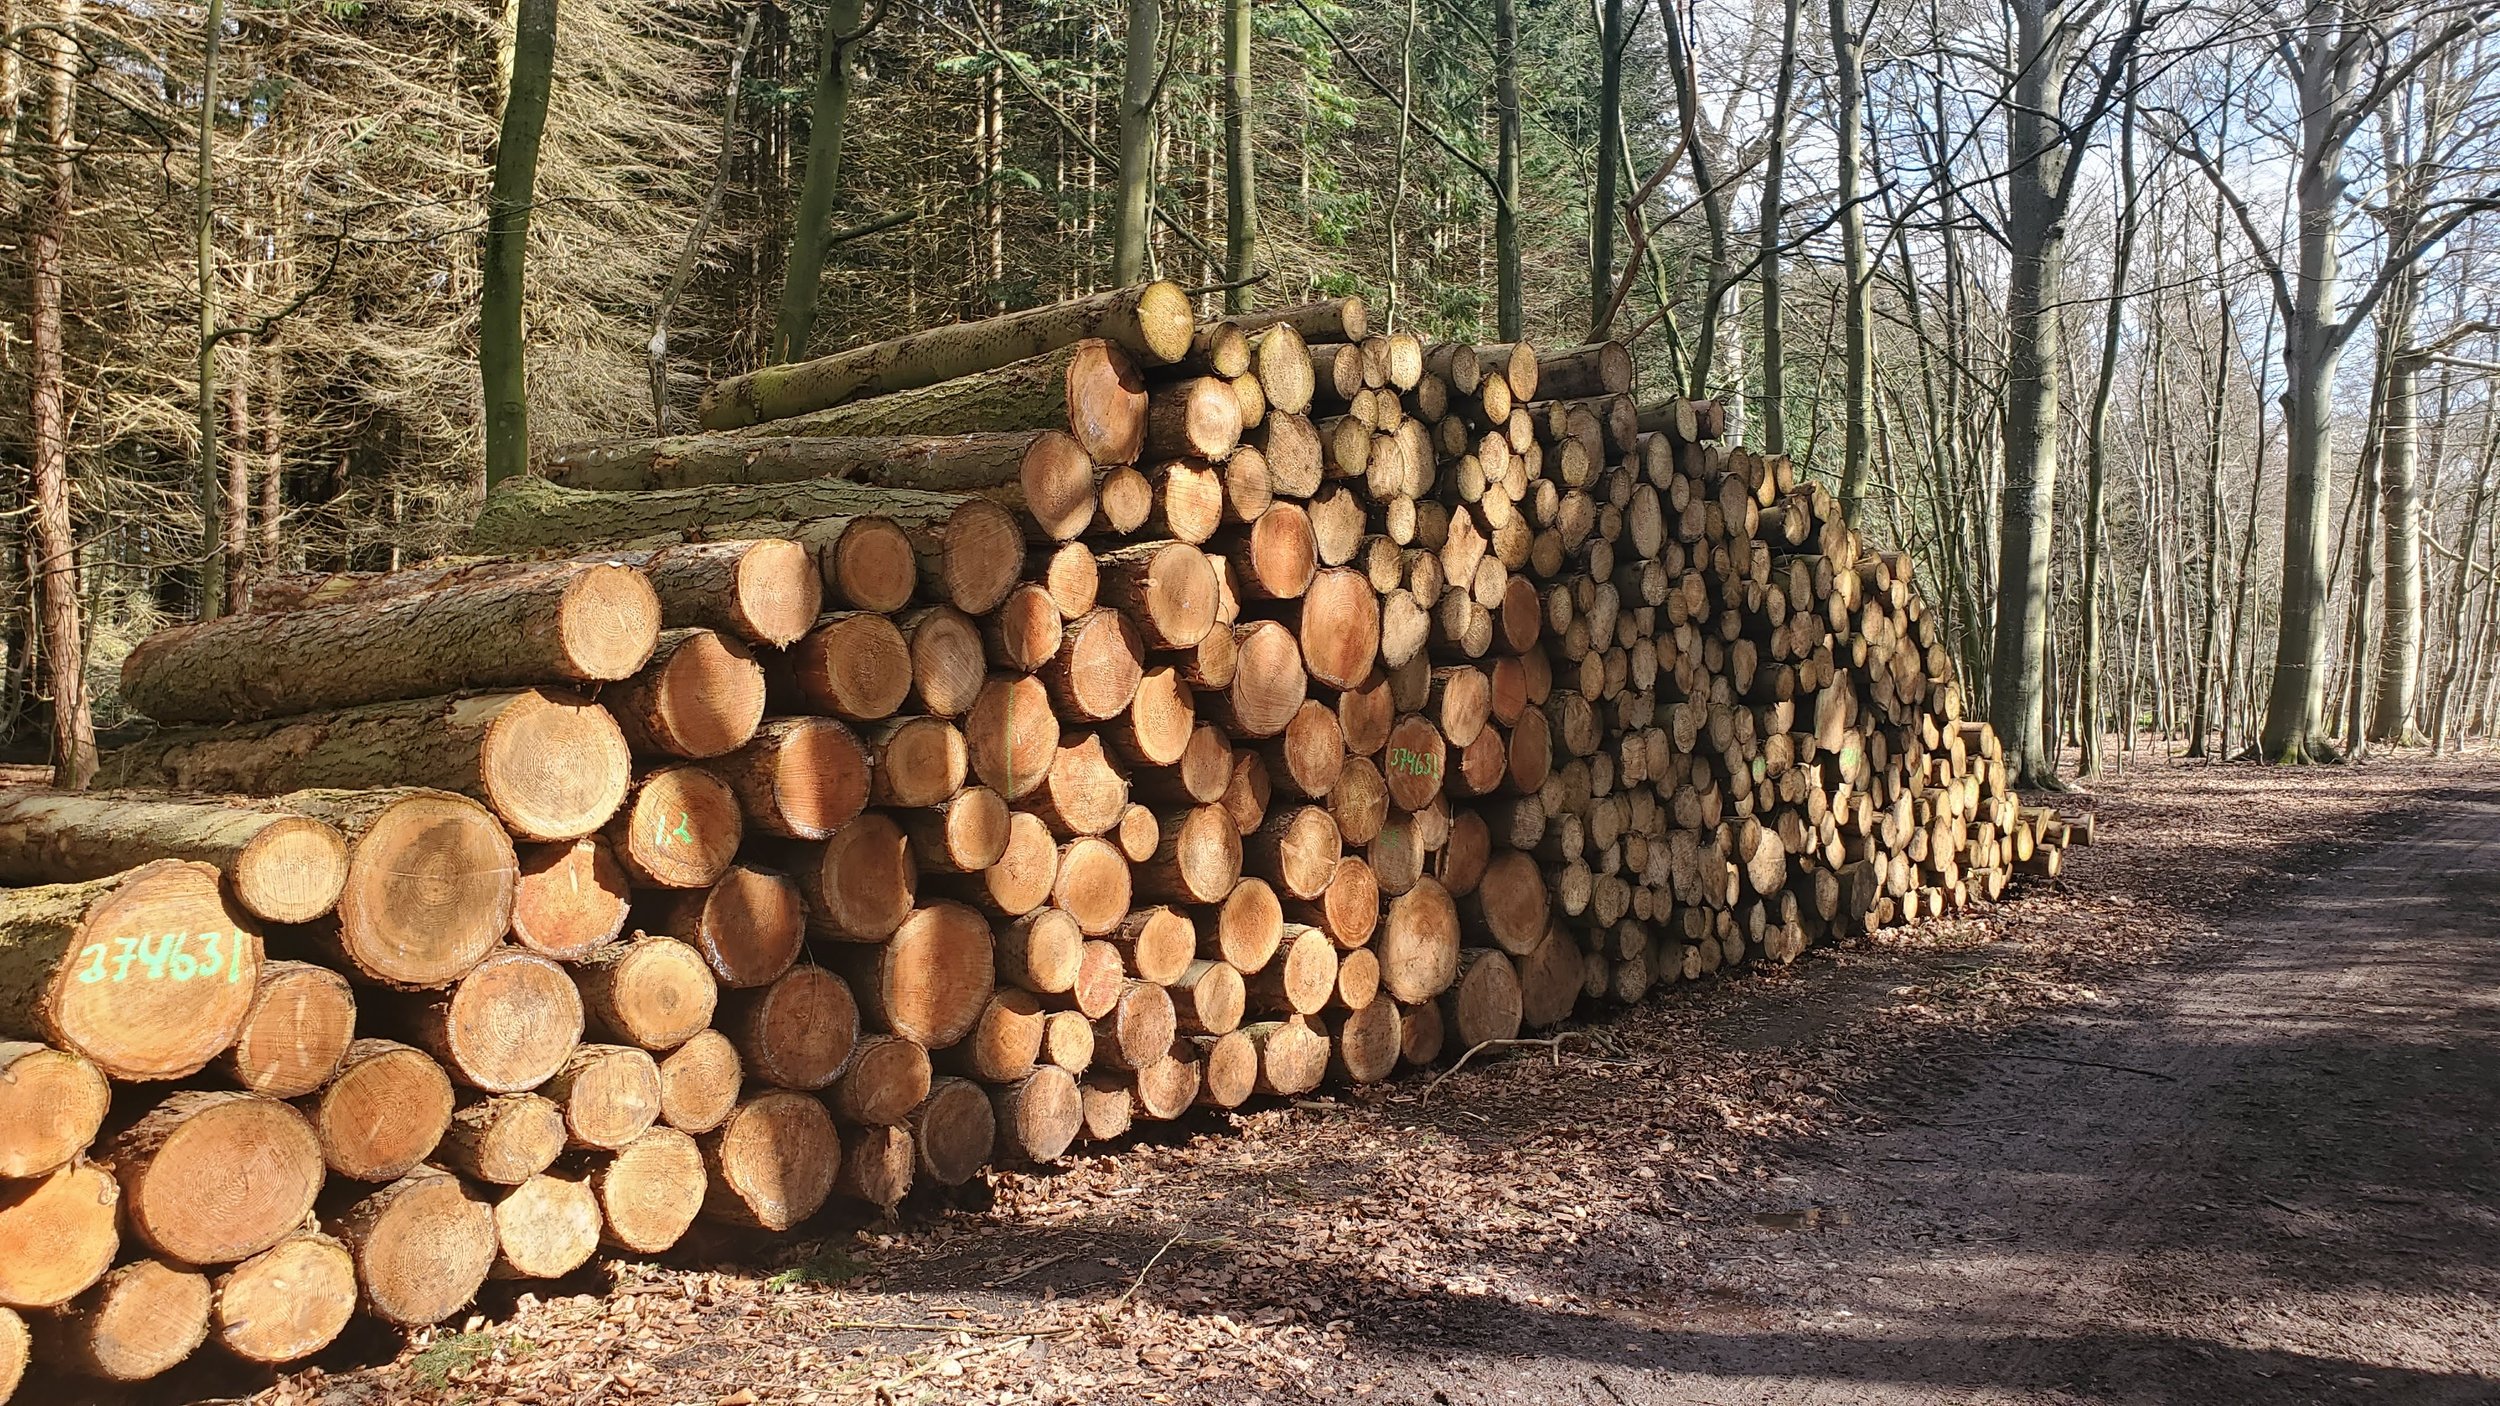
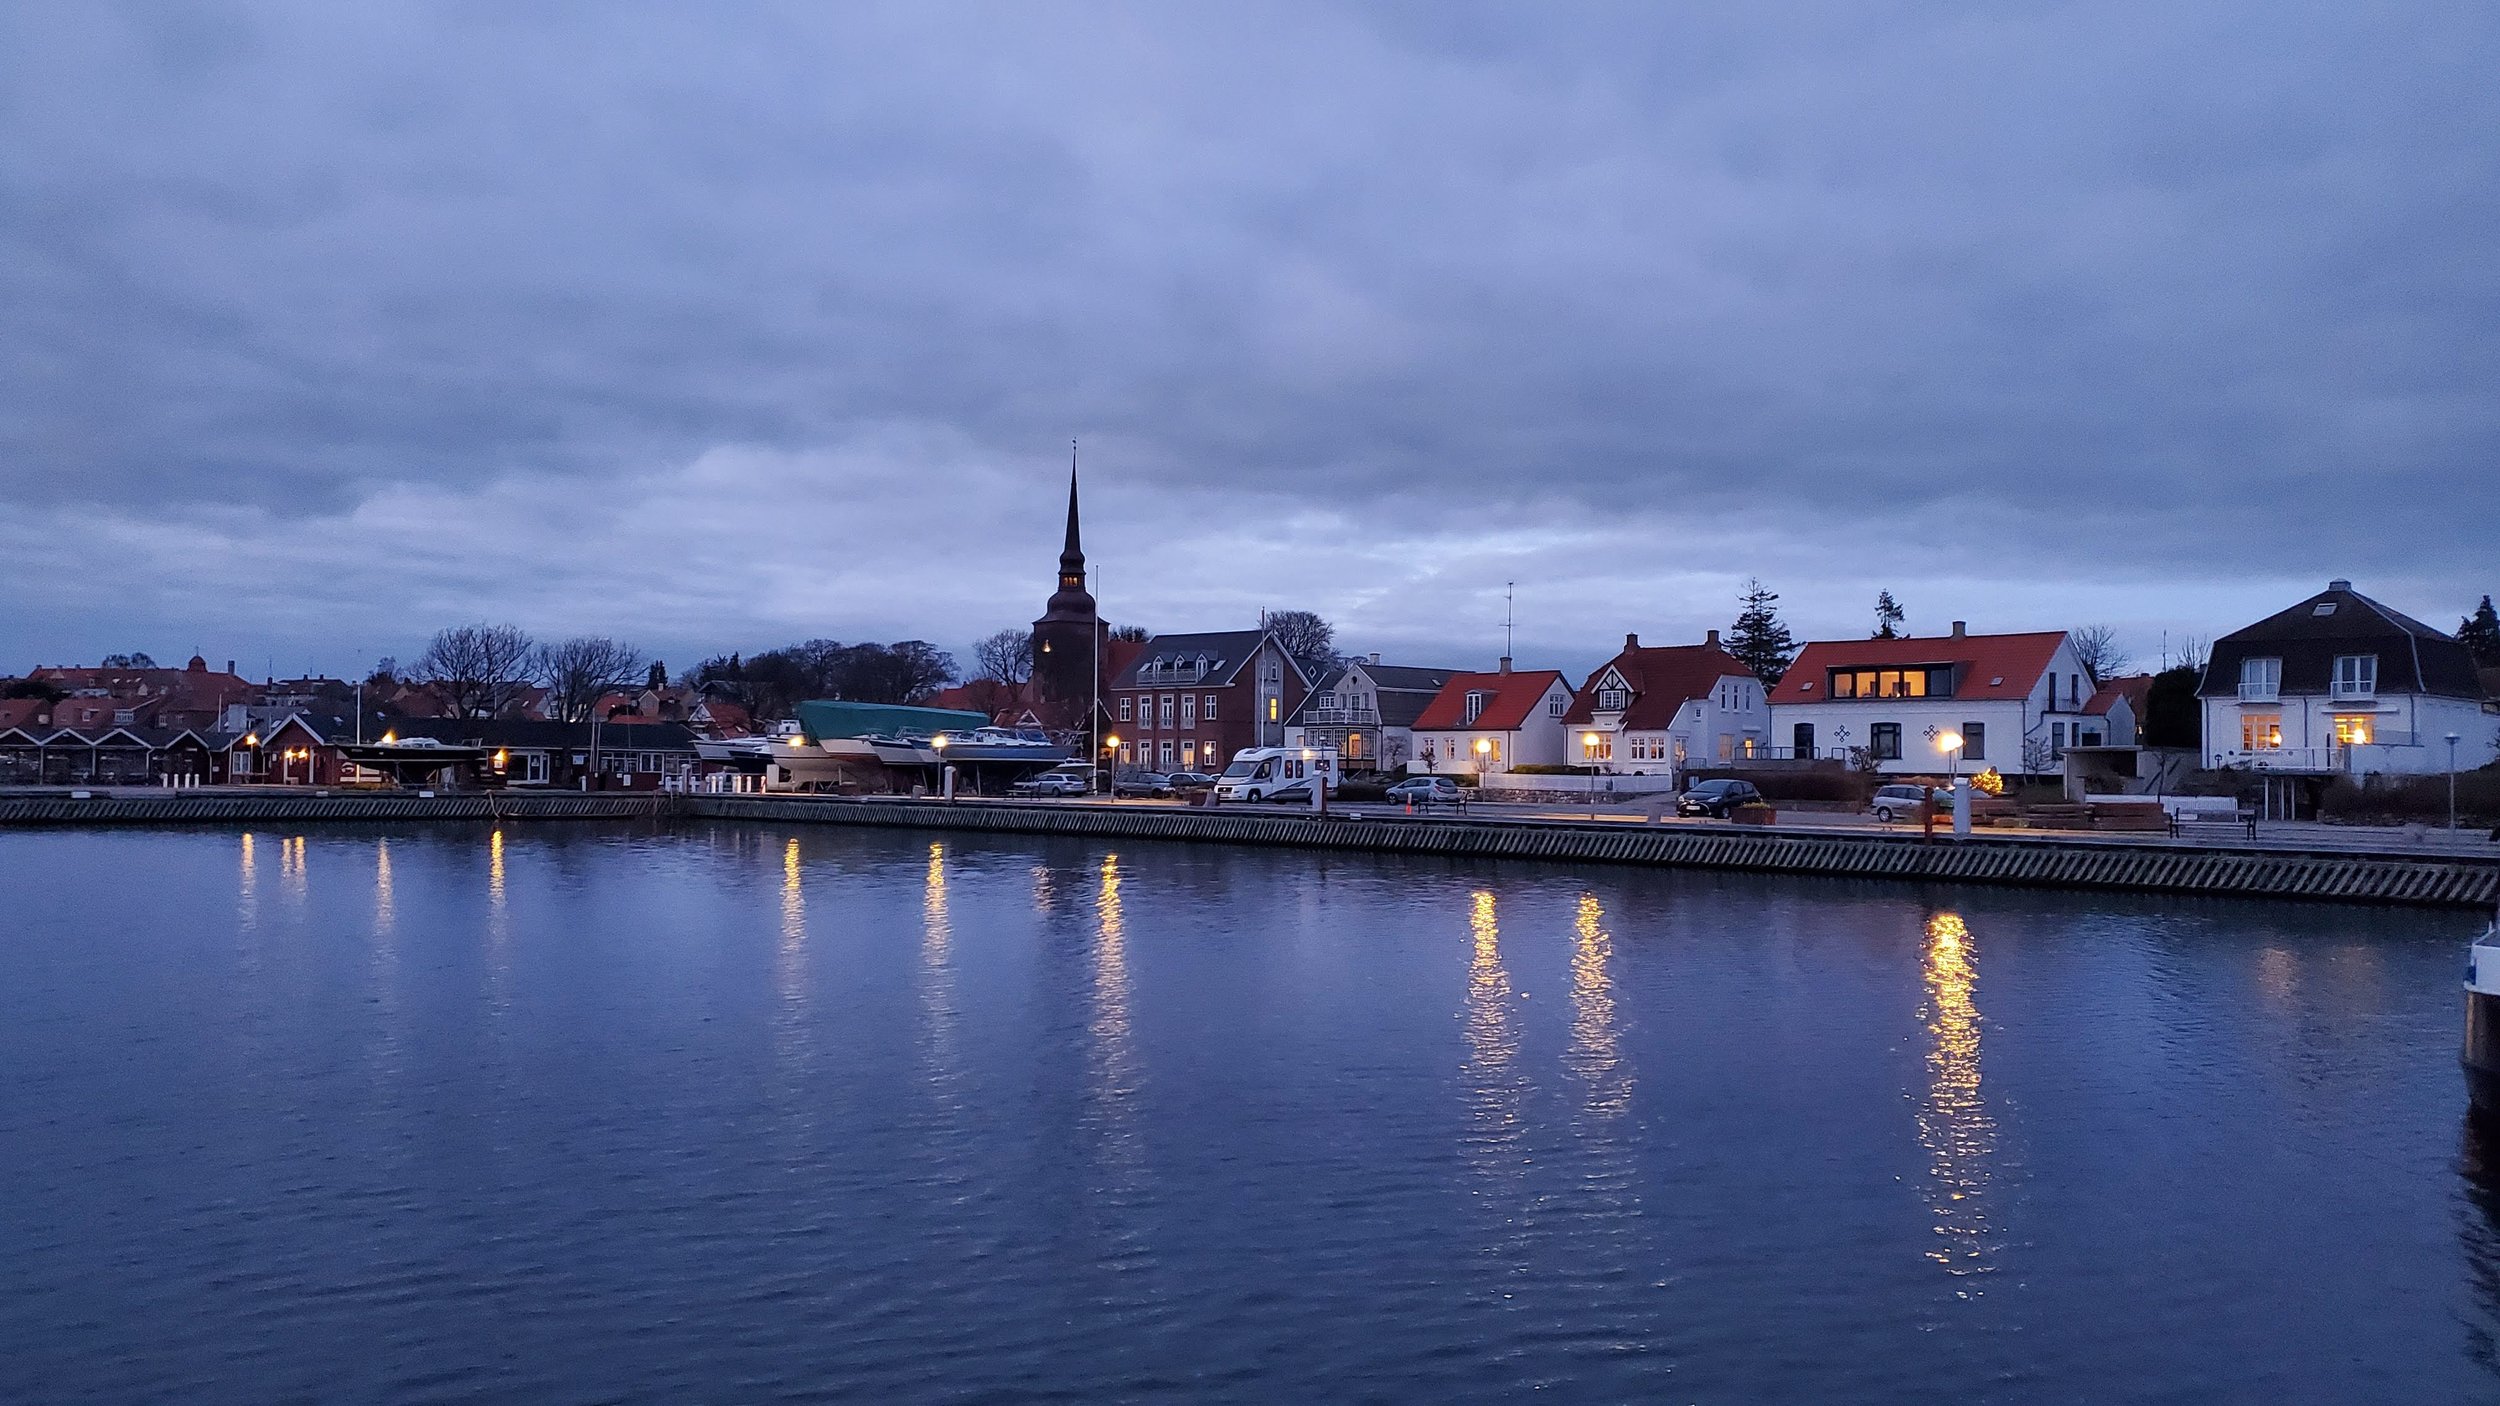
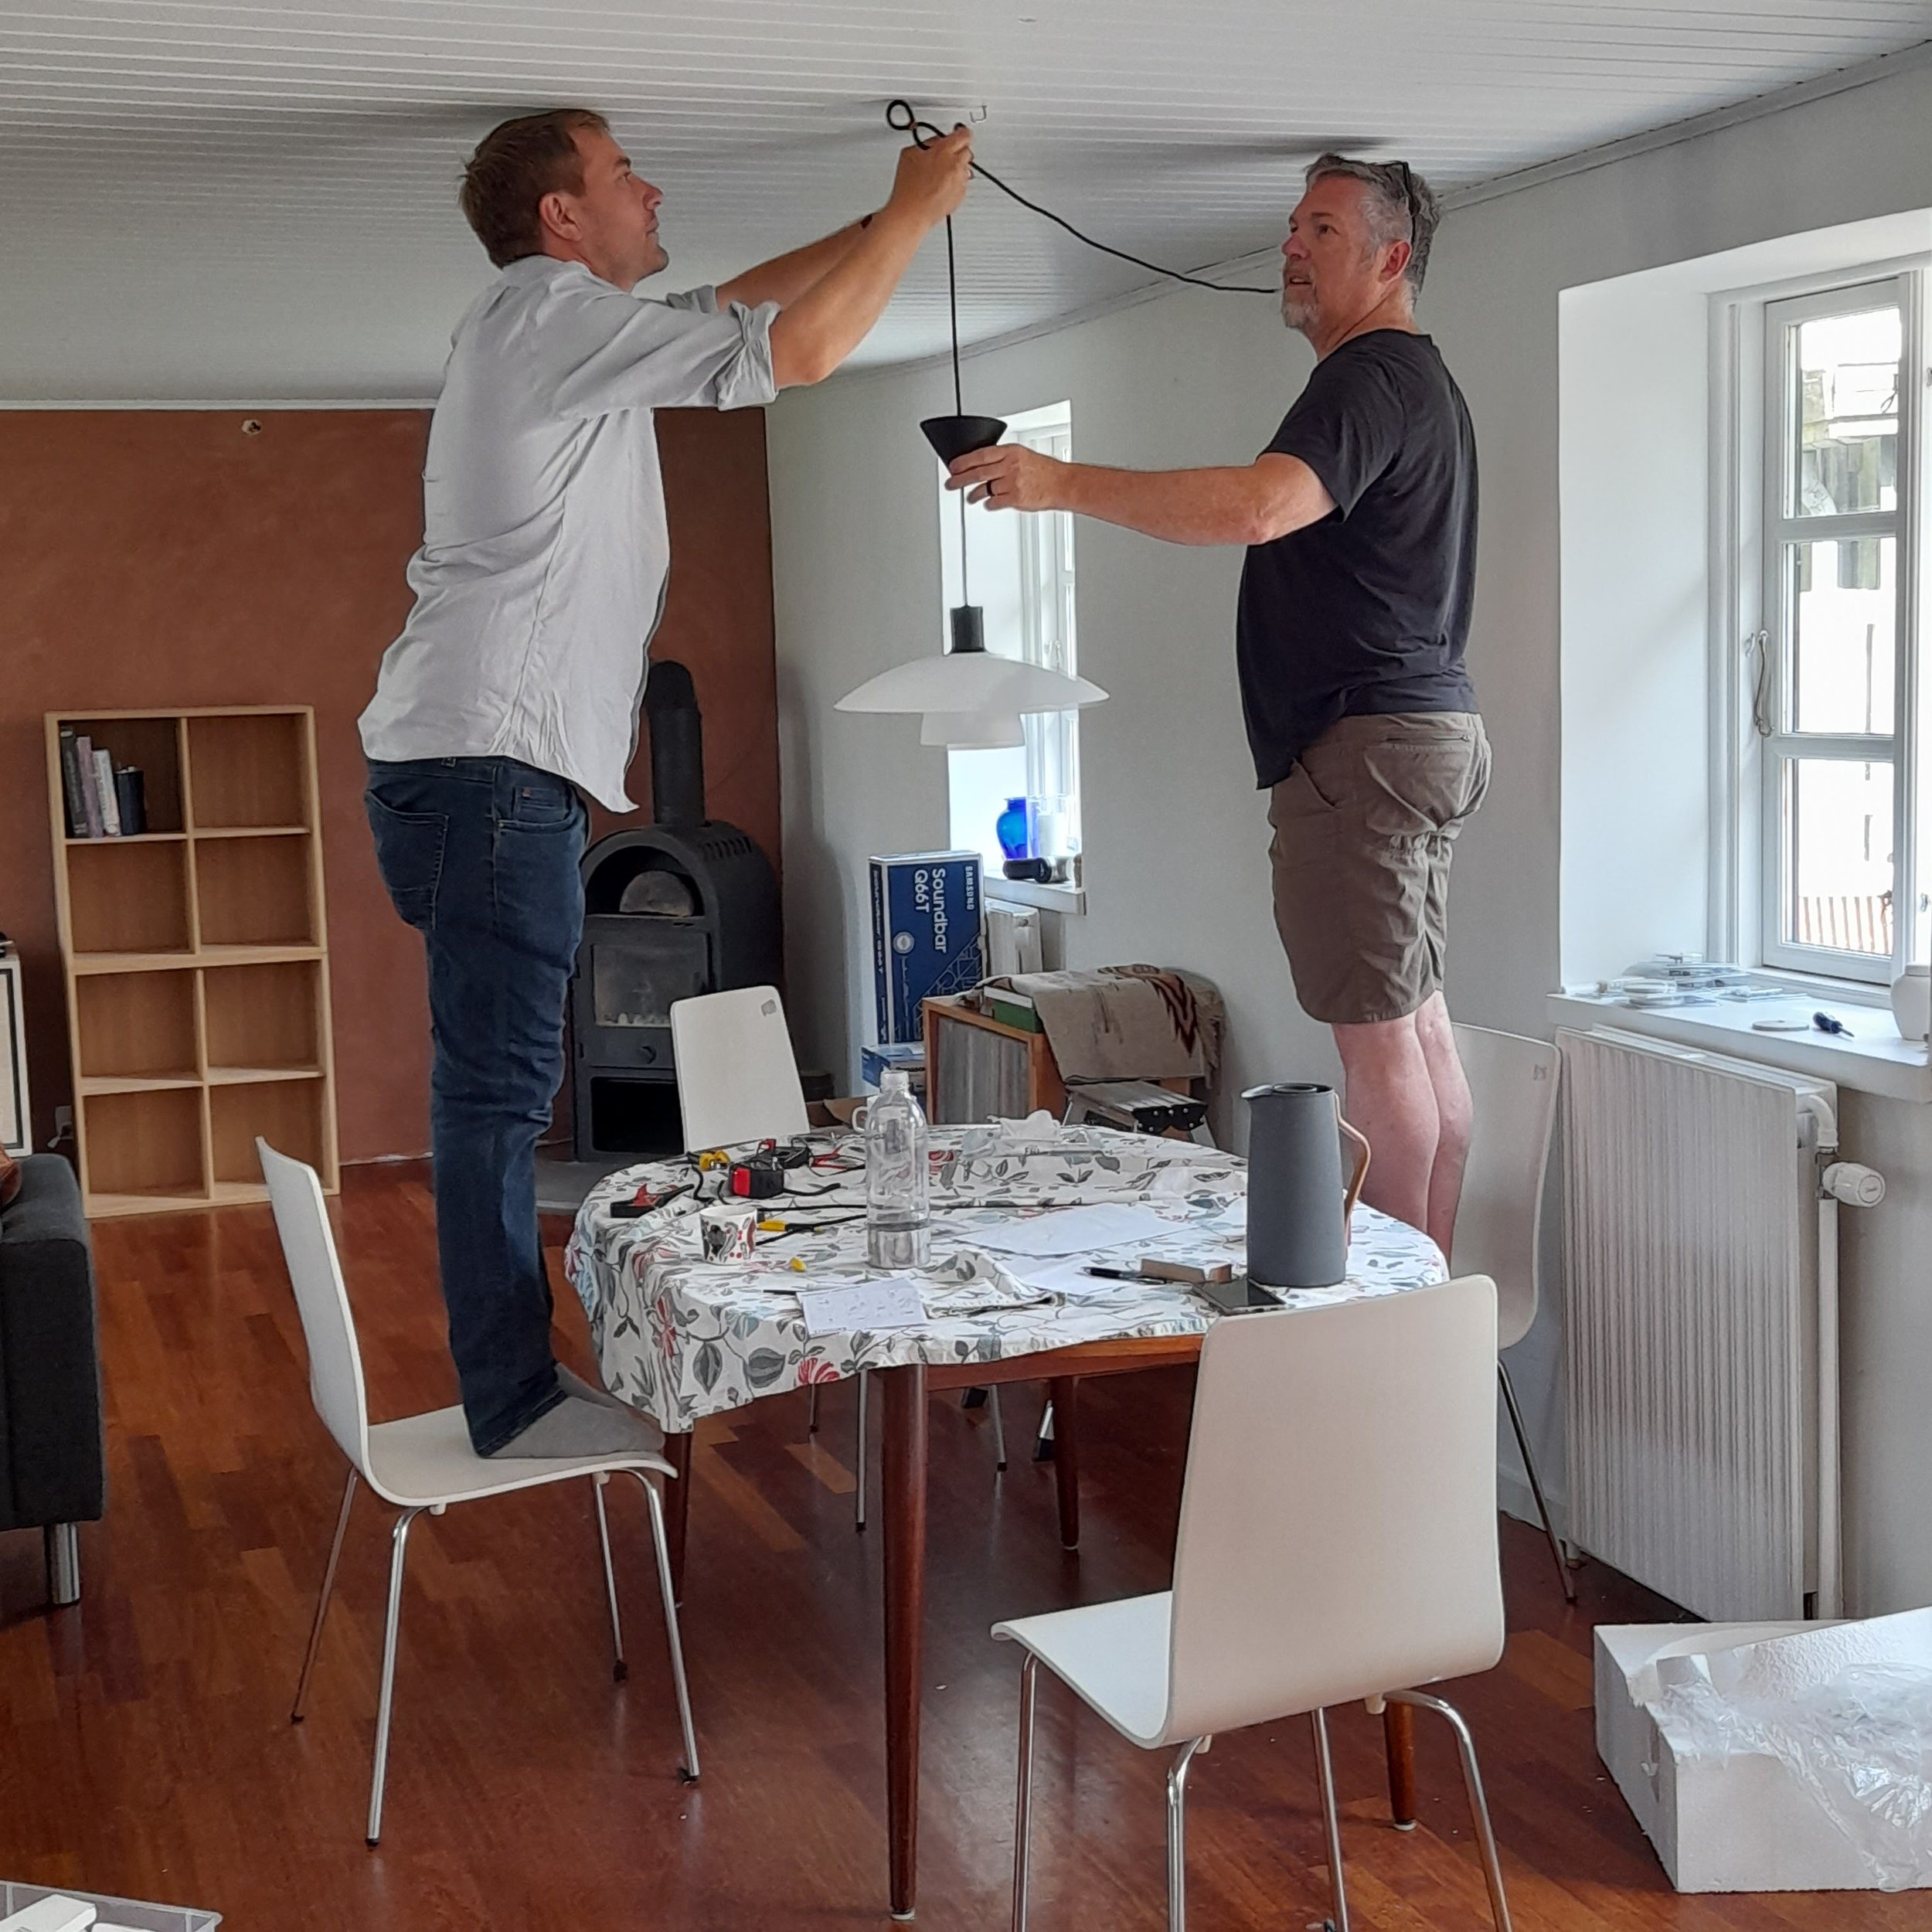
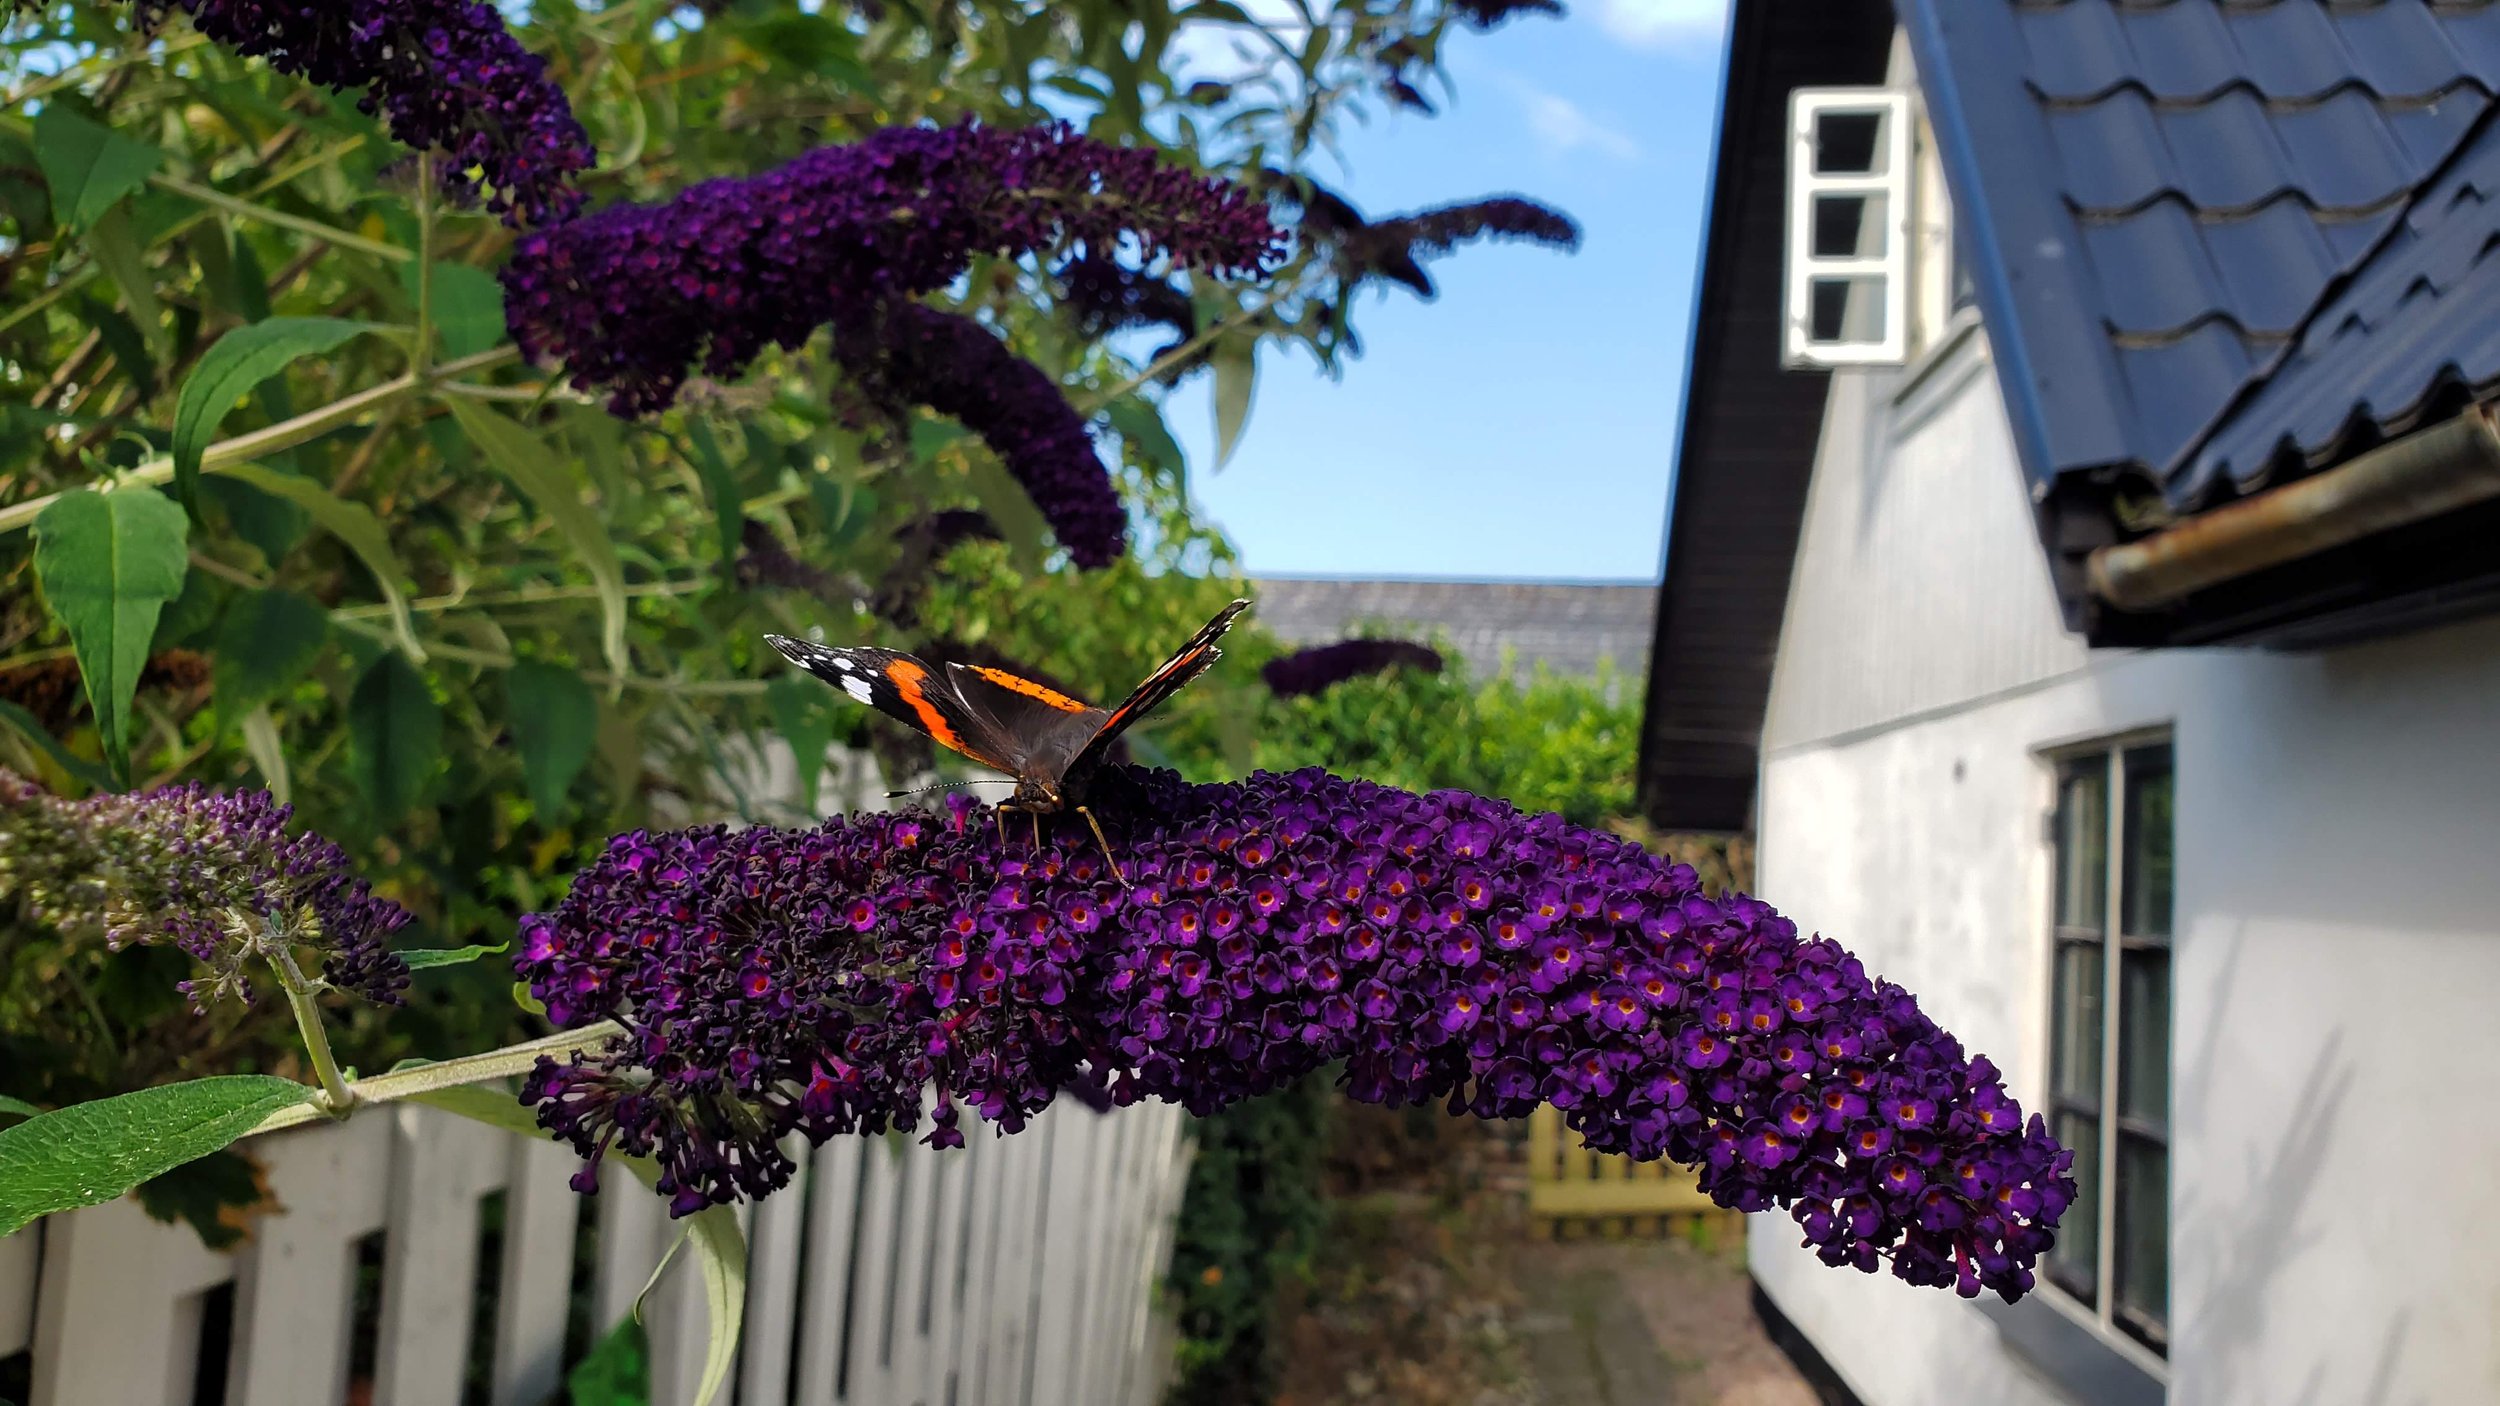
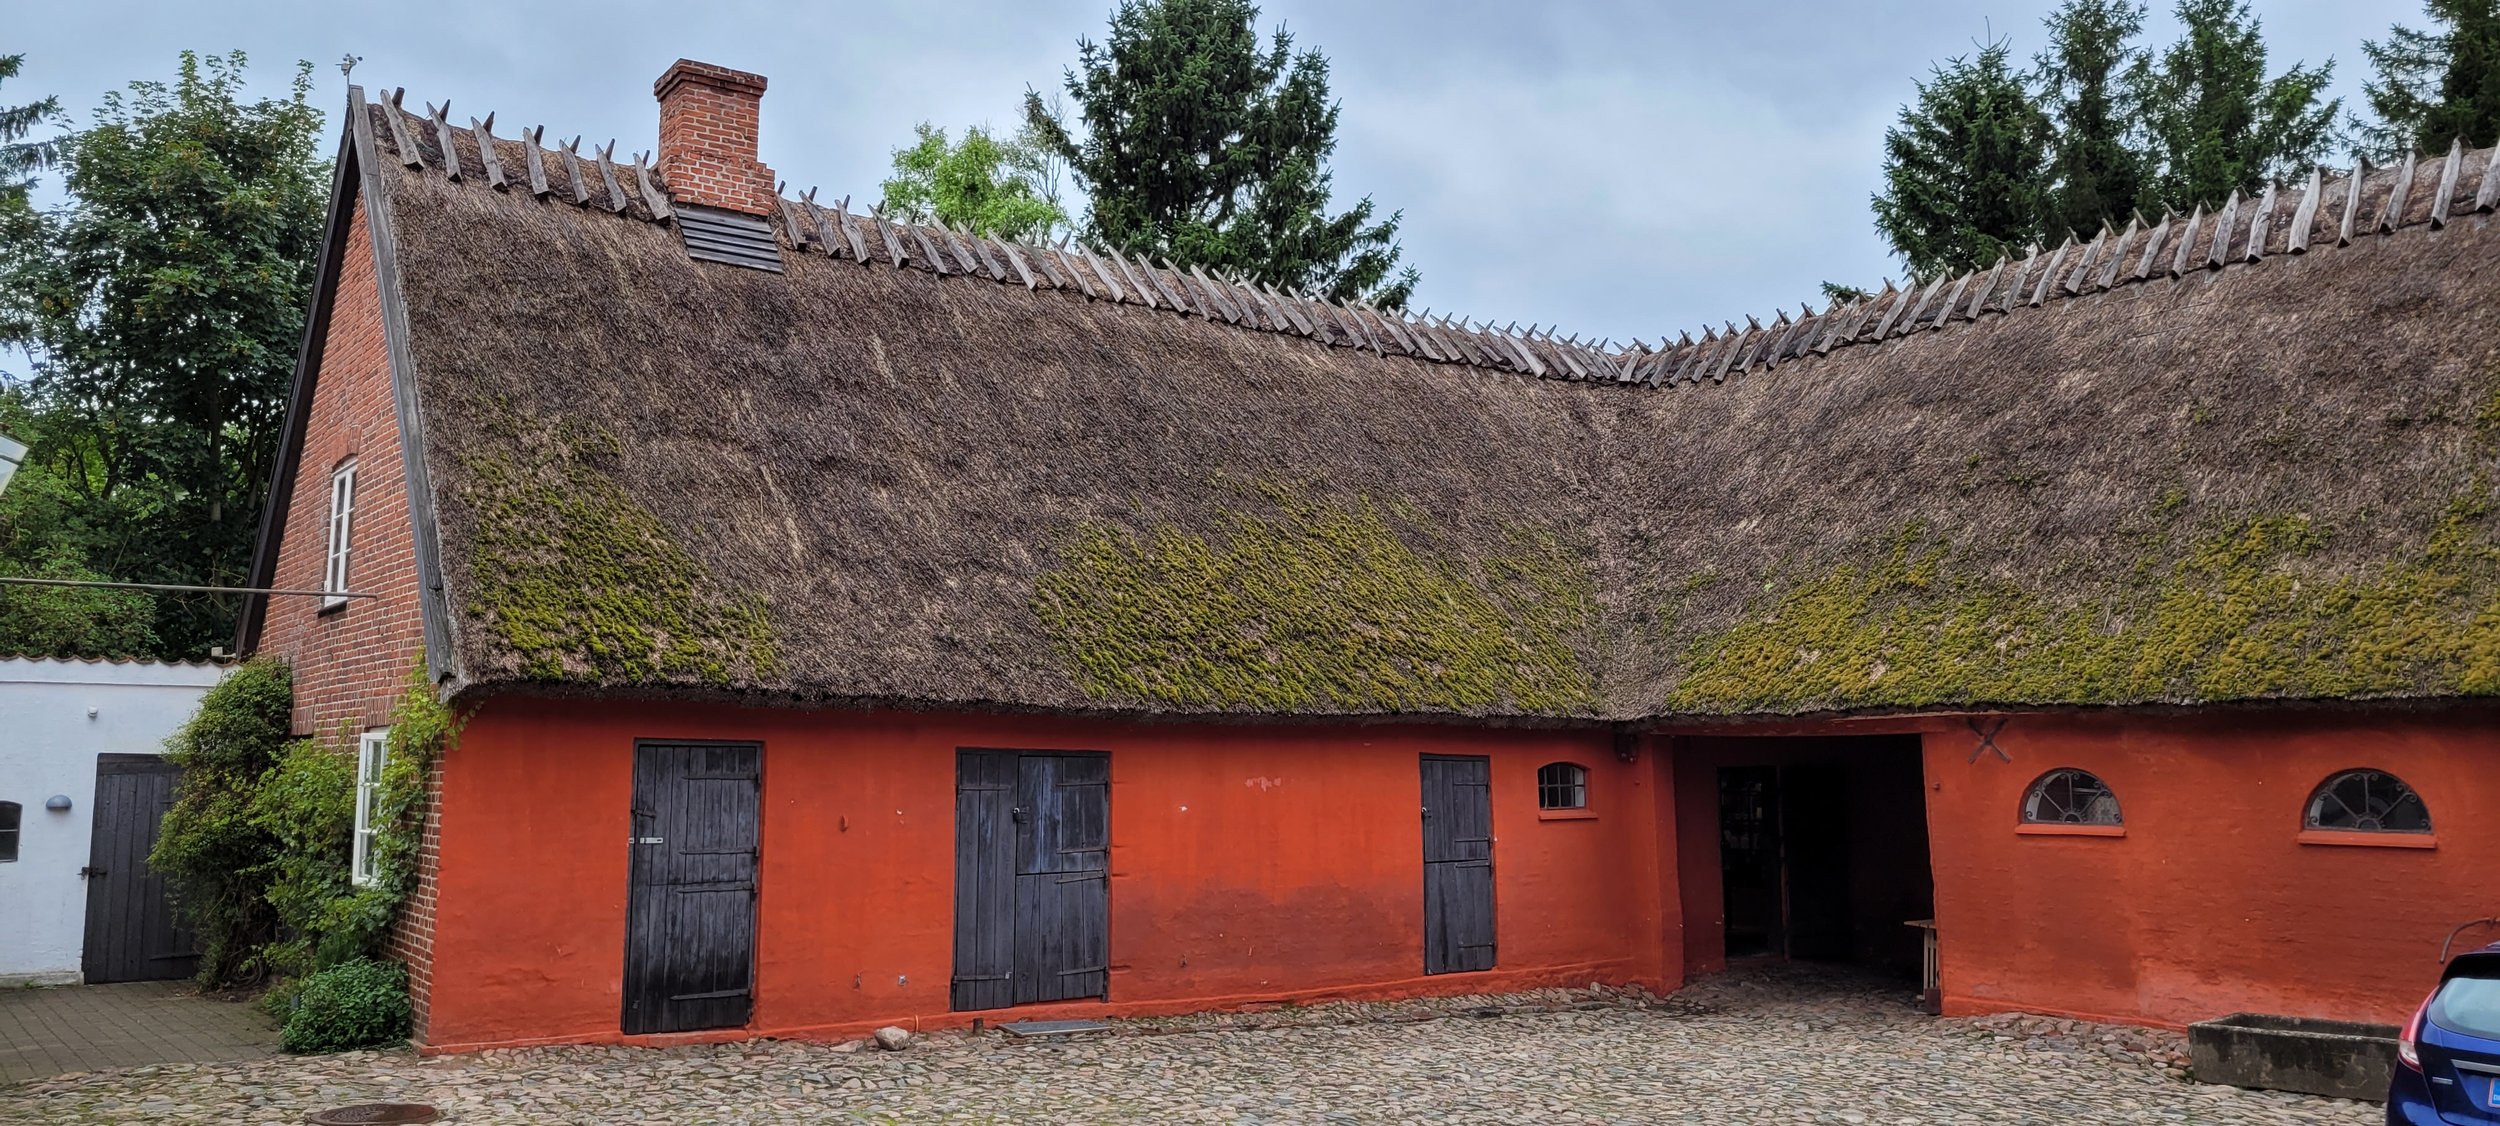
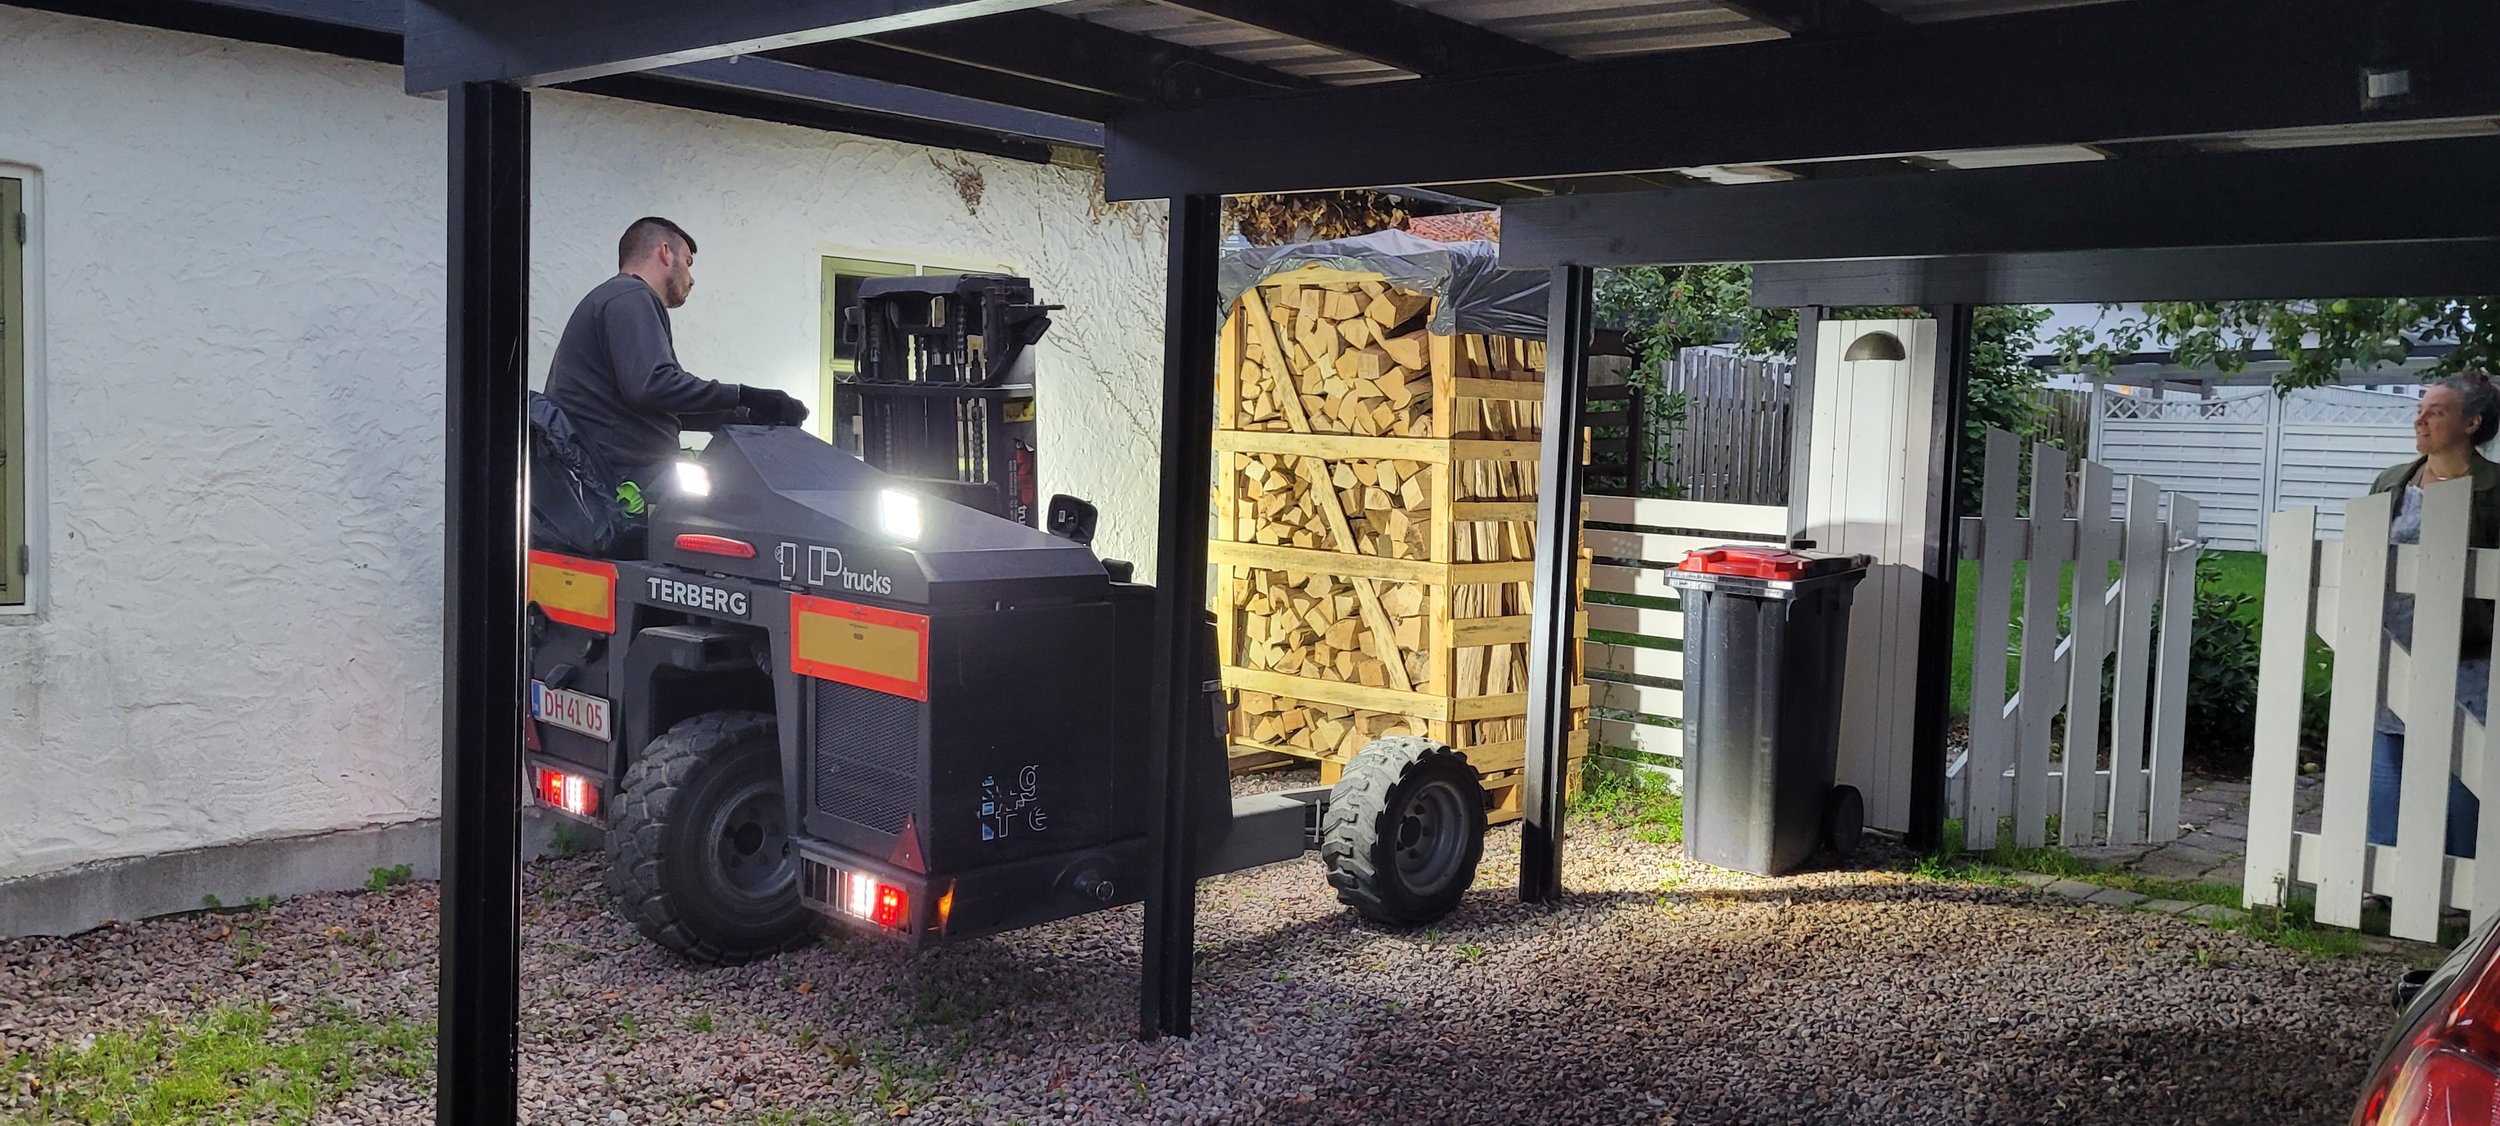
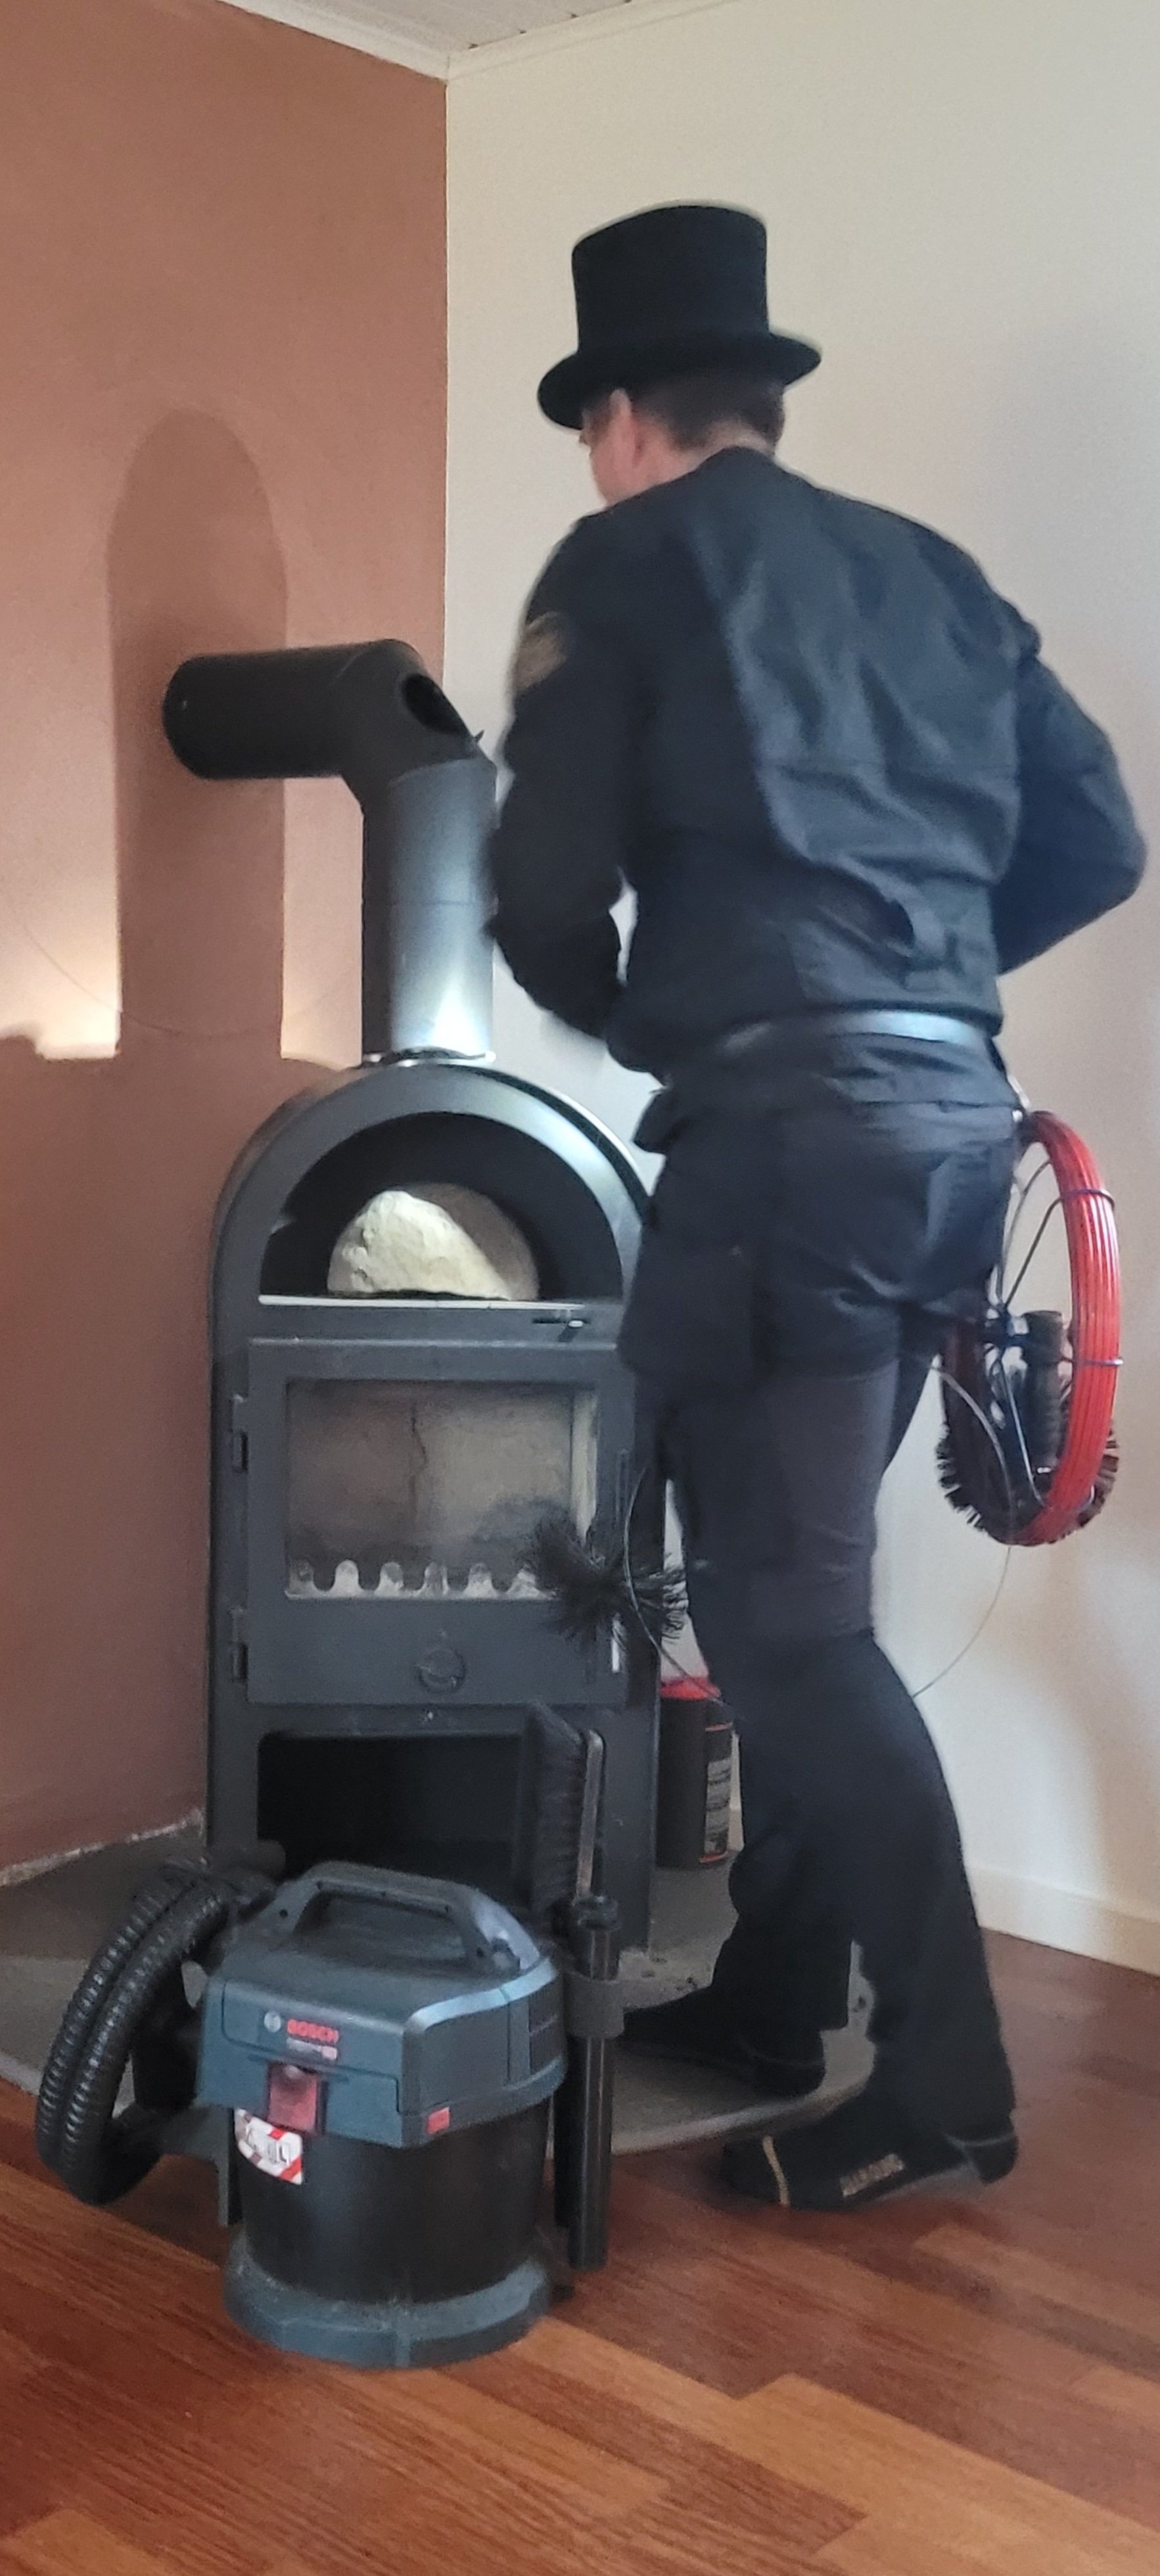
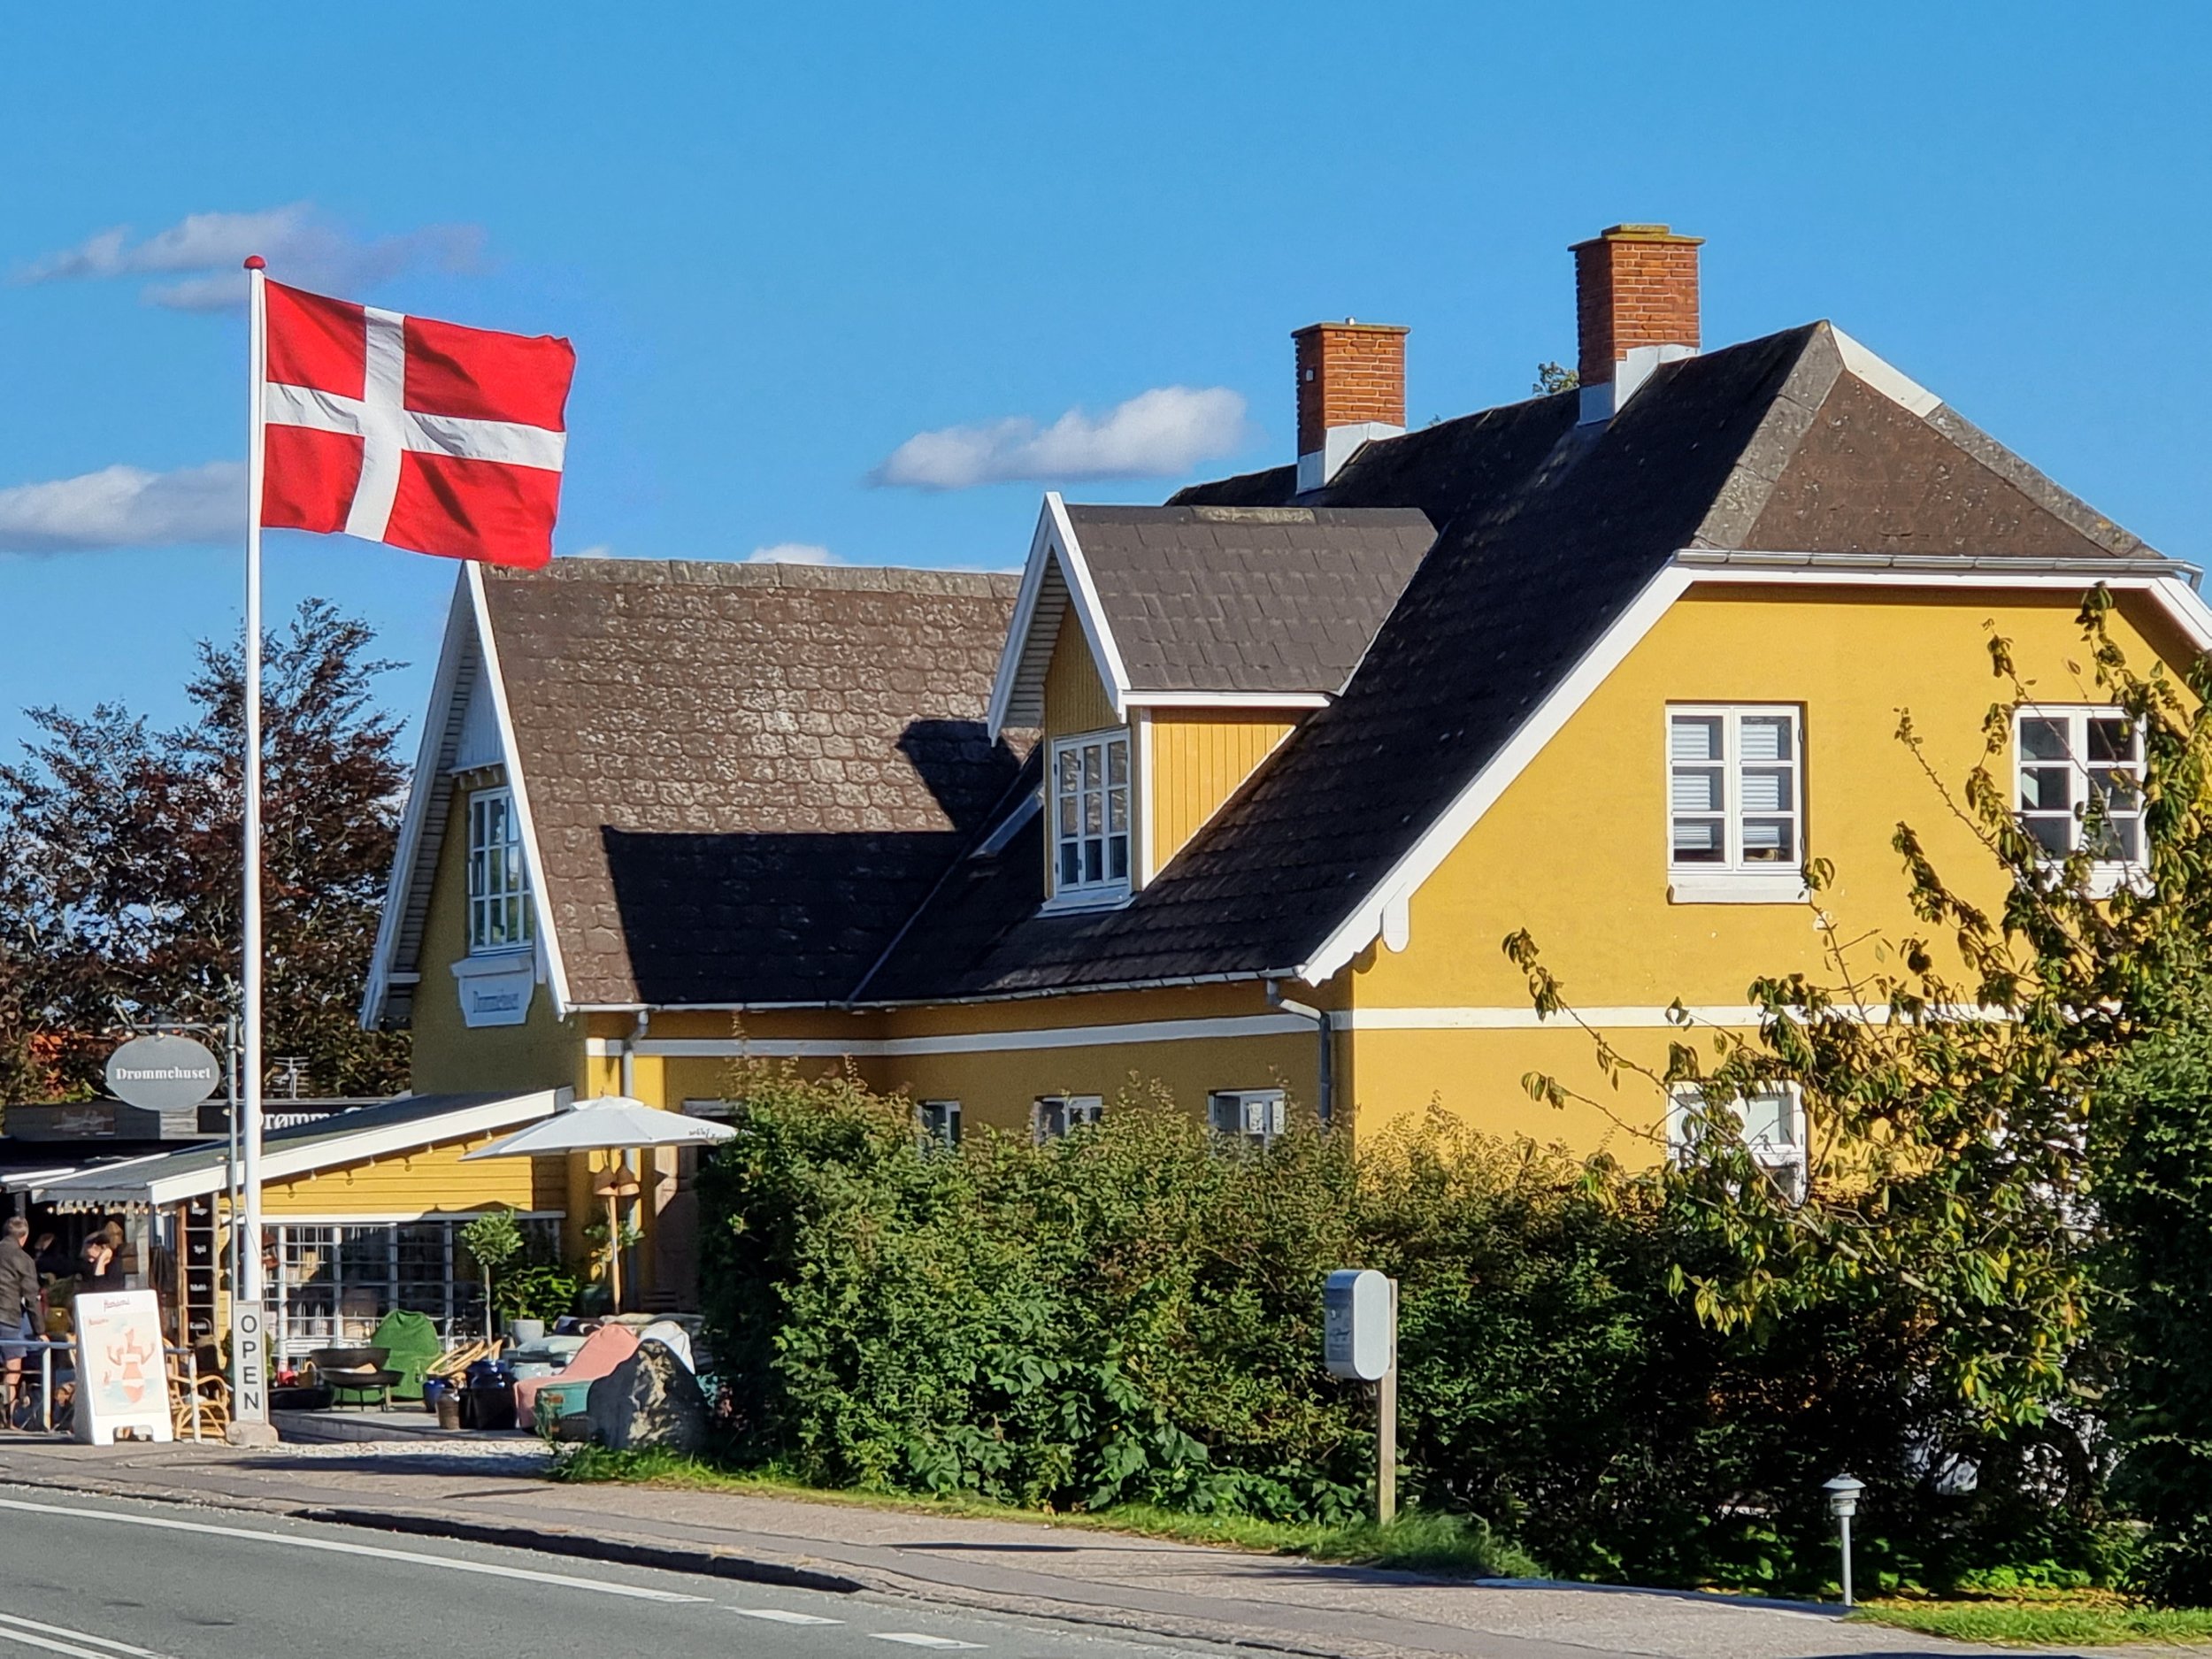
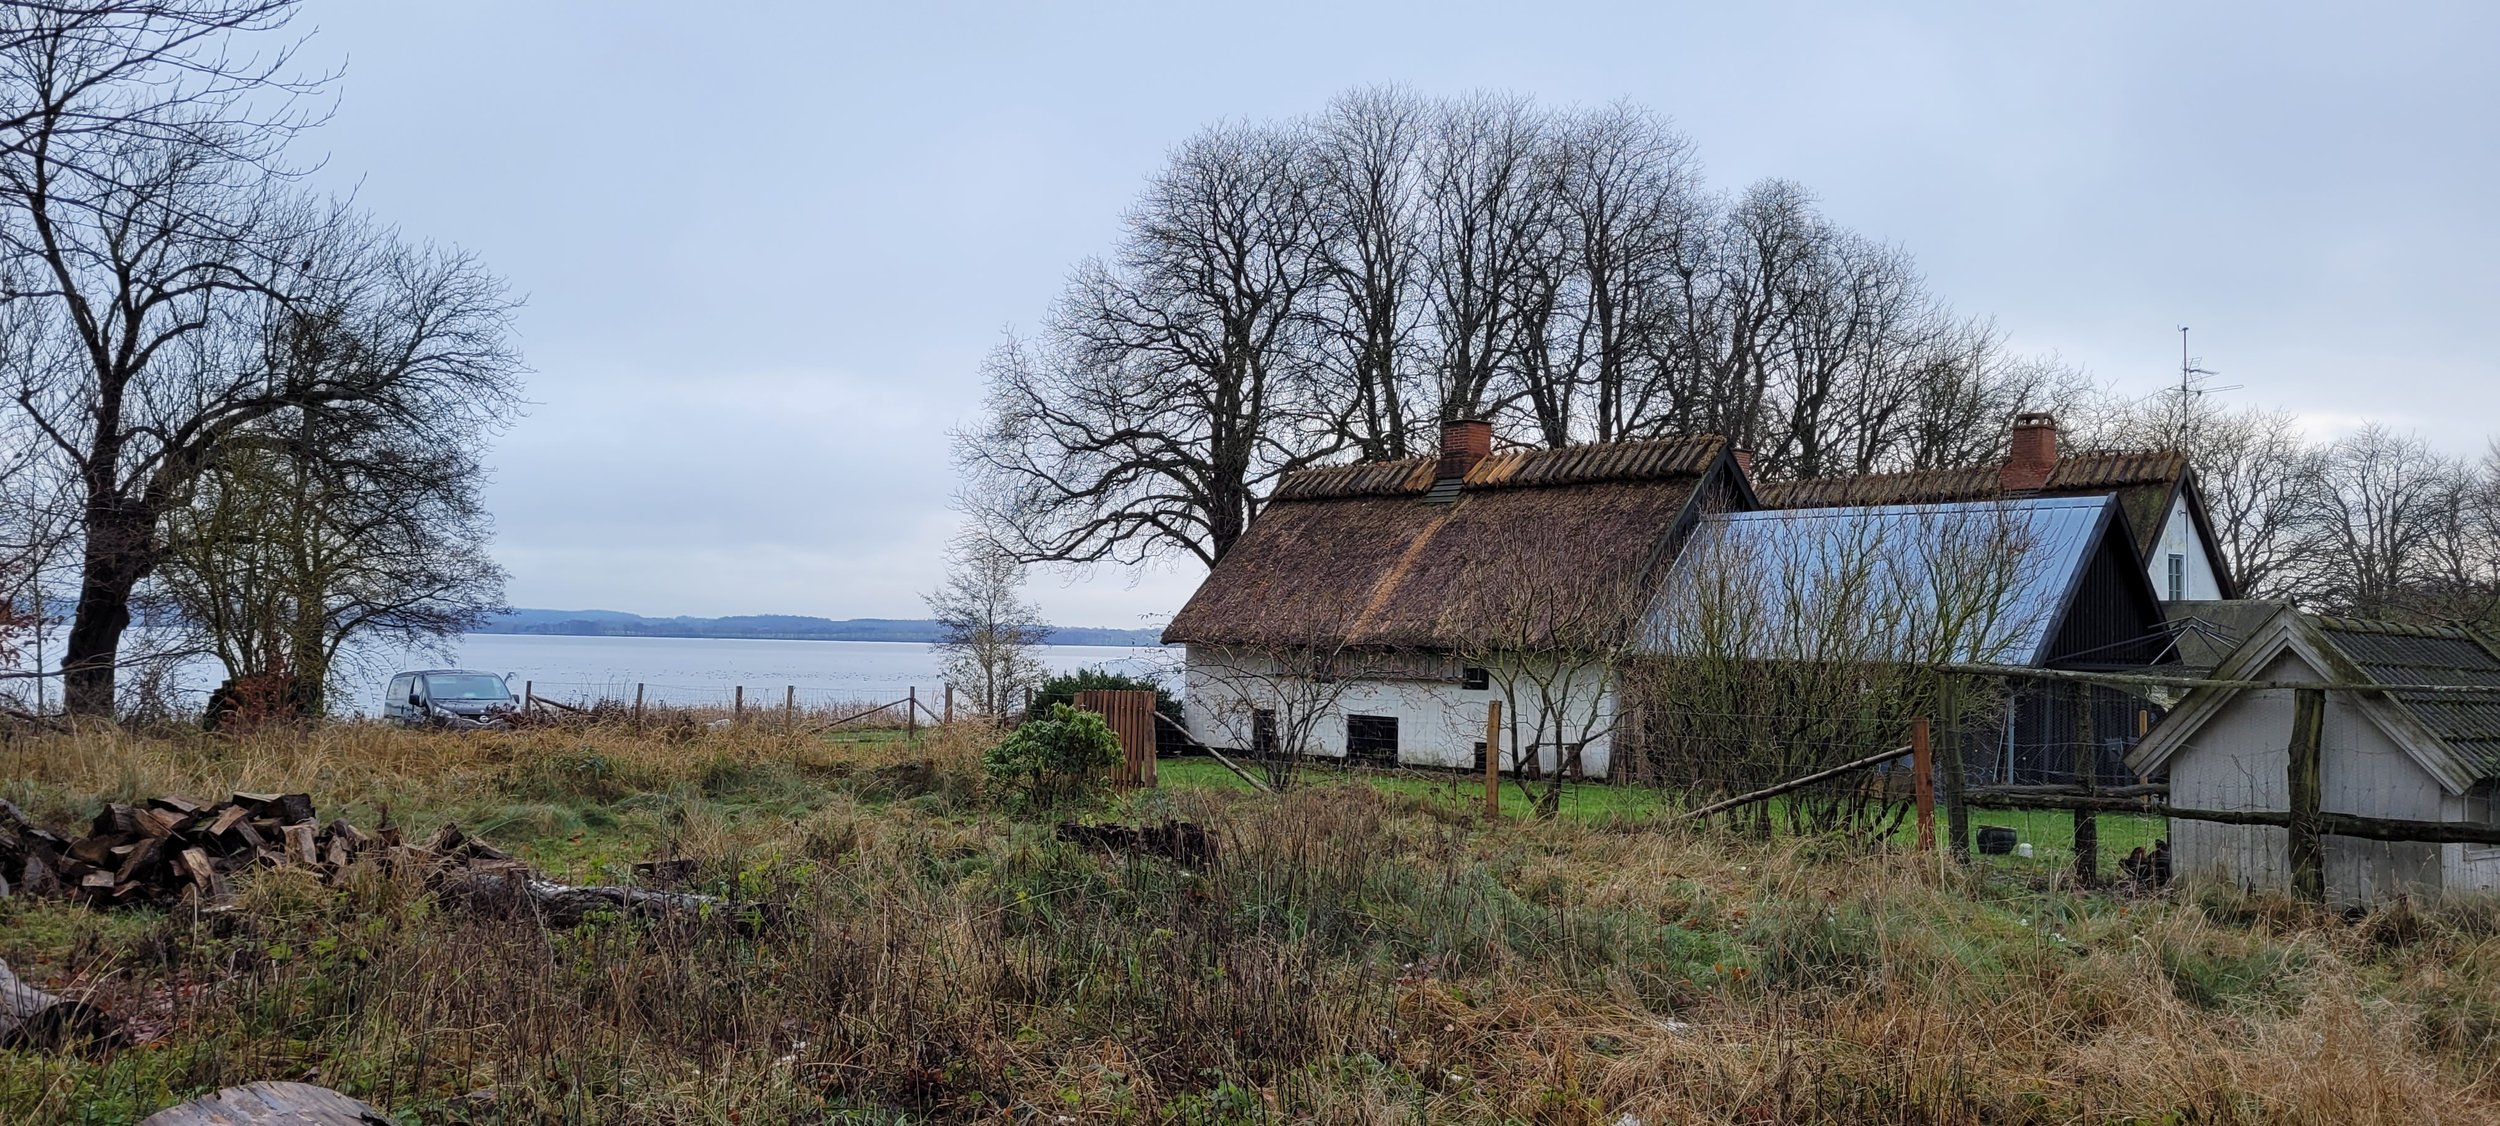
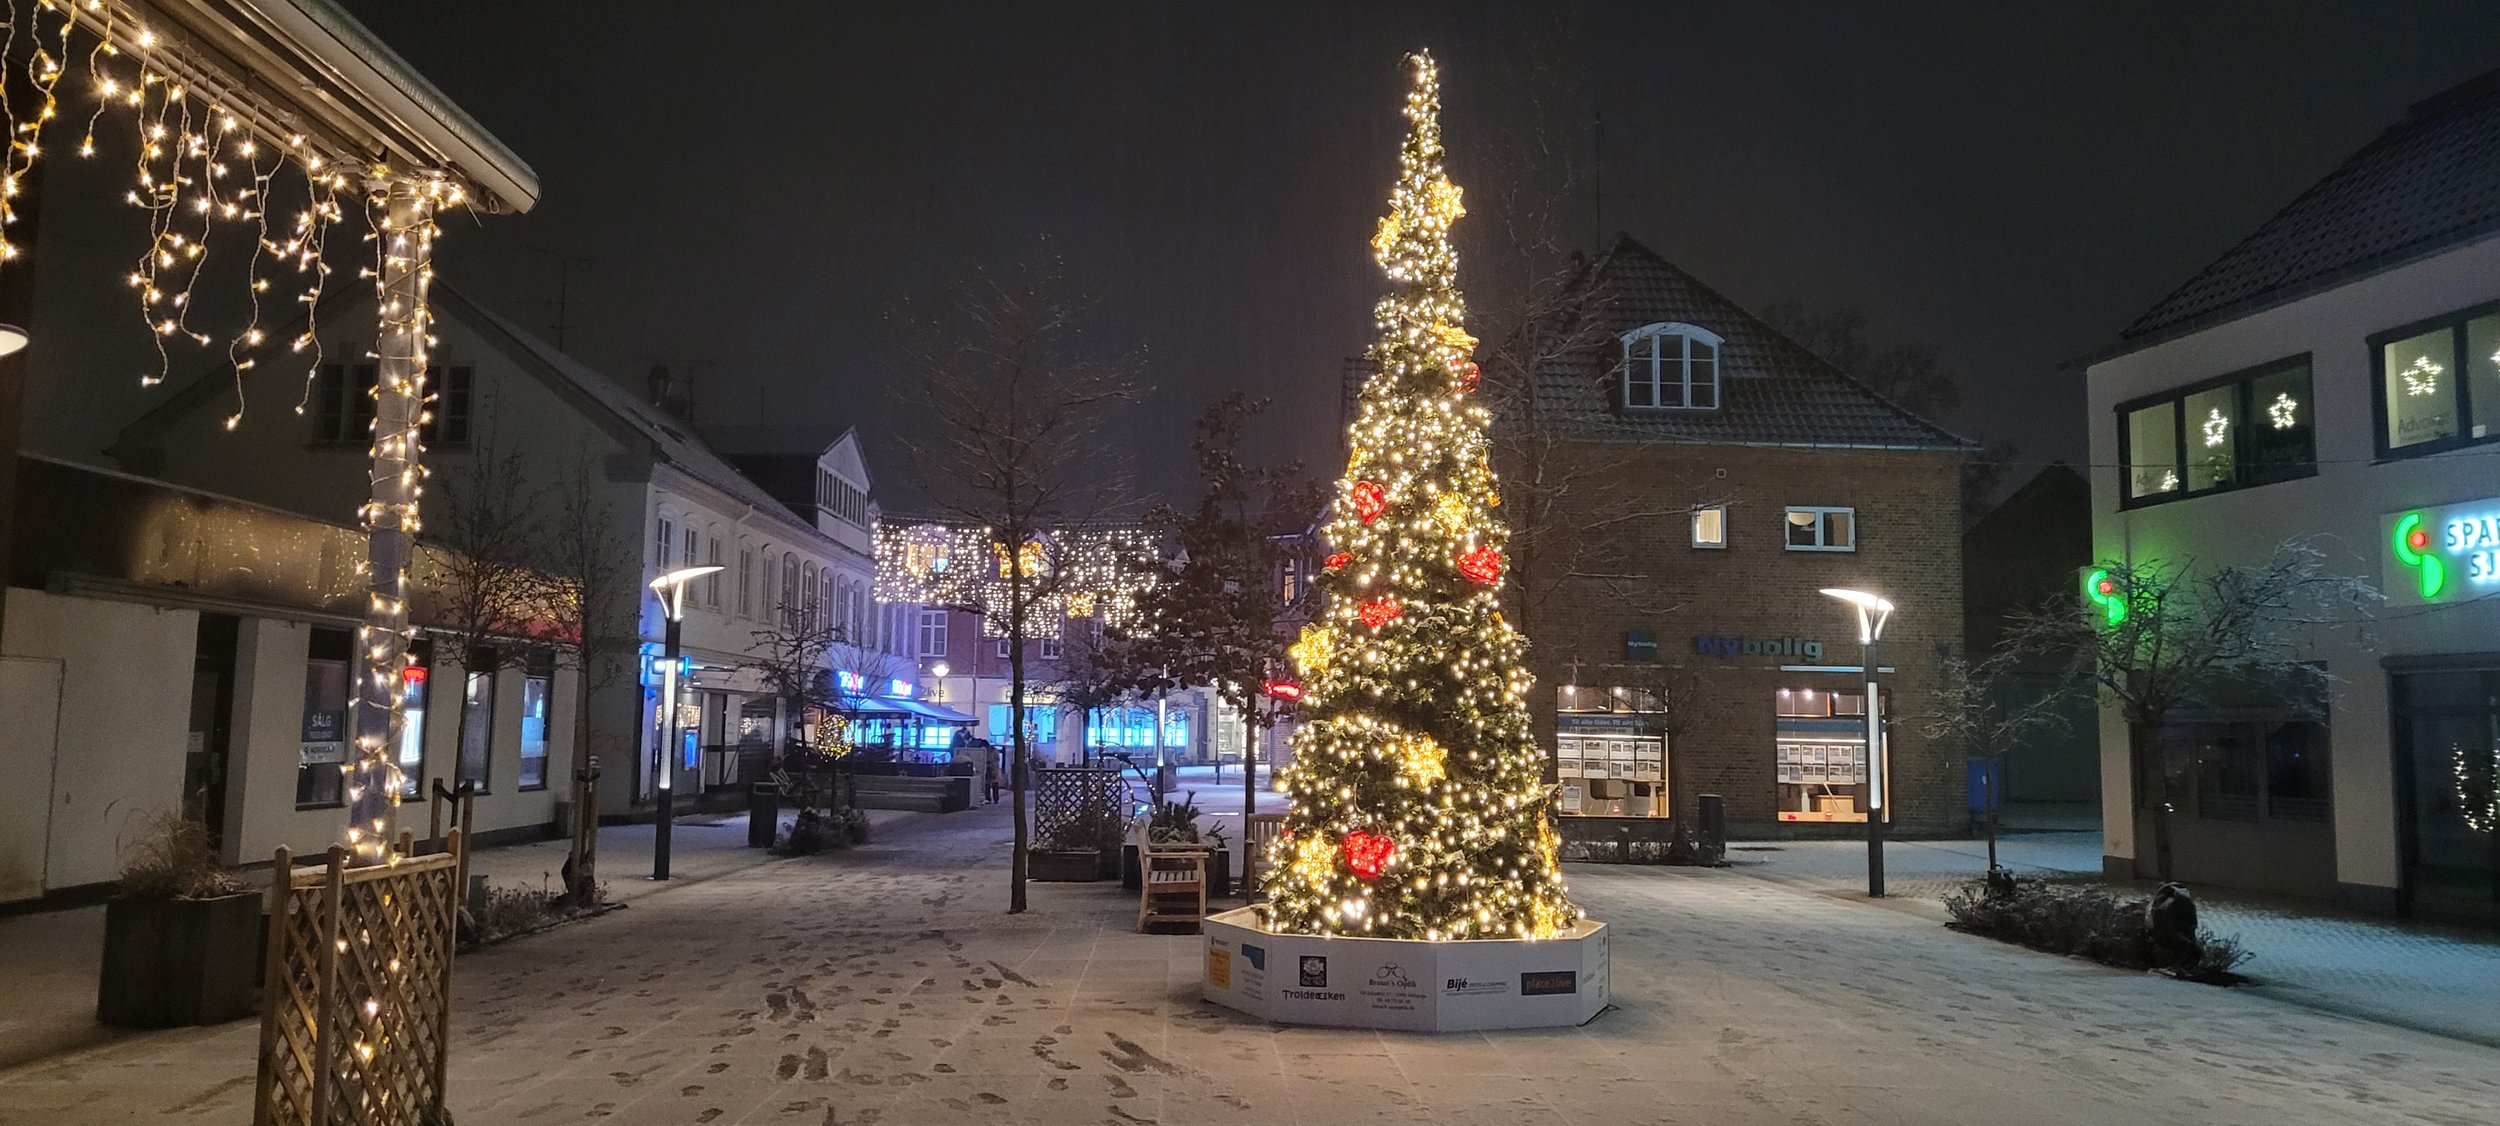
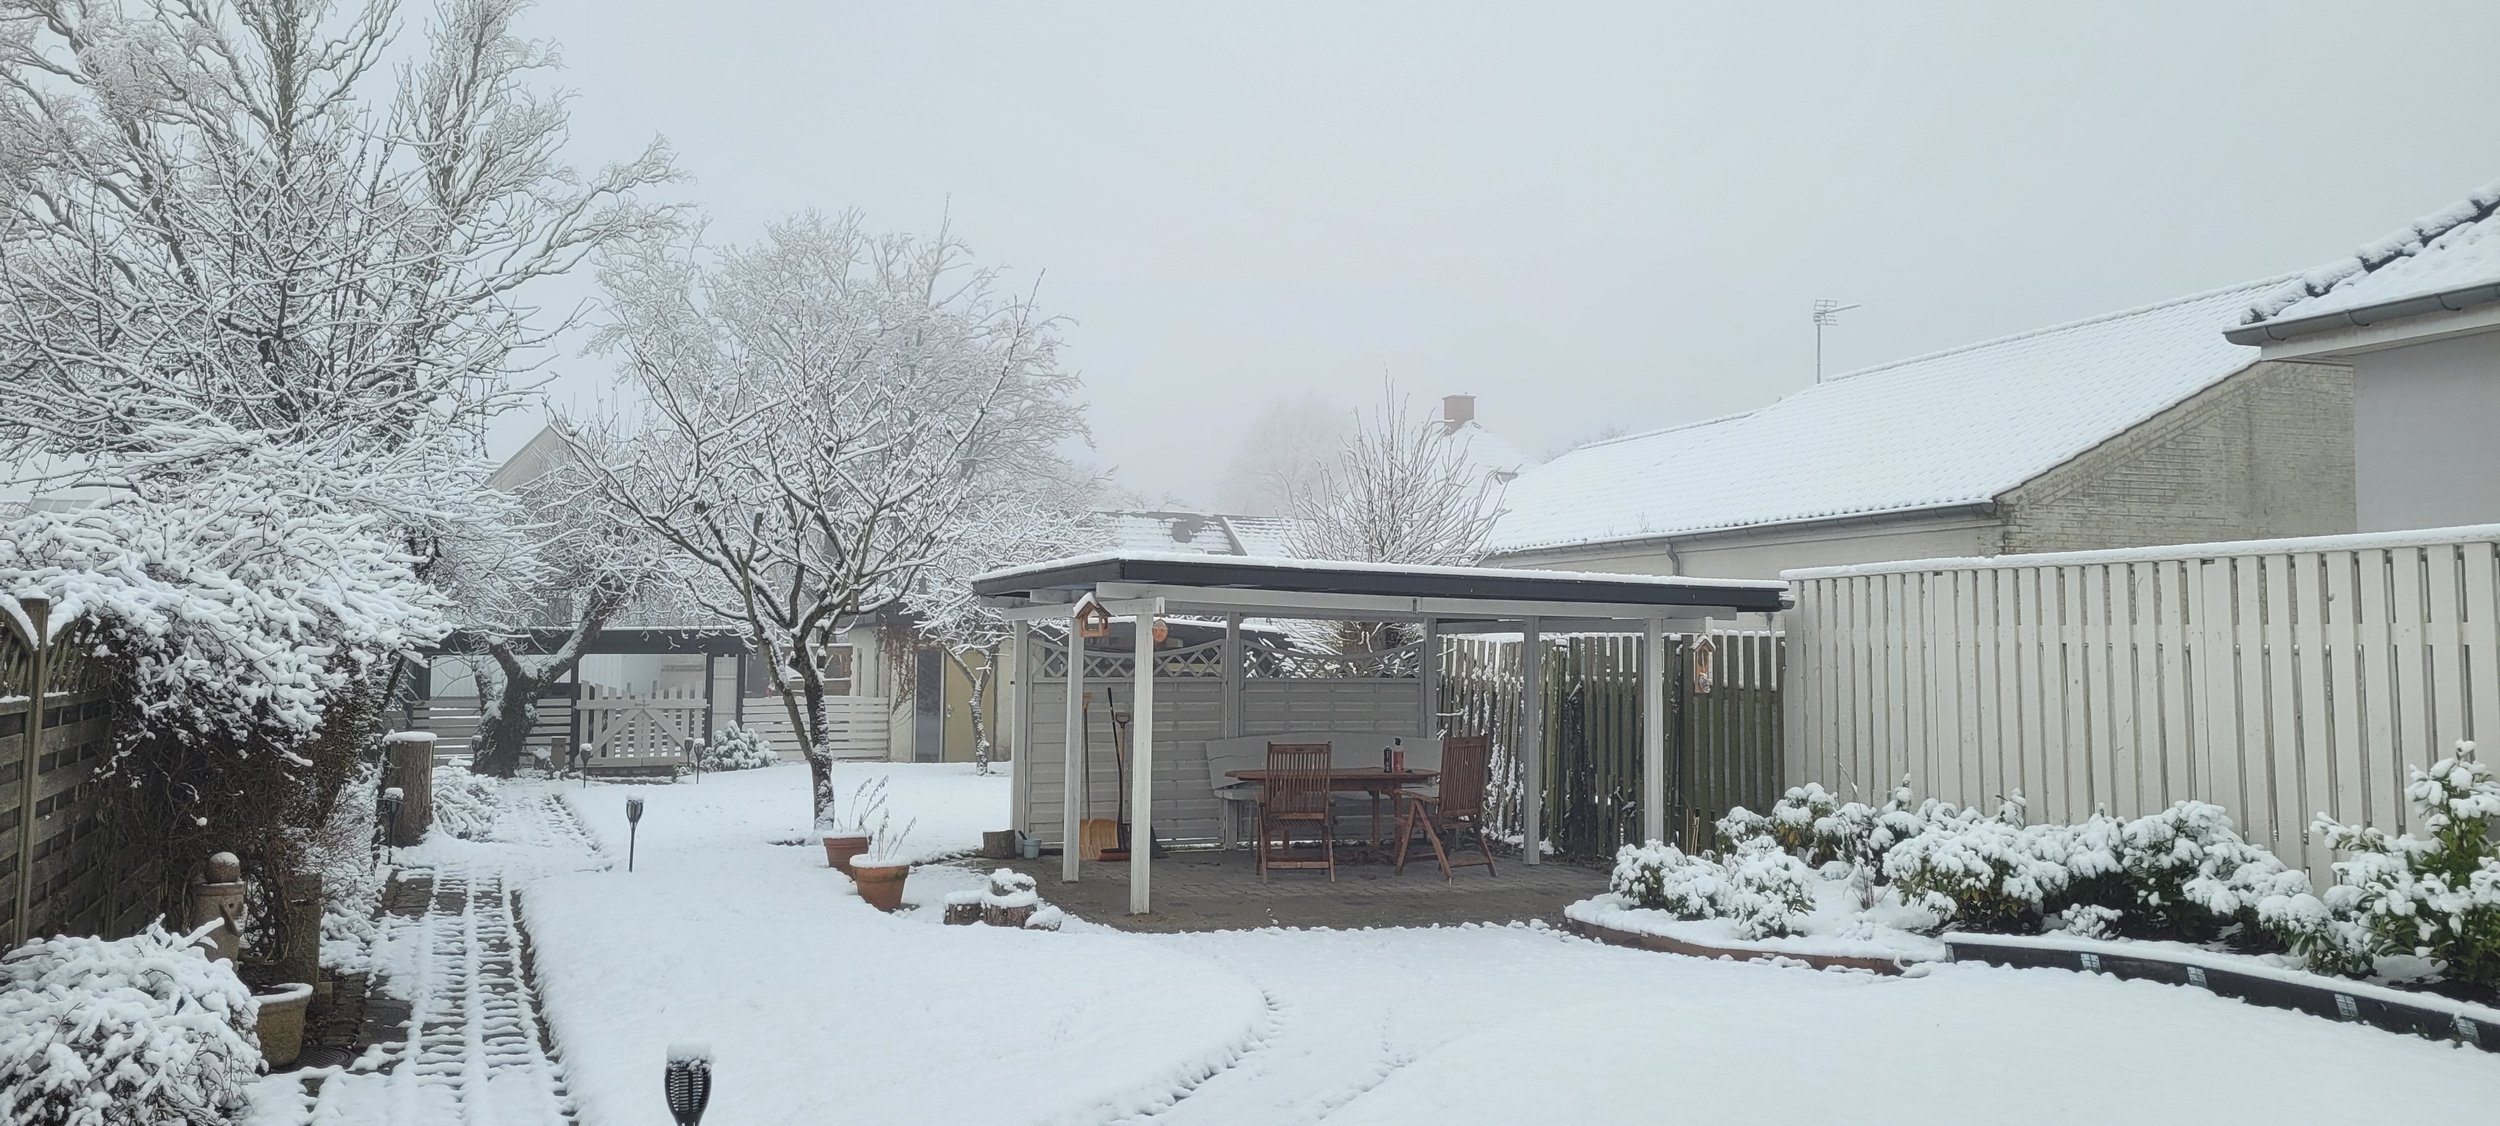
We are incredibly grateful to be living here, and we continually receive affirmations that this move was the right thing, at the right time. We love our house, and the little town it lies at the center of. Typical winter evenings involve firing up the wood stove with some of the beech firewood we purchased. 

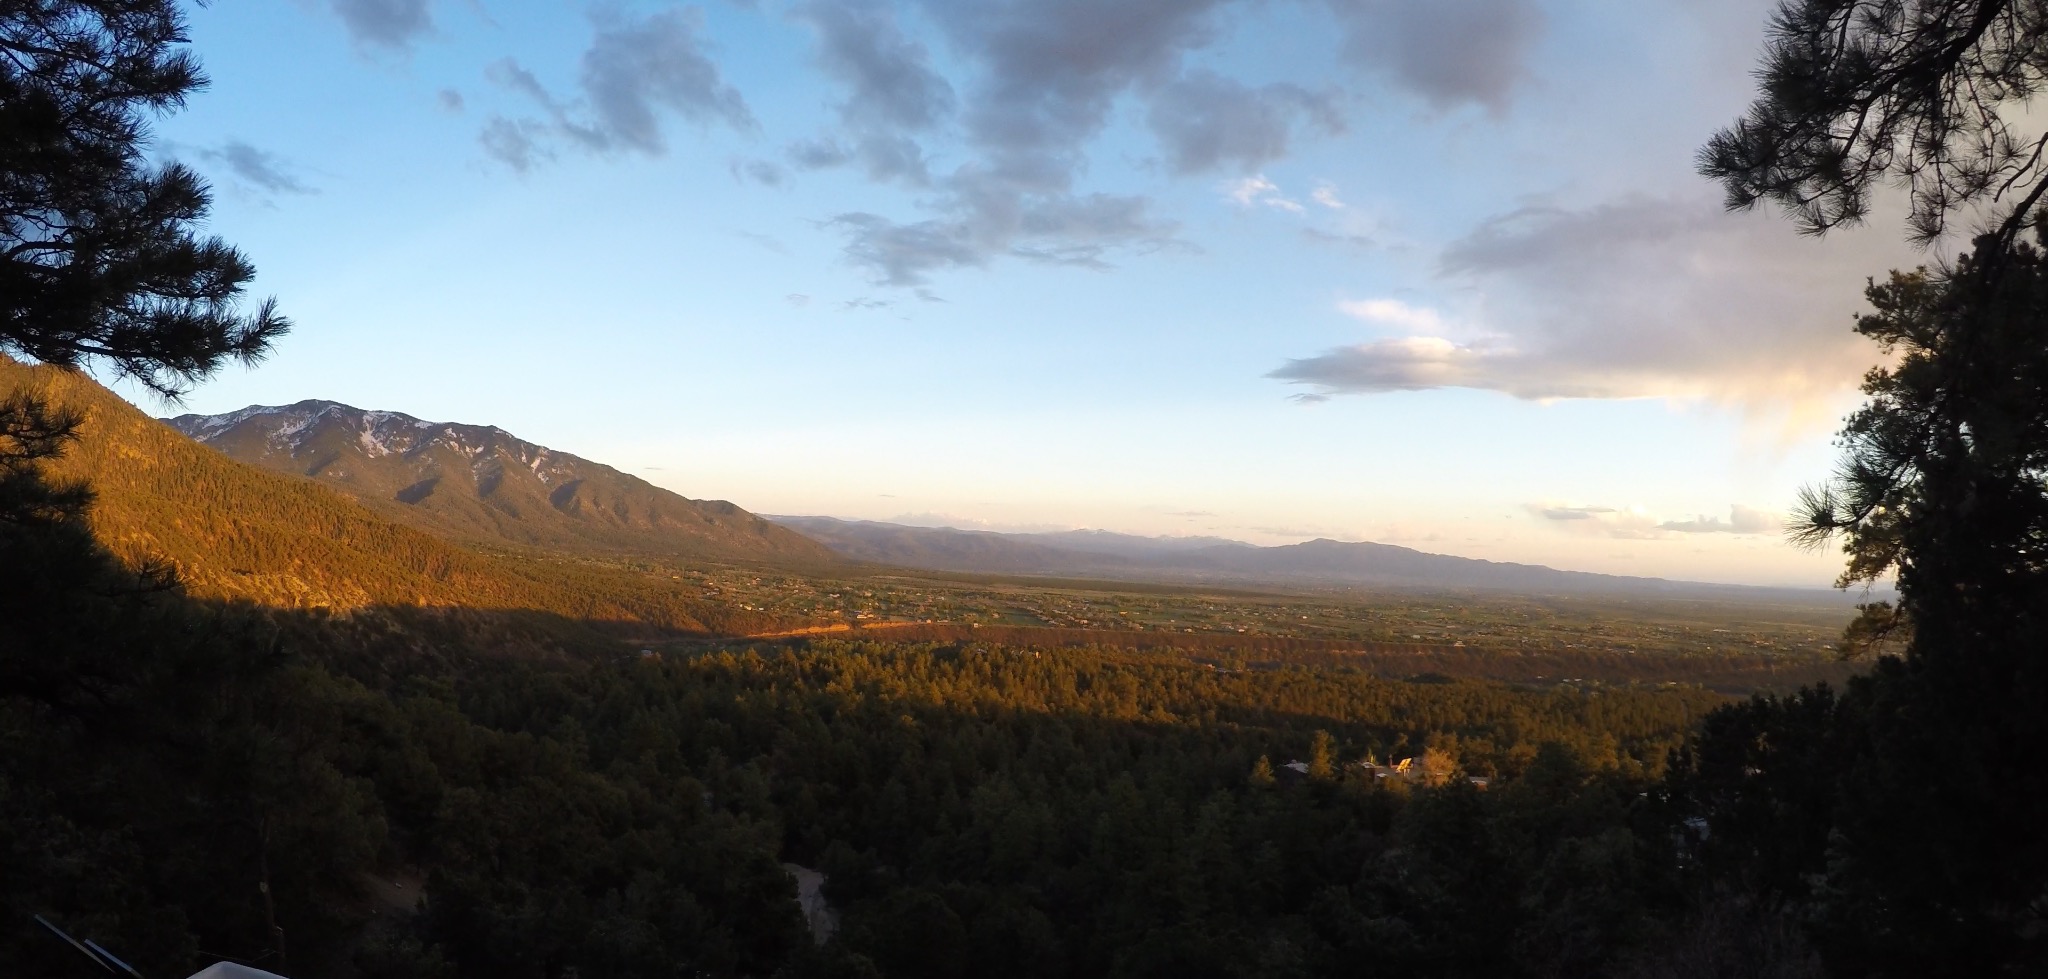
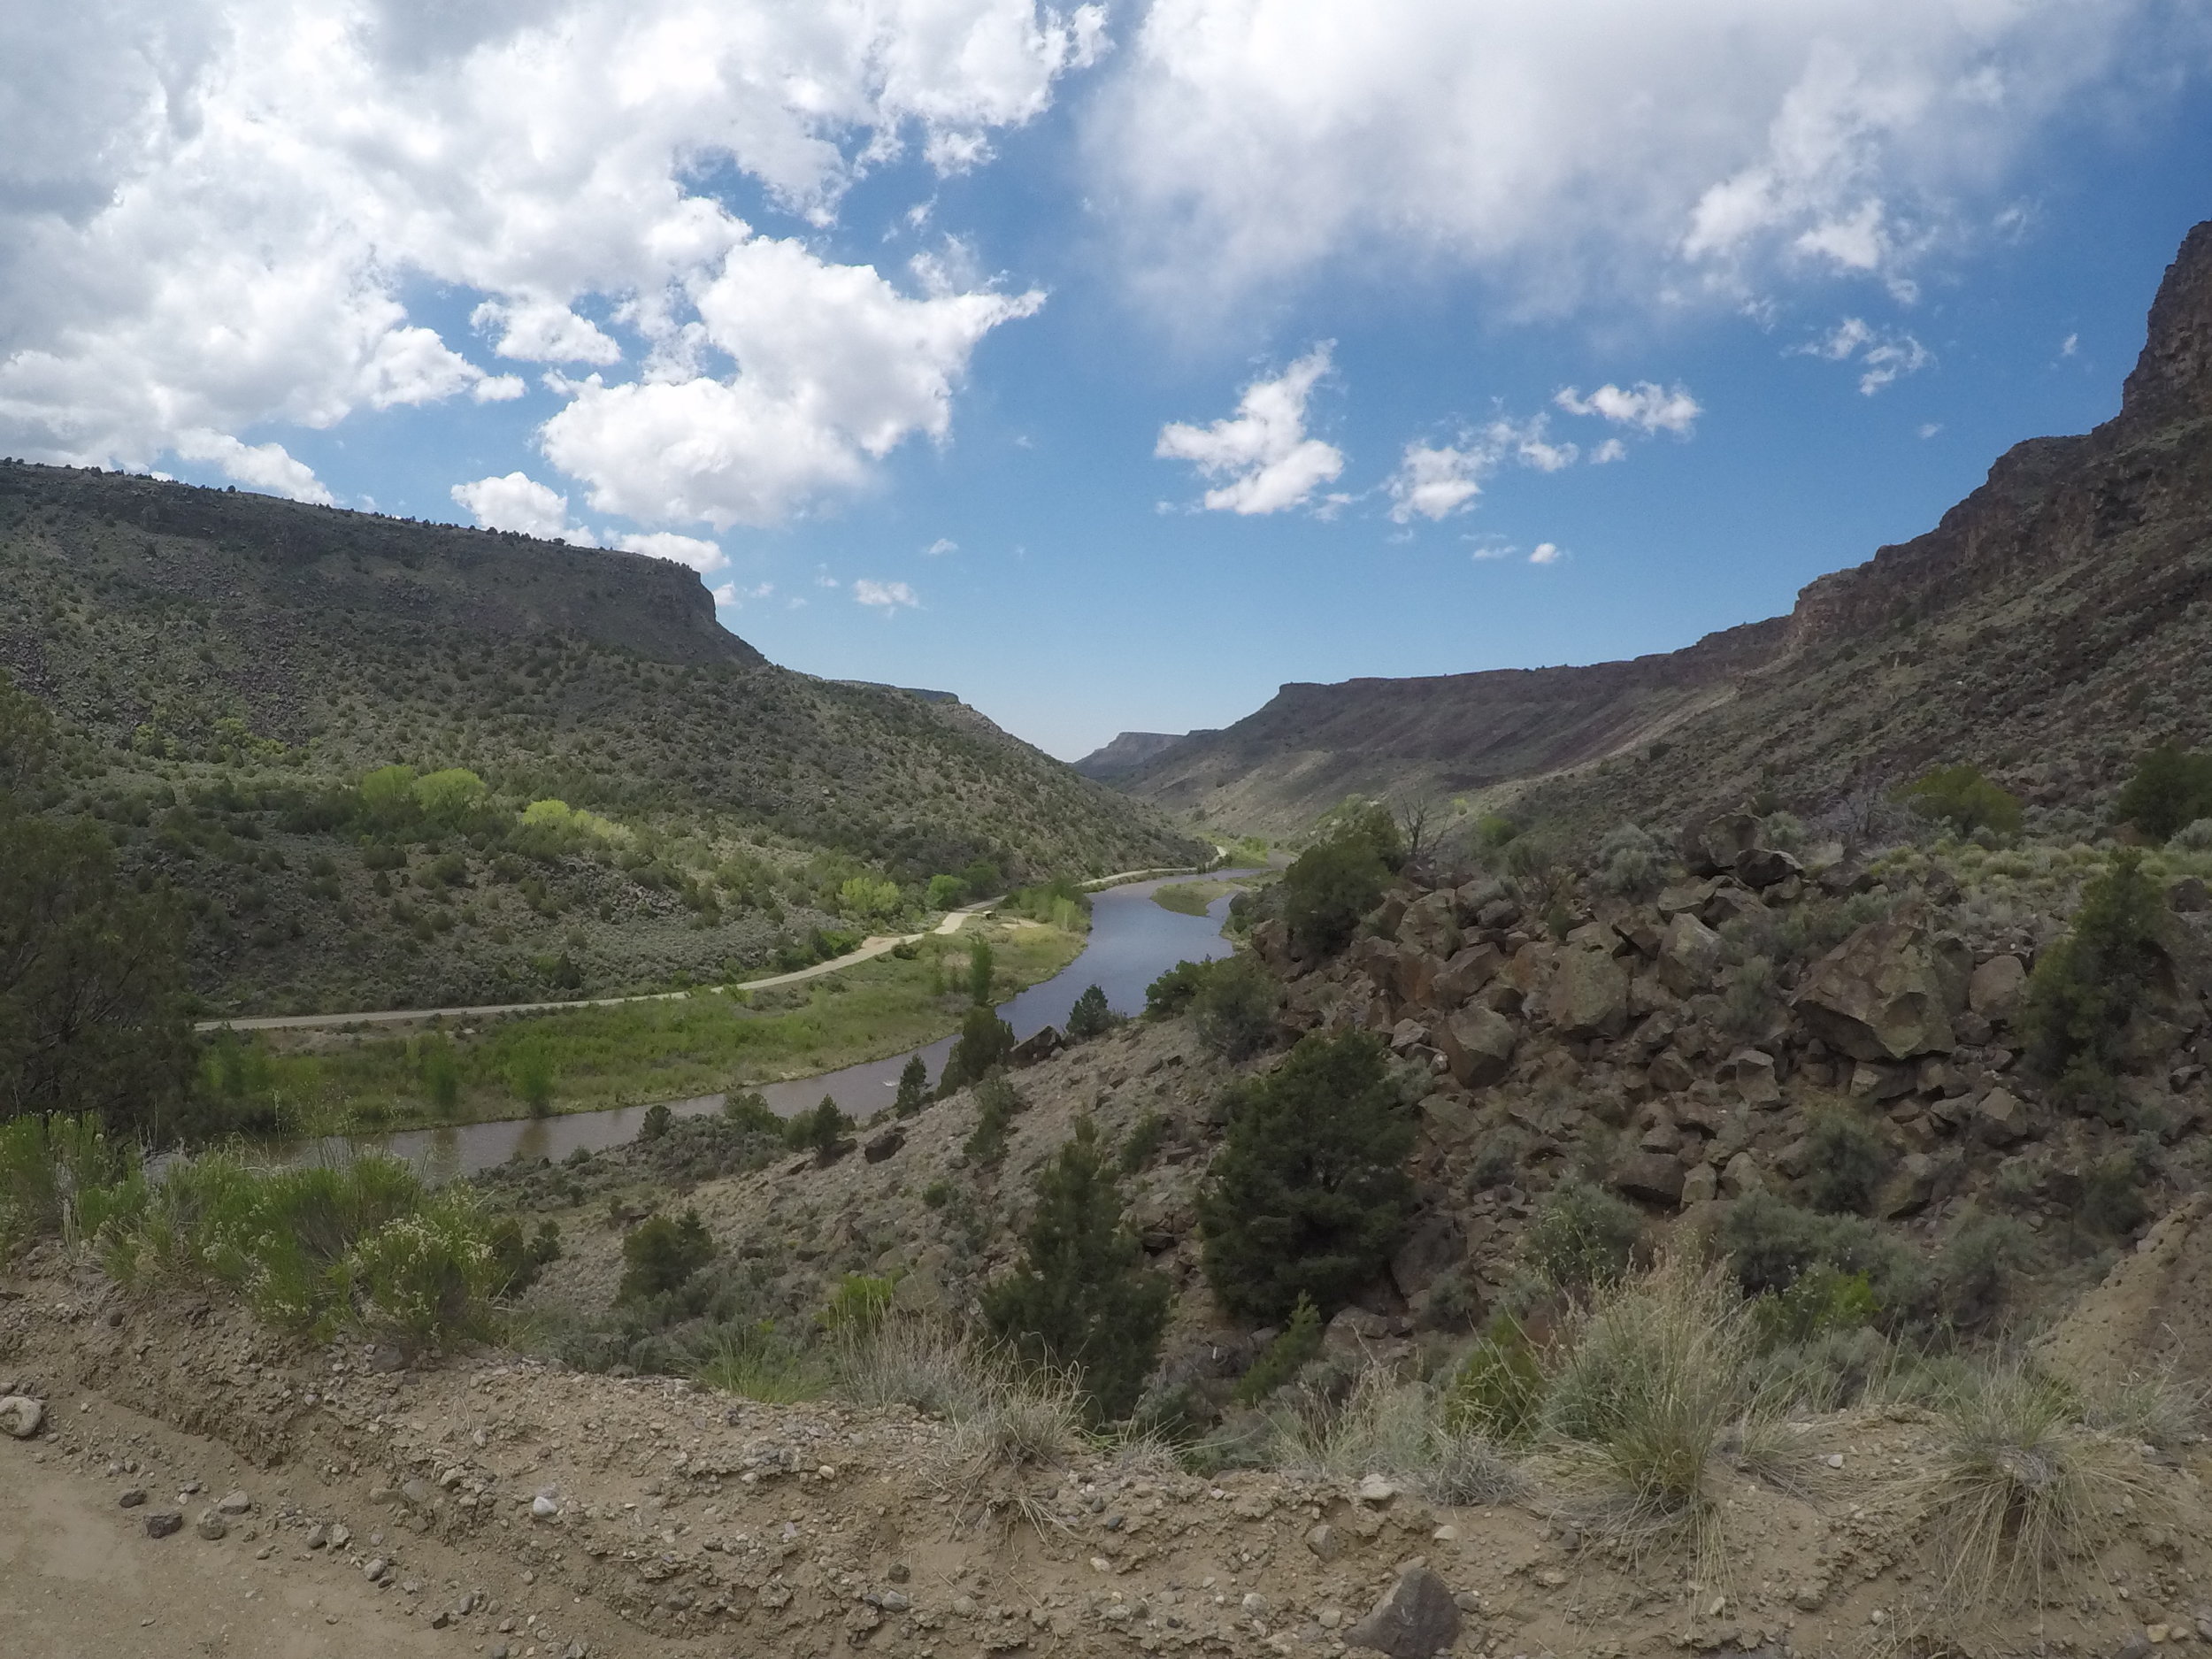
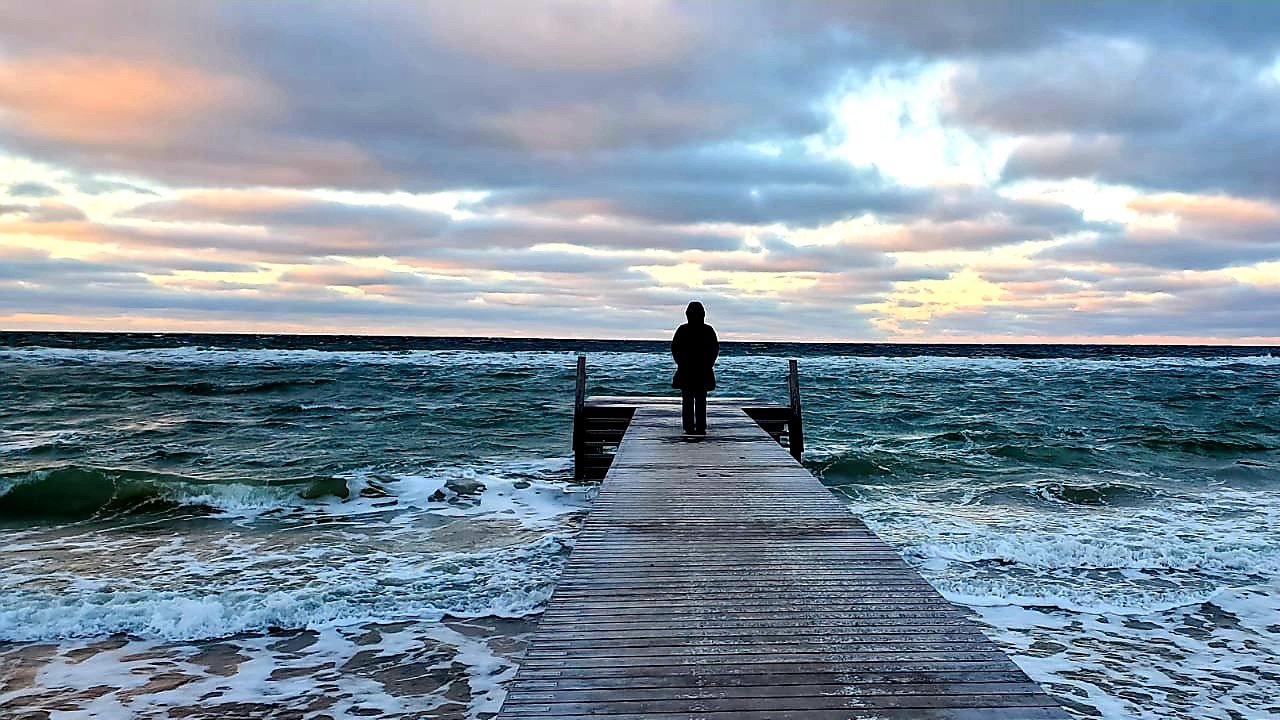
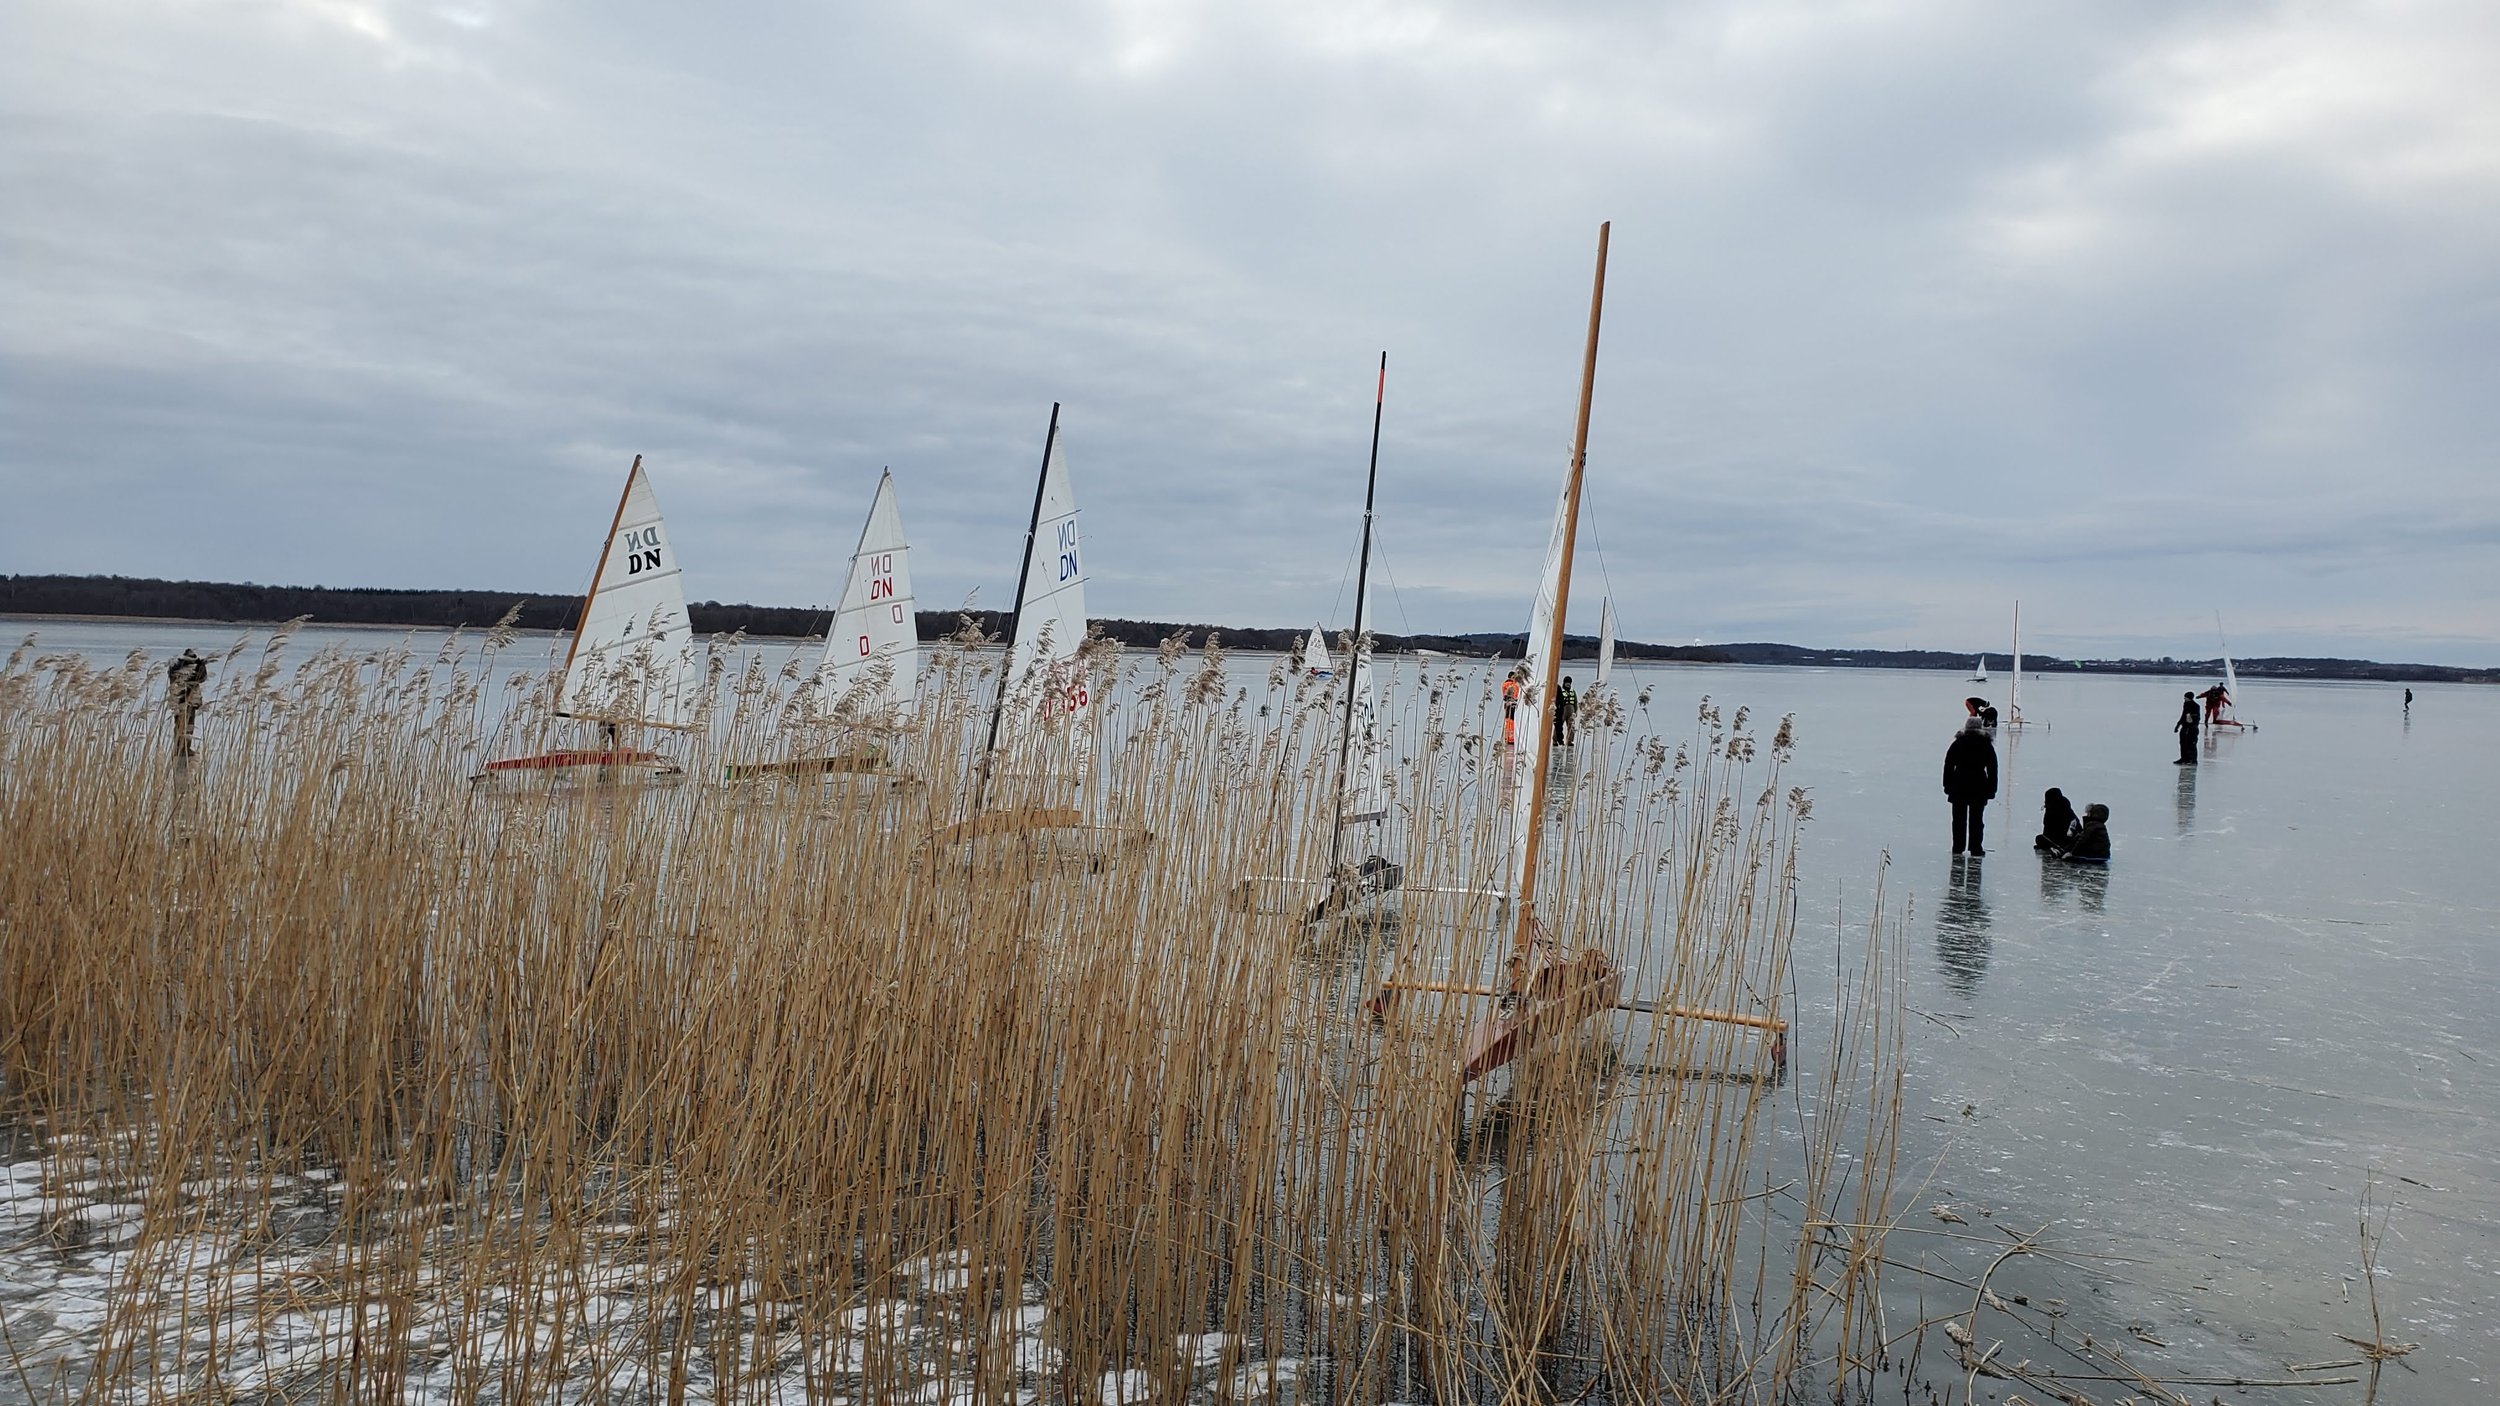
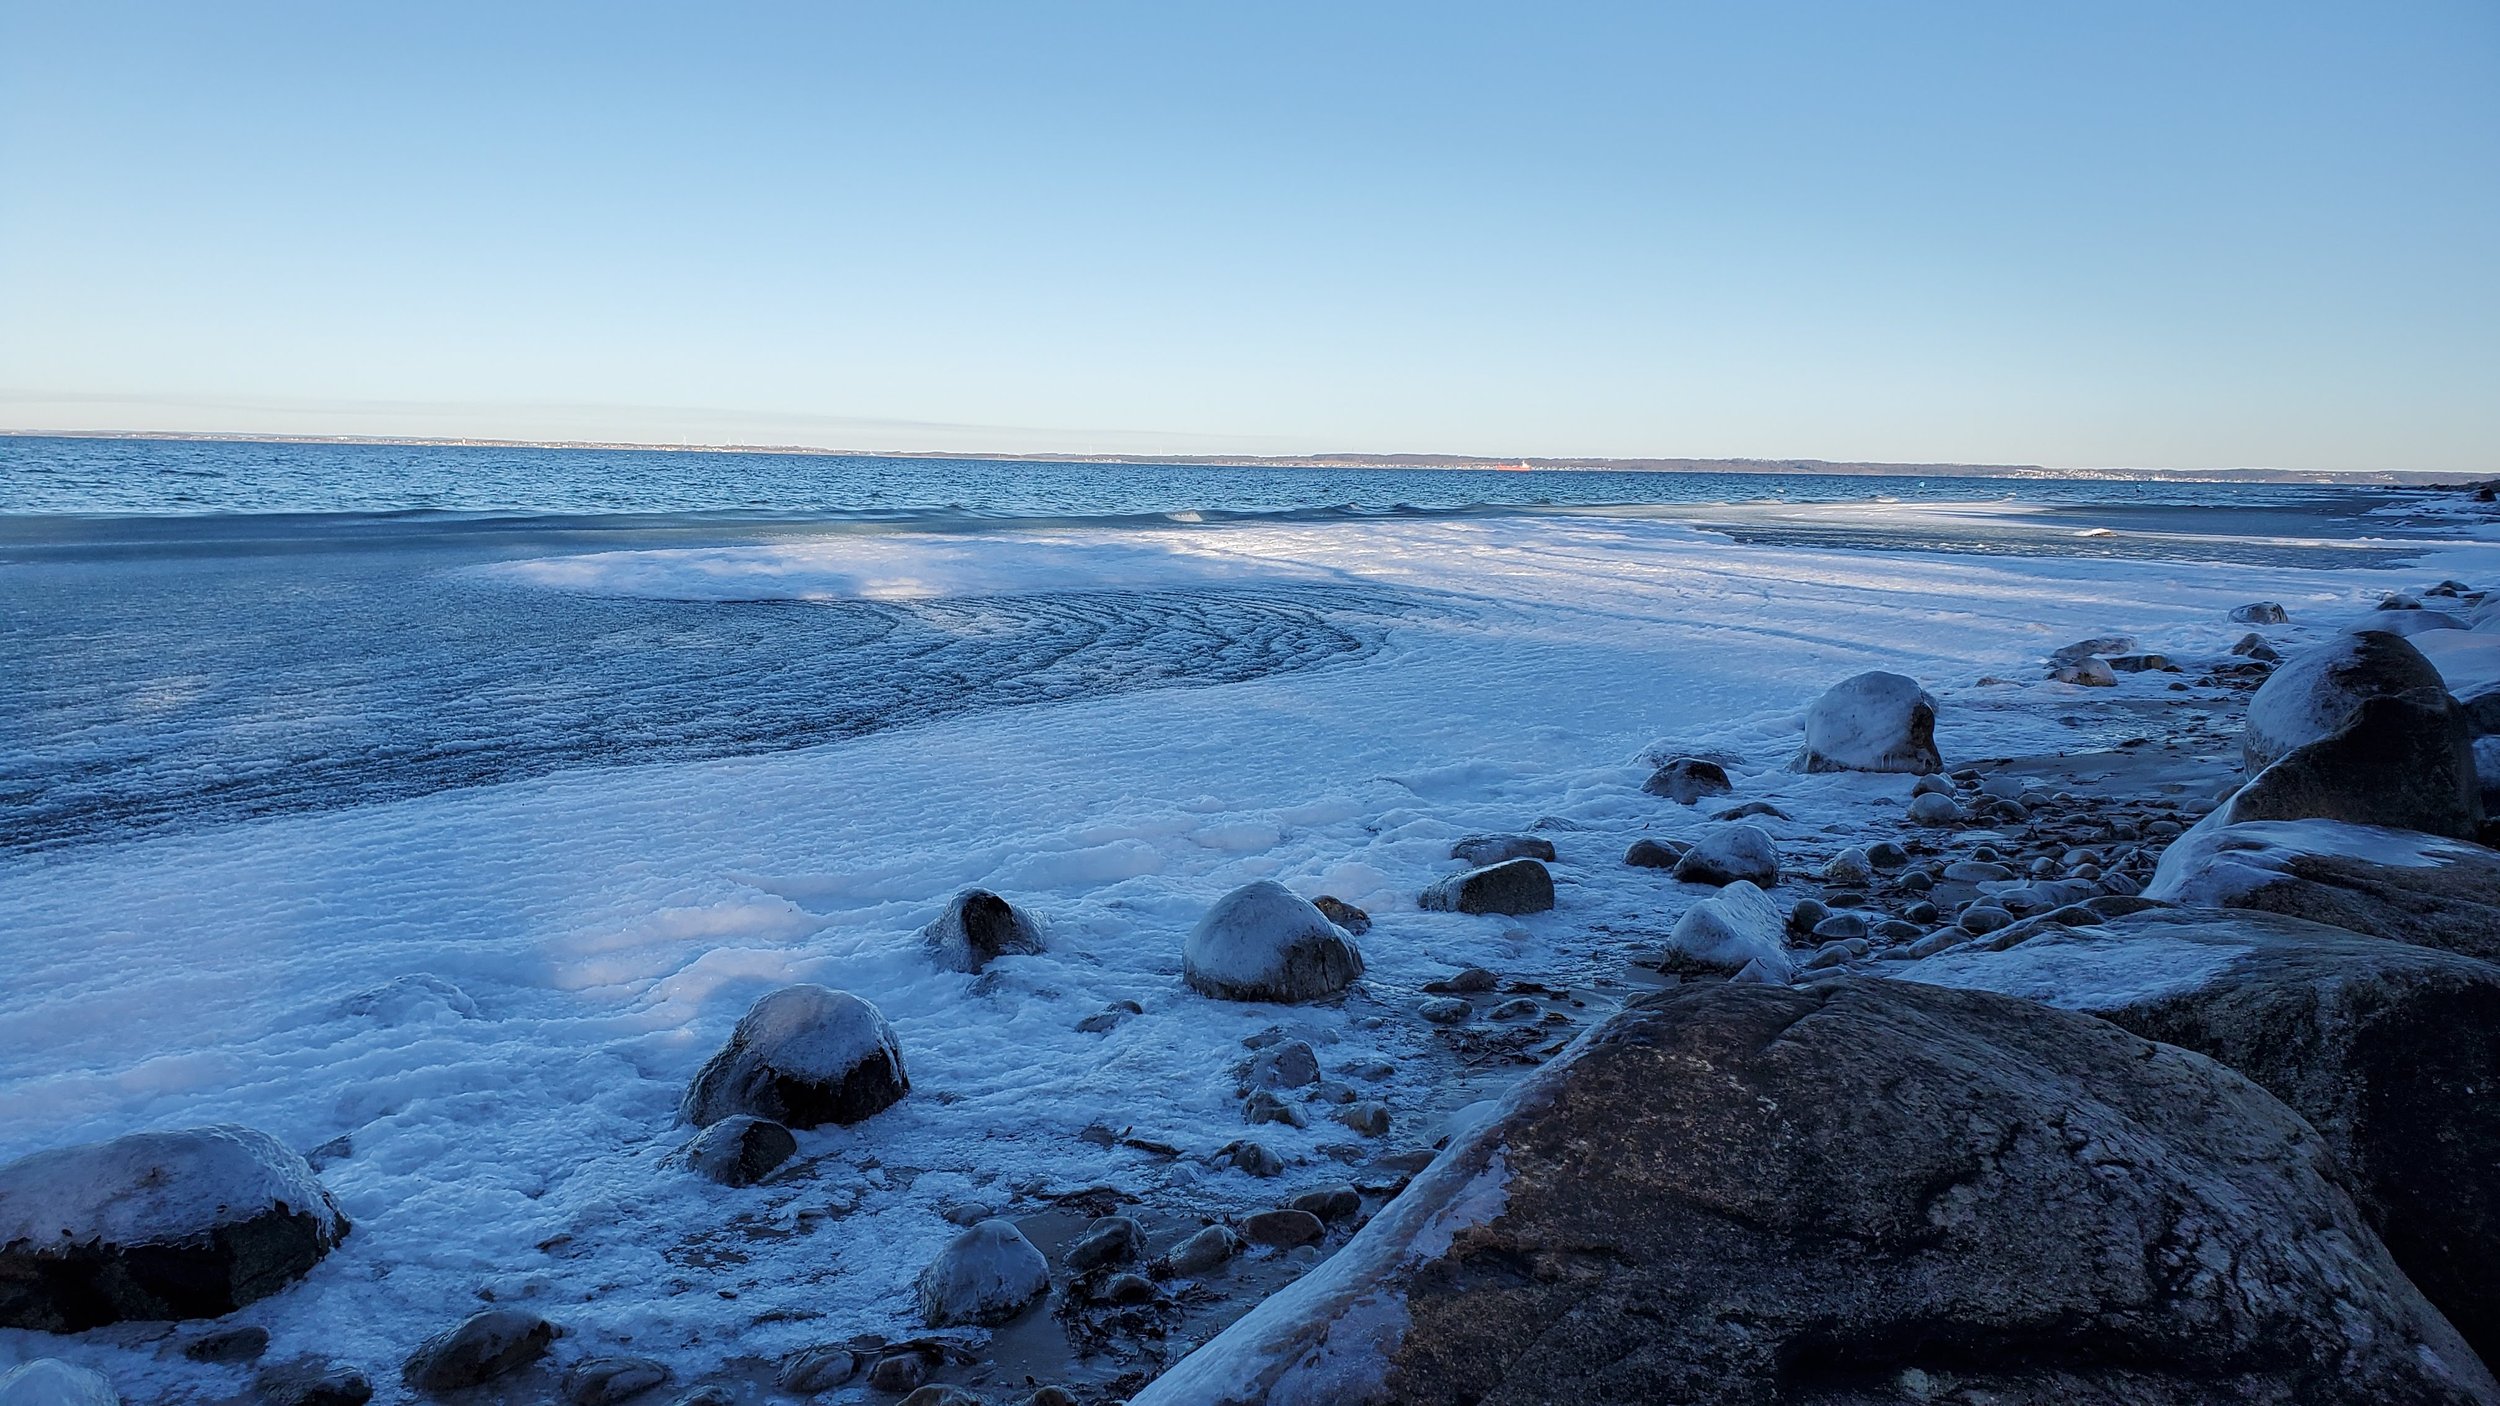
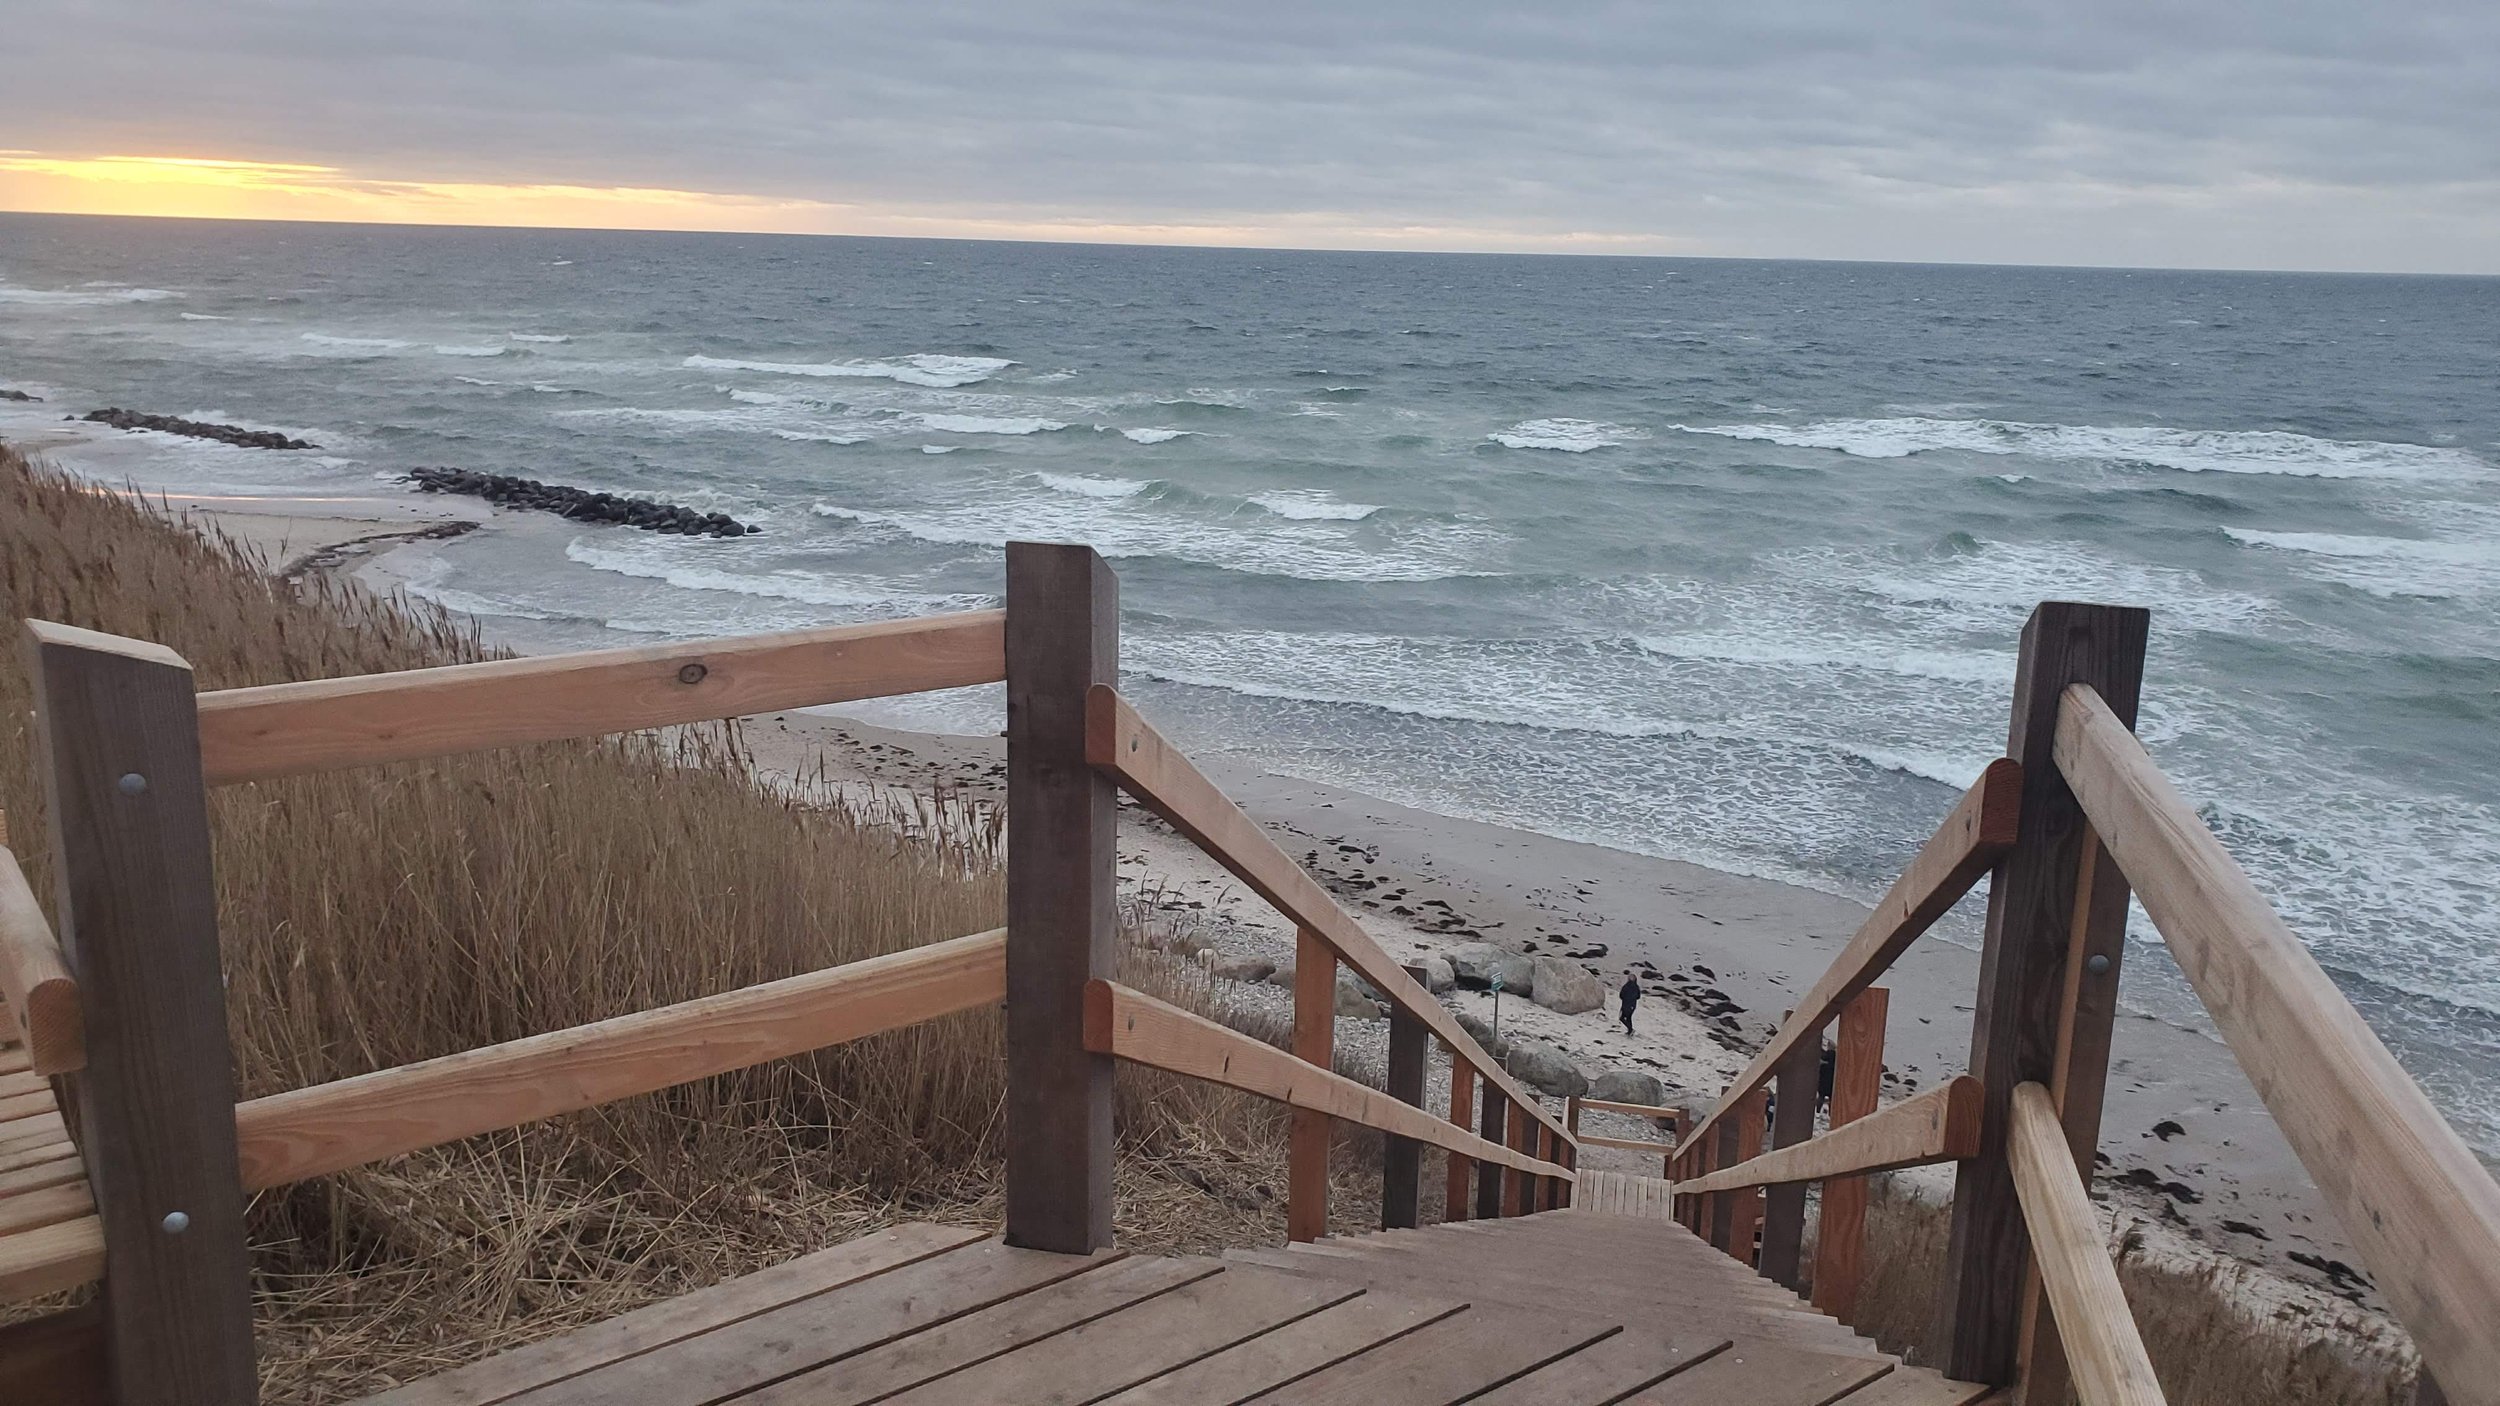
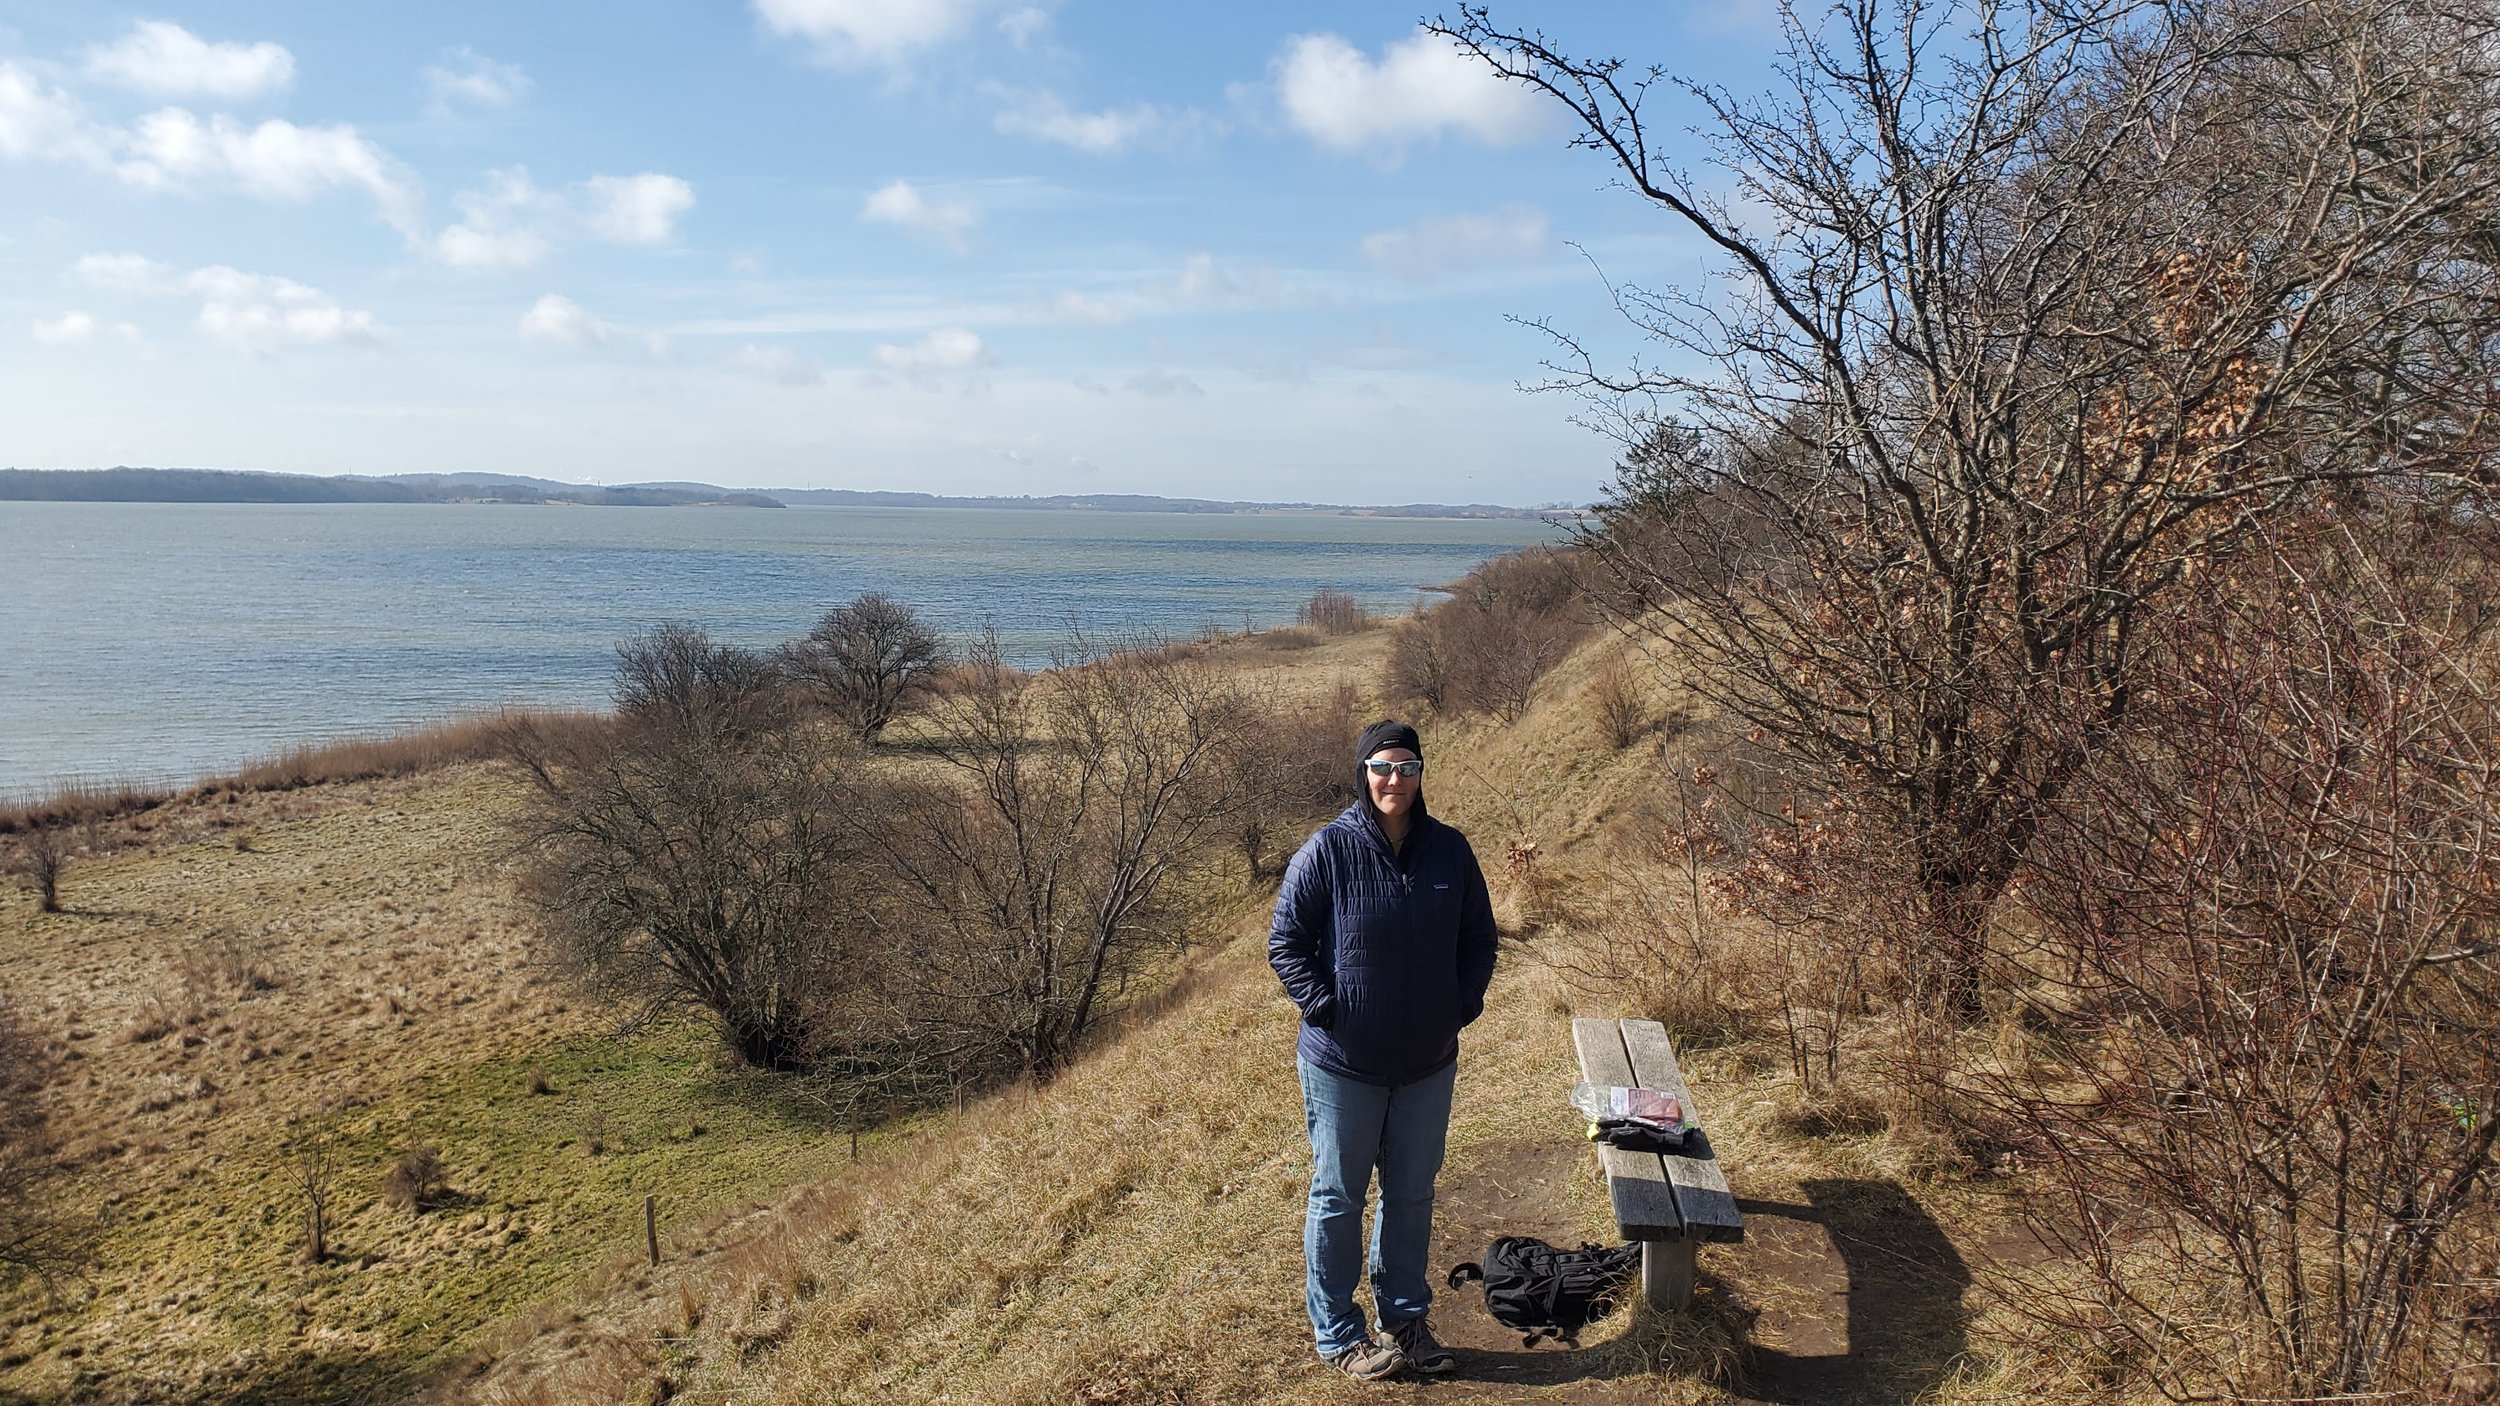
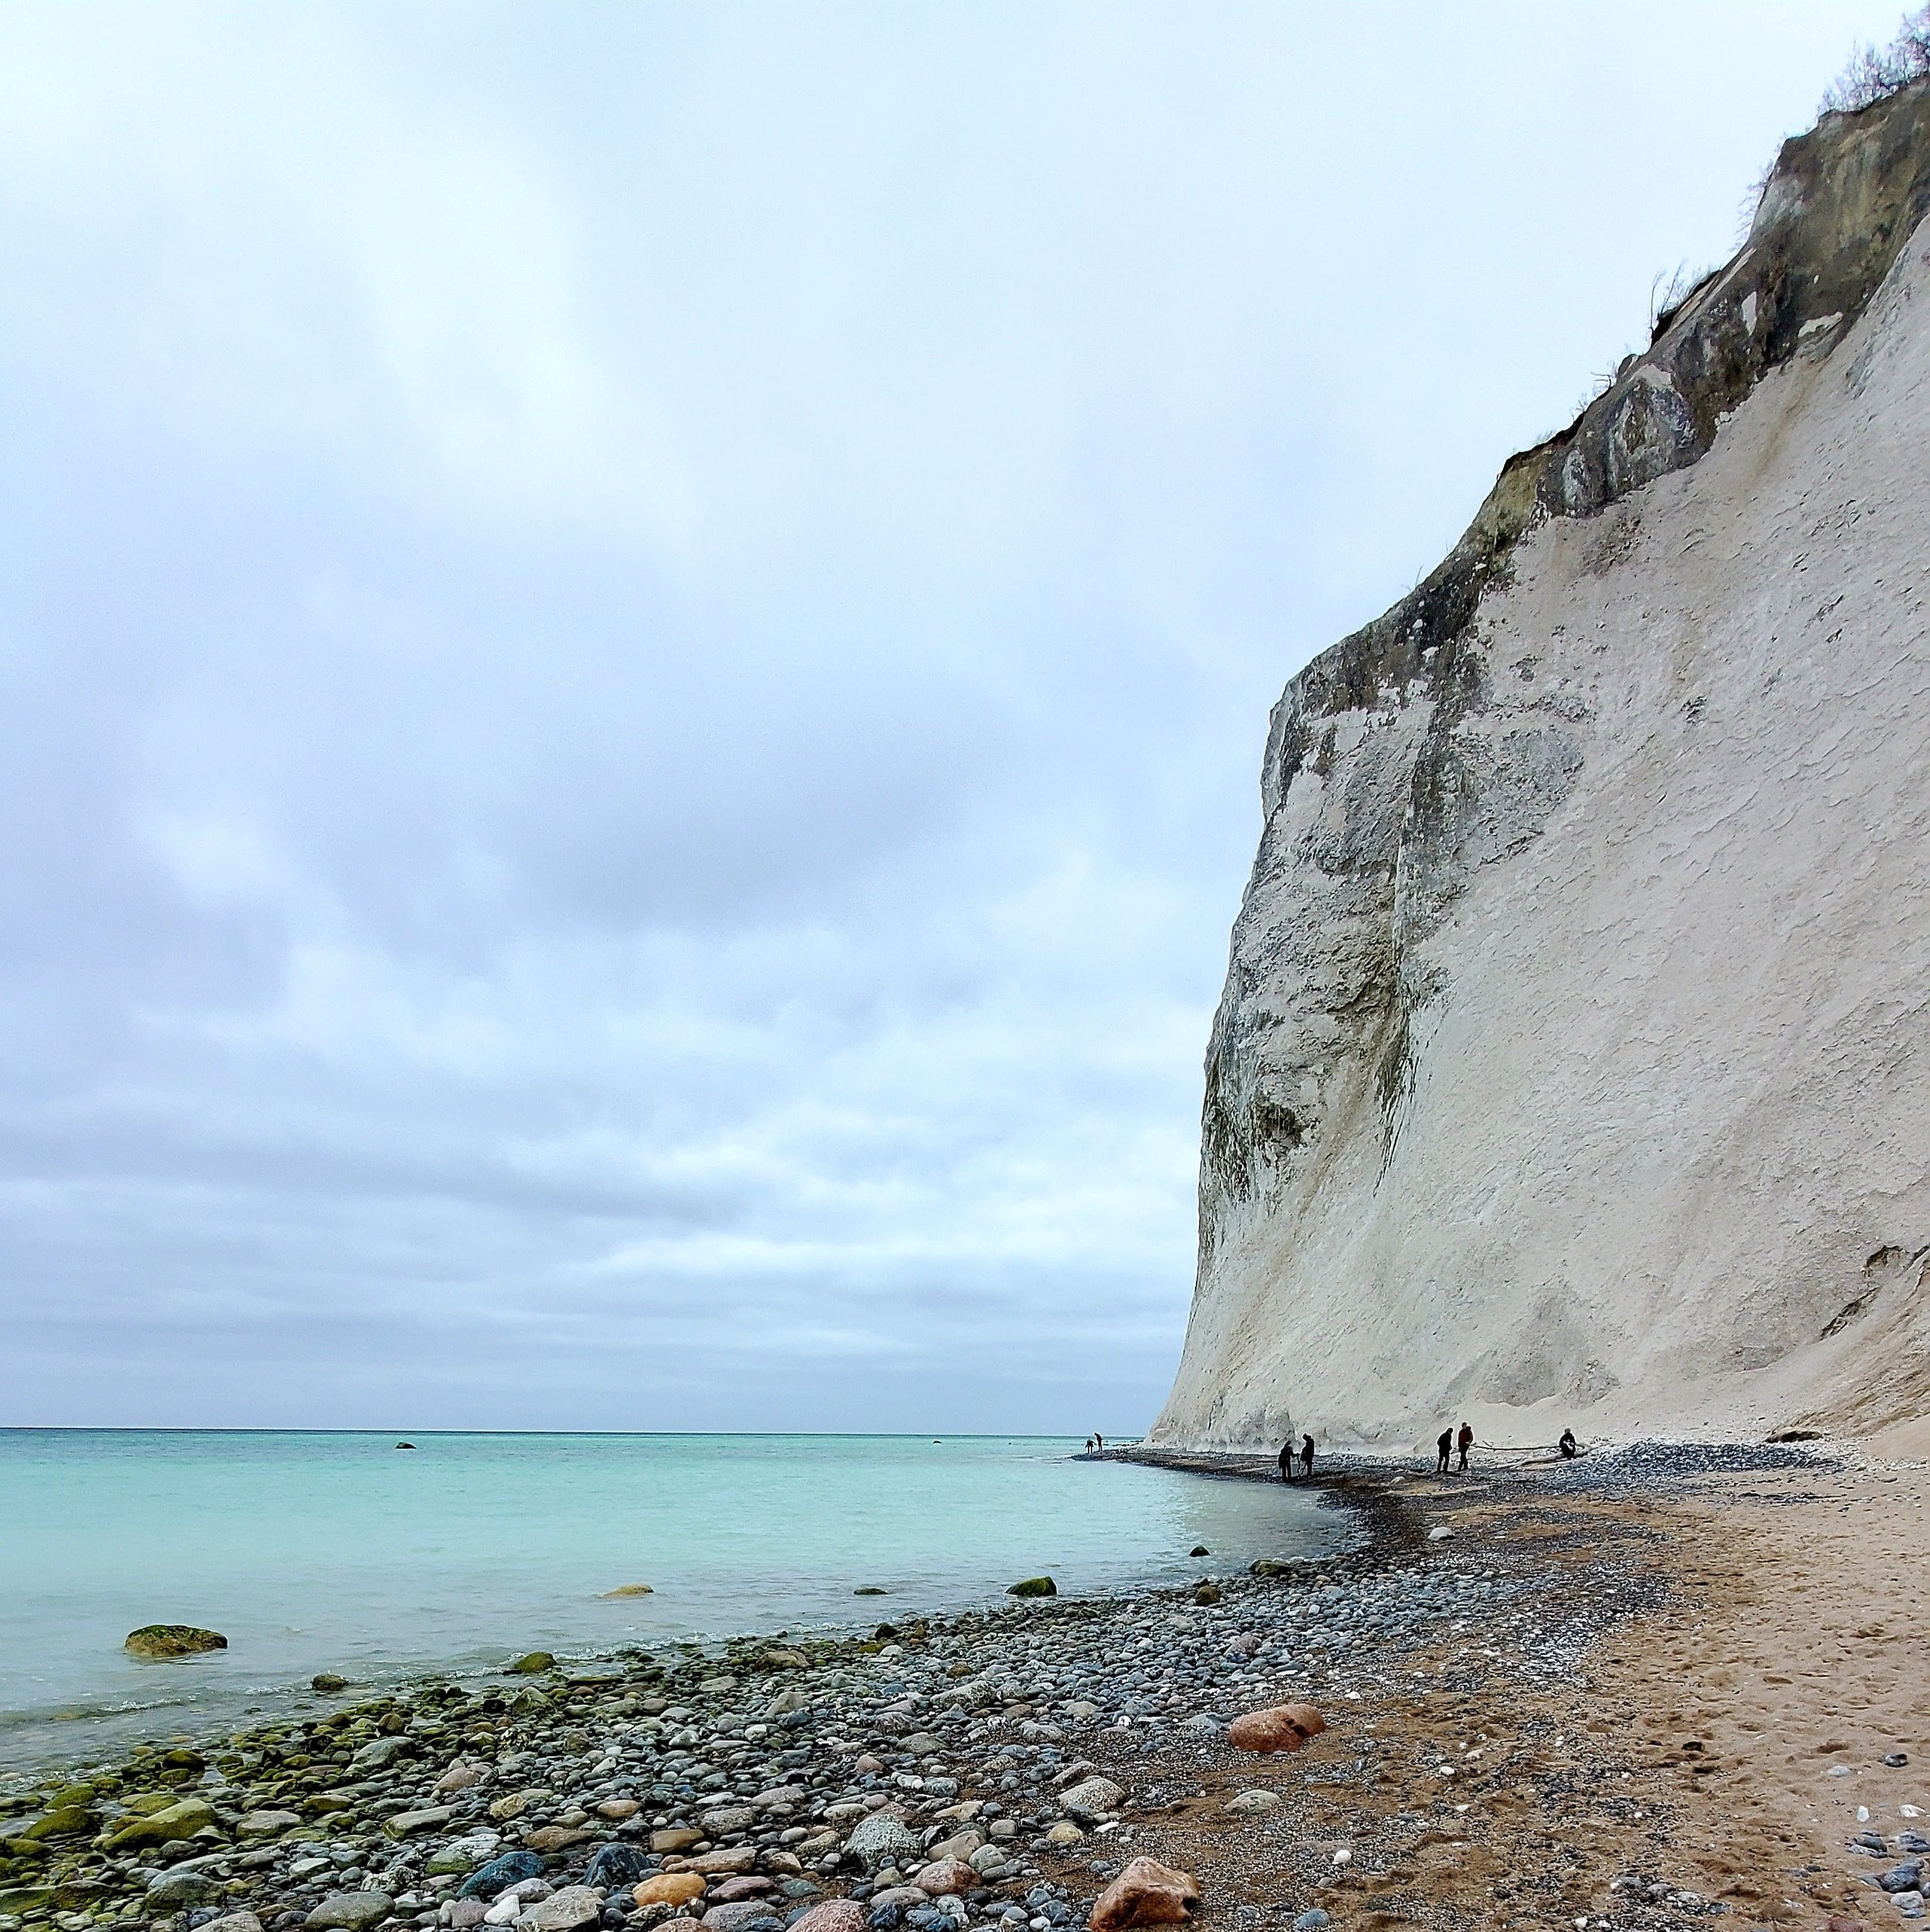
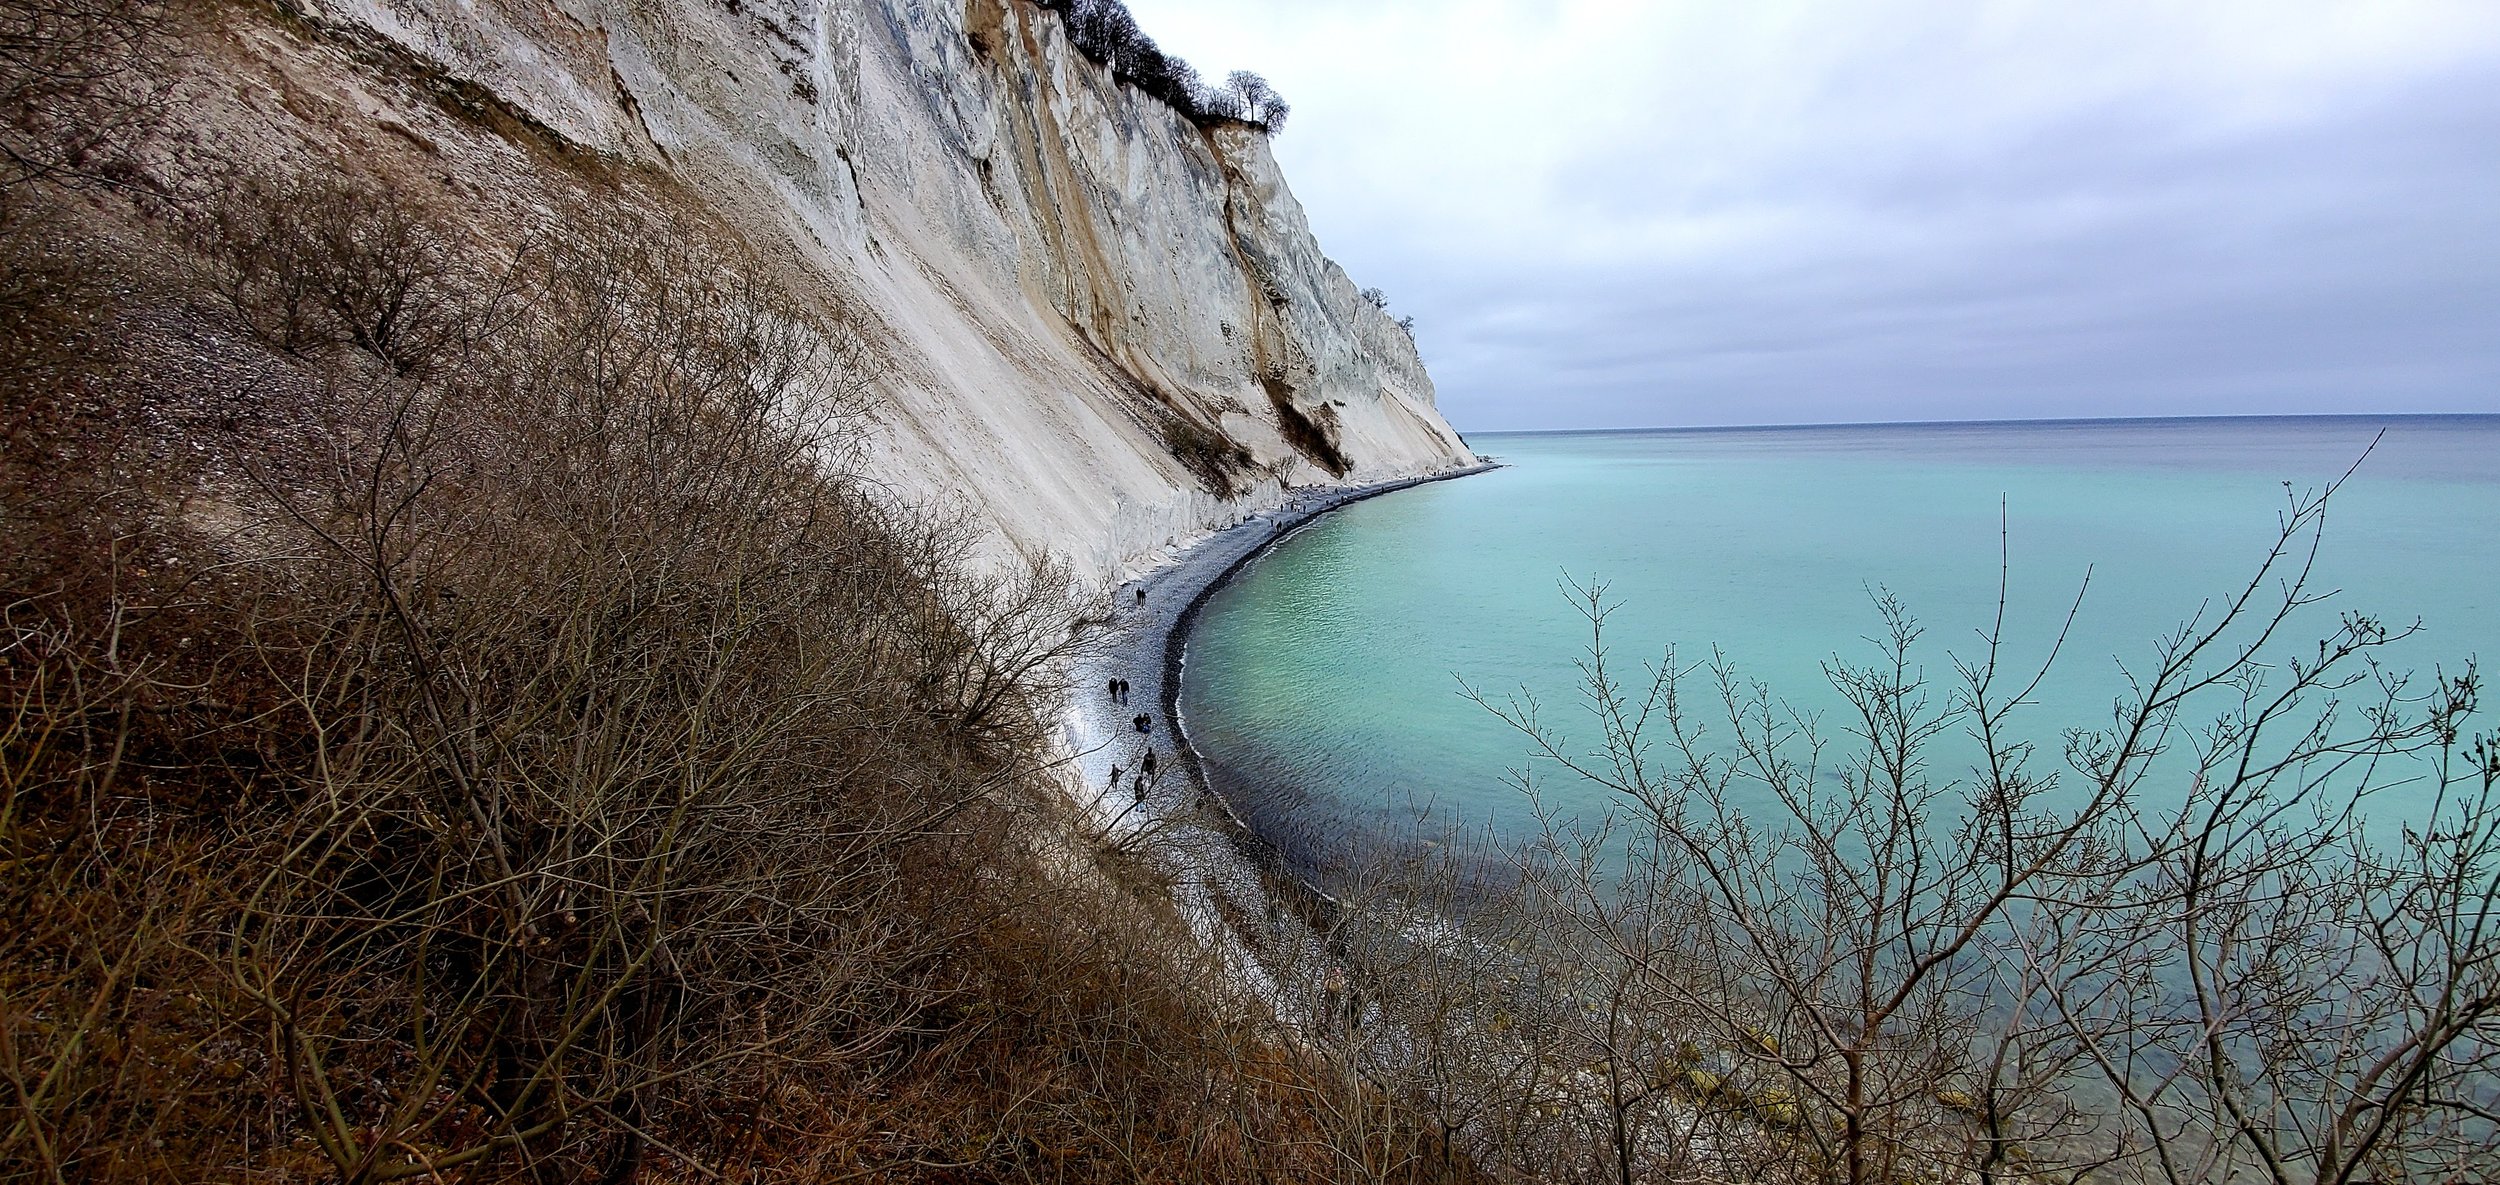
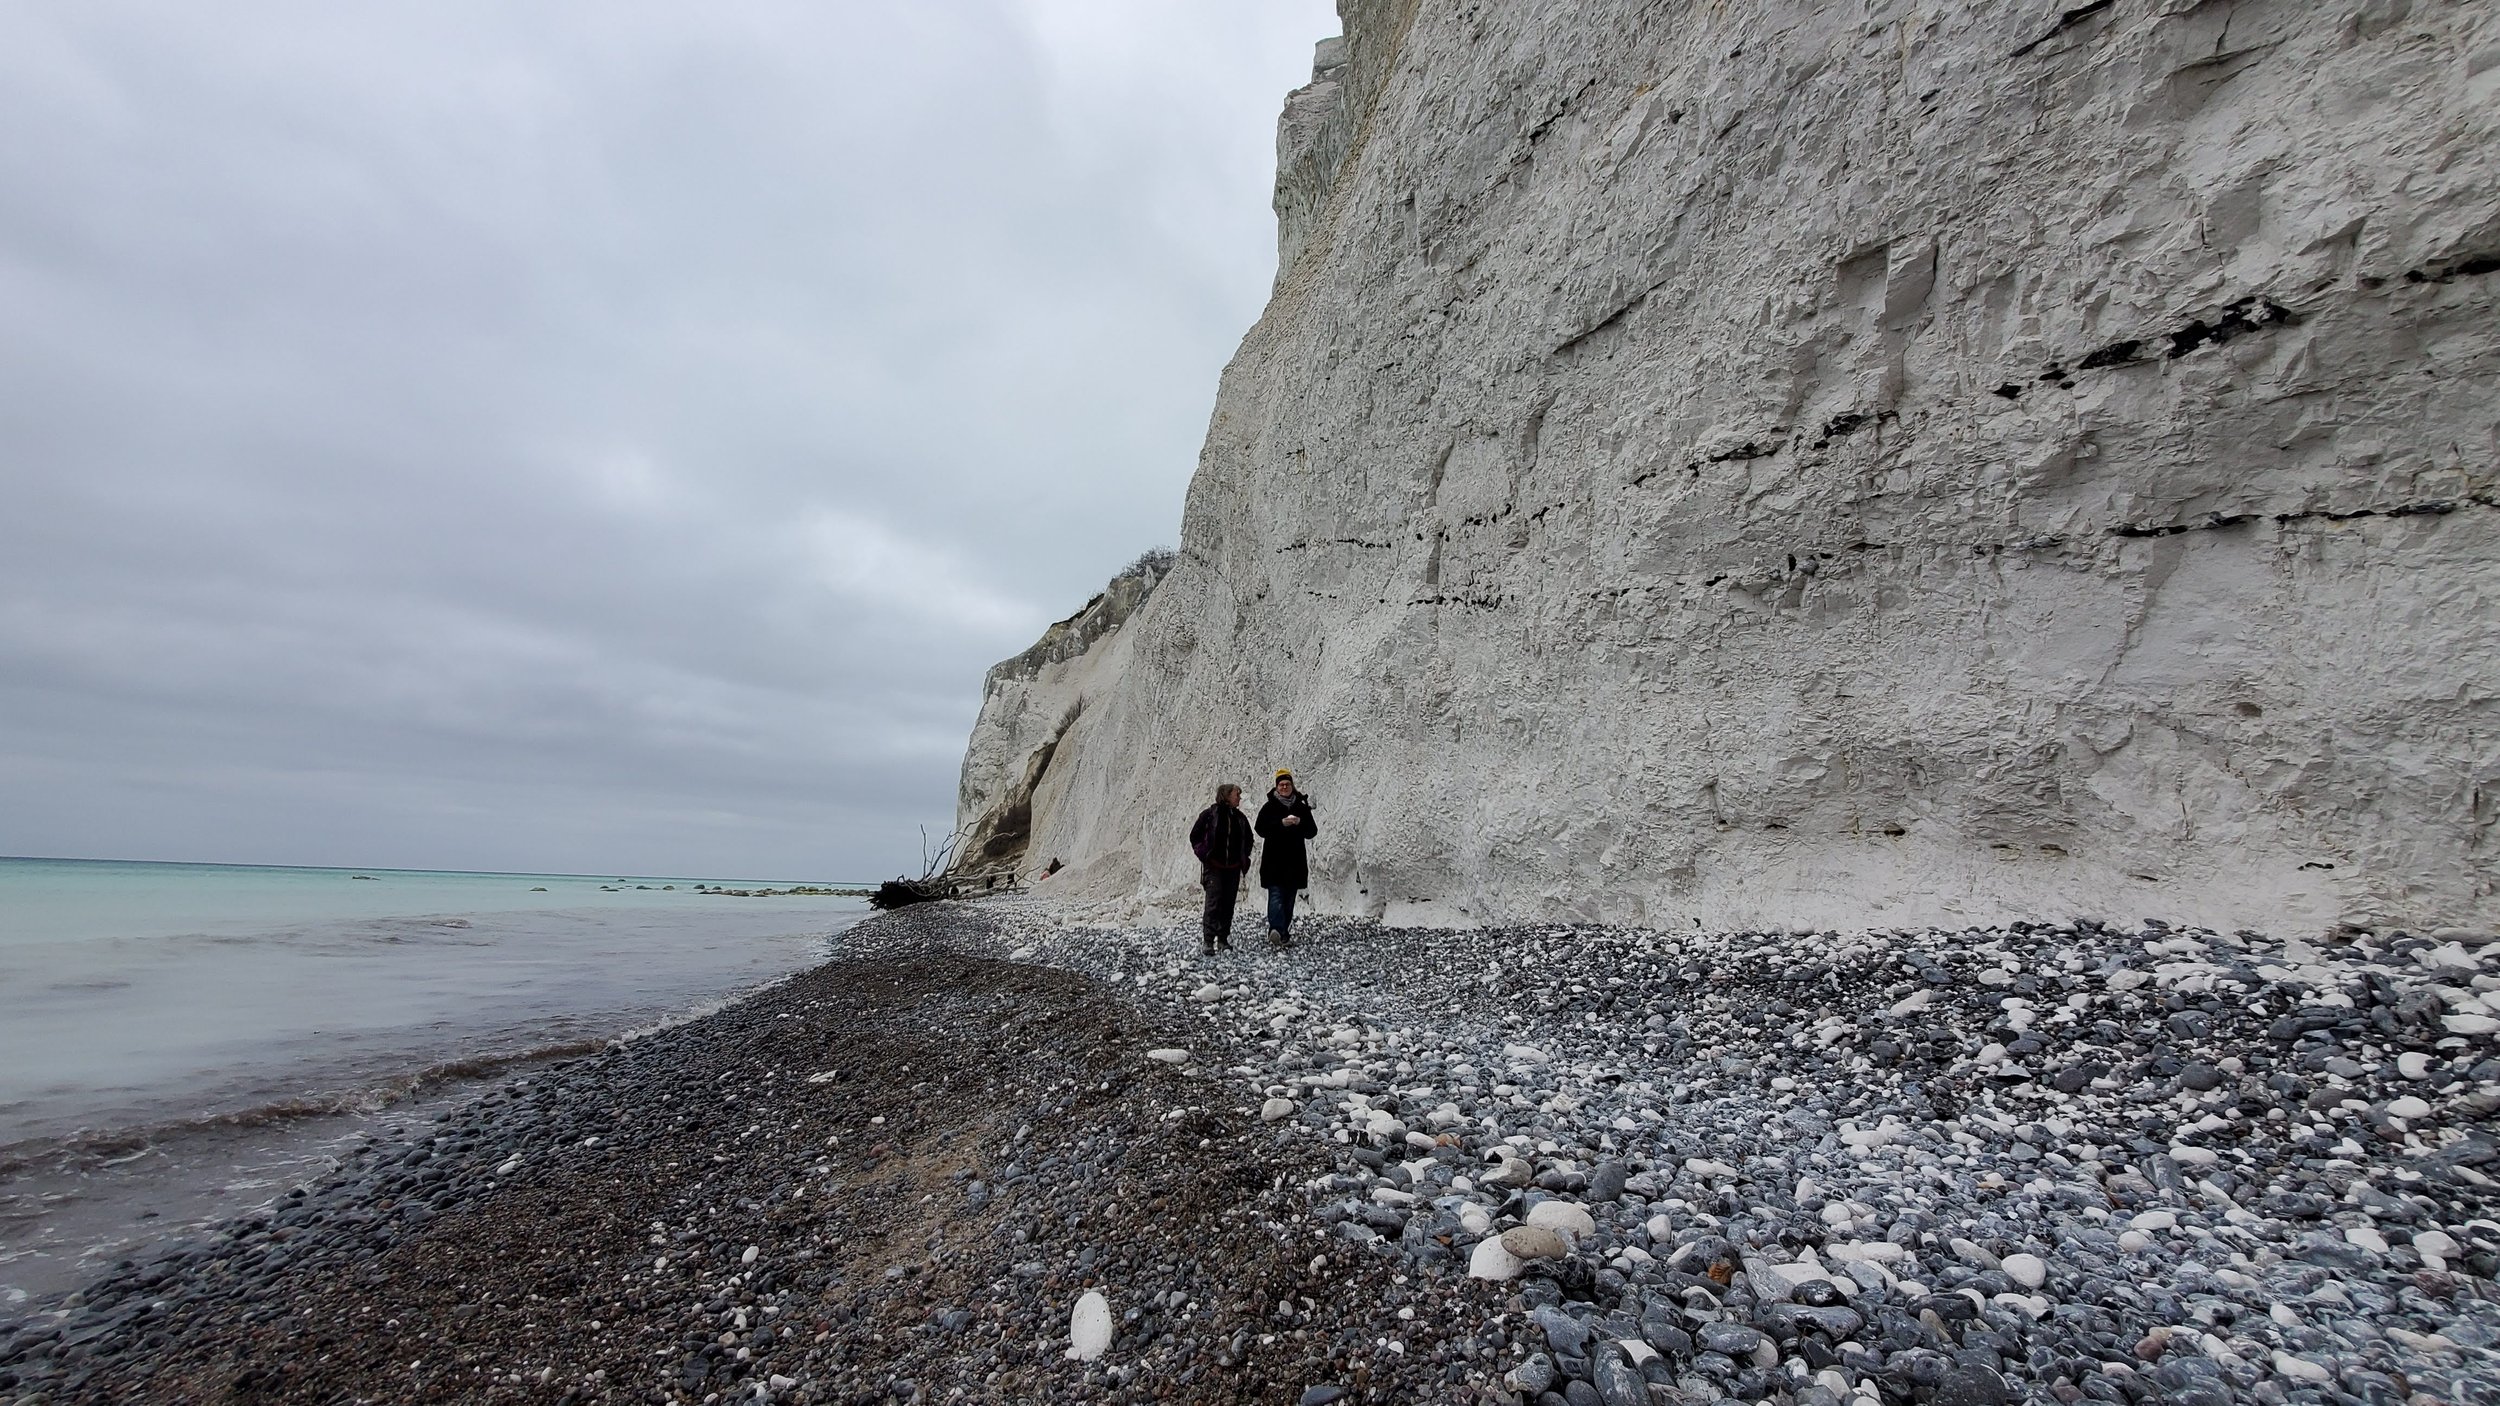
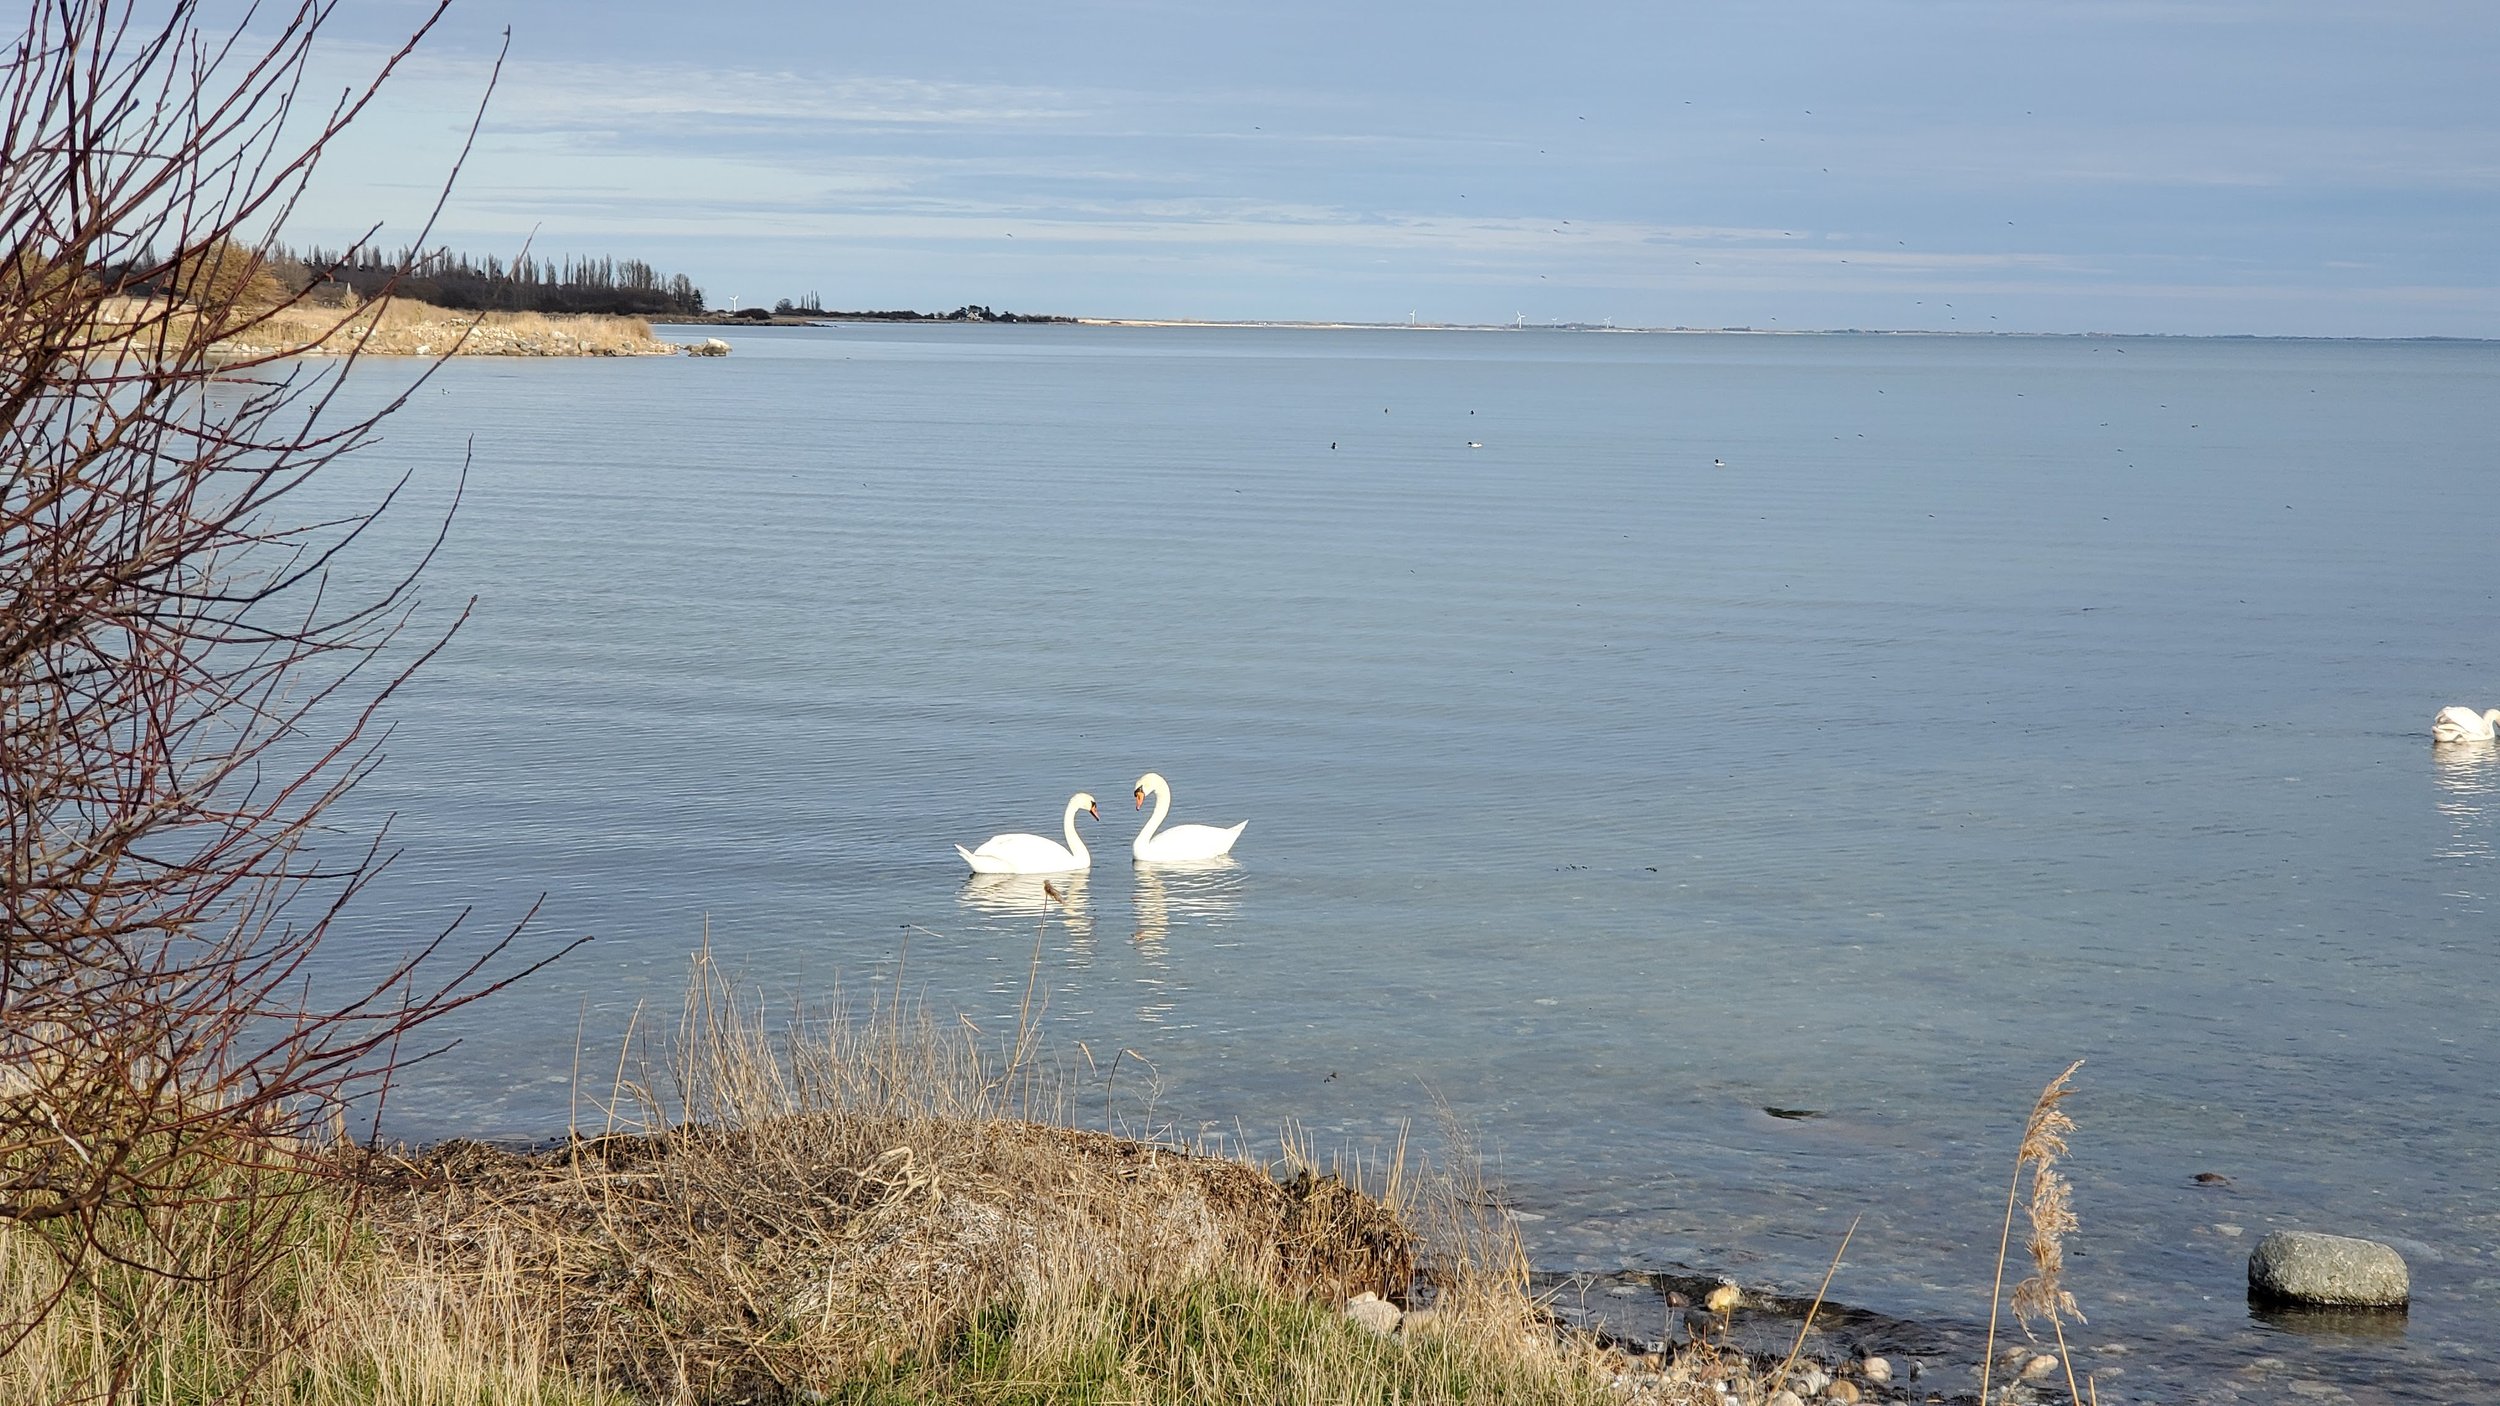
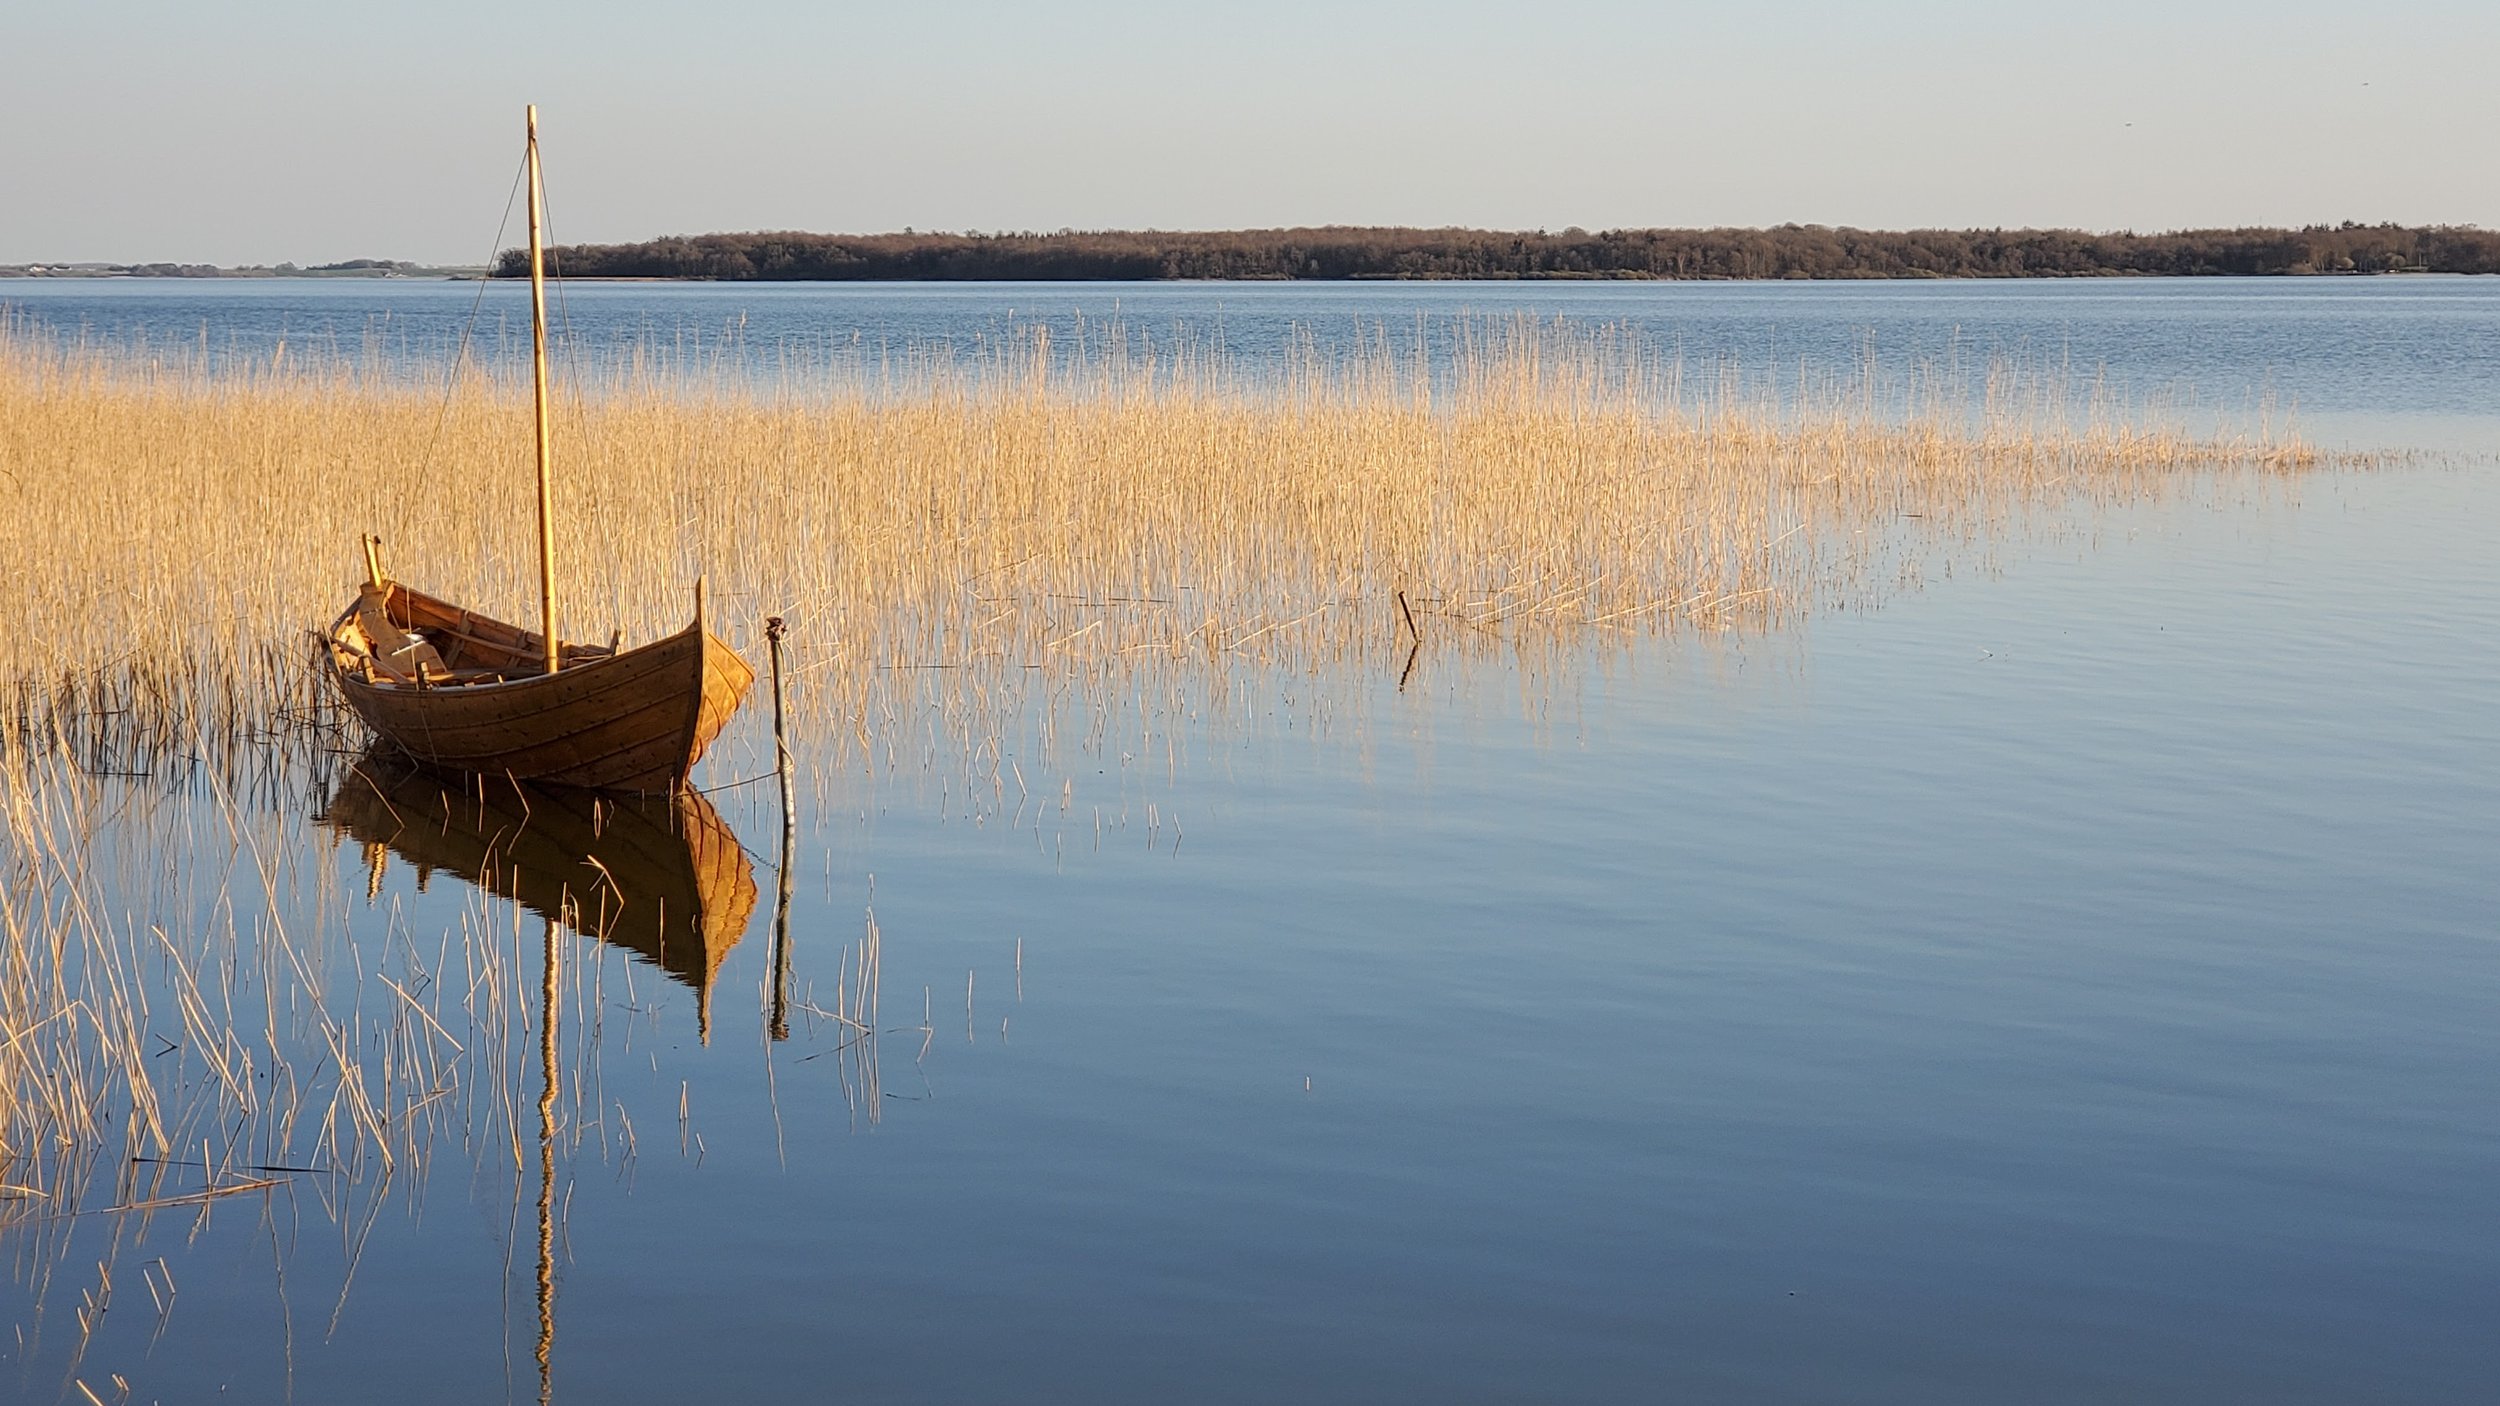
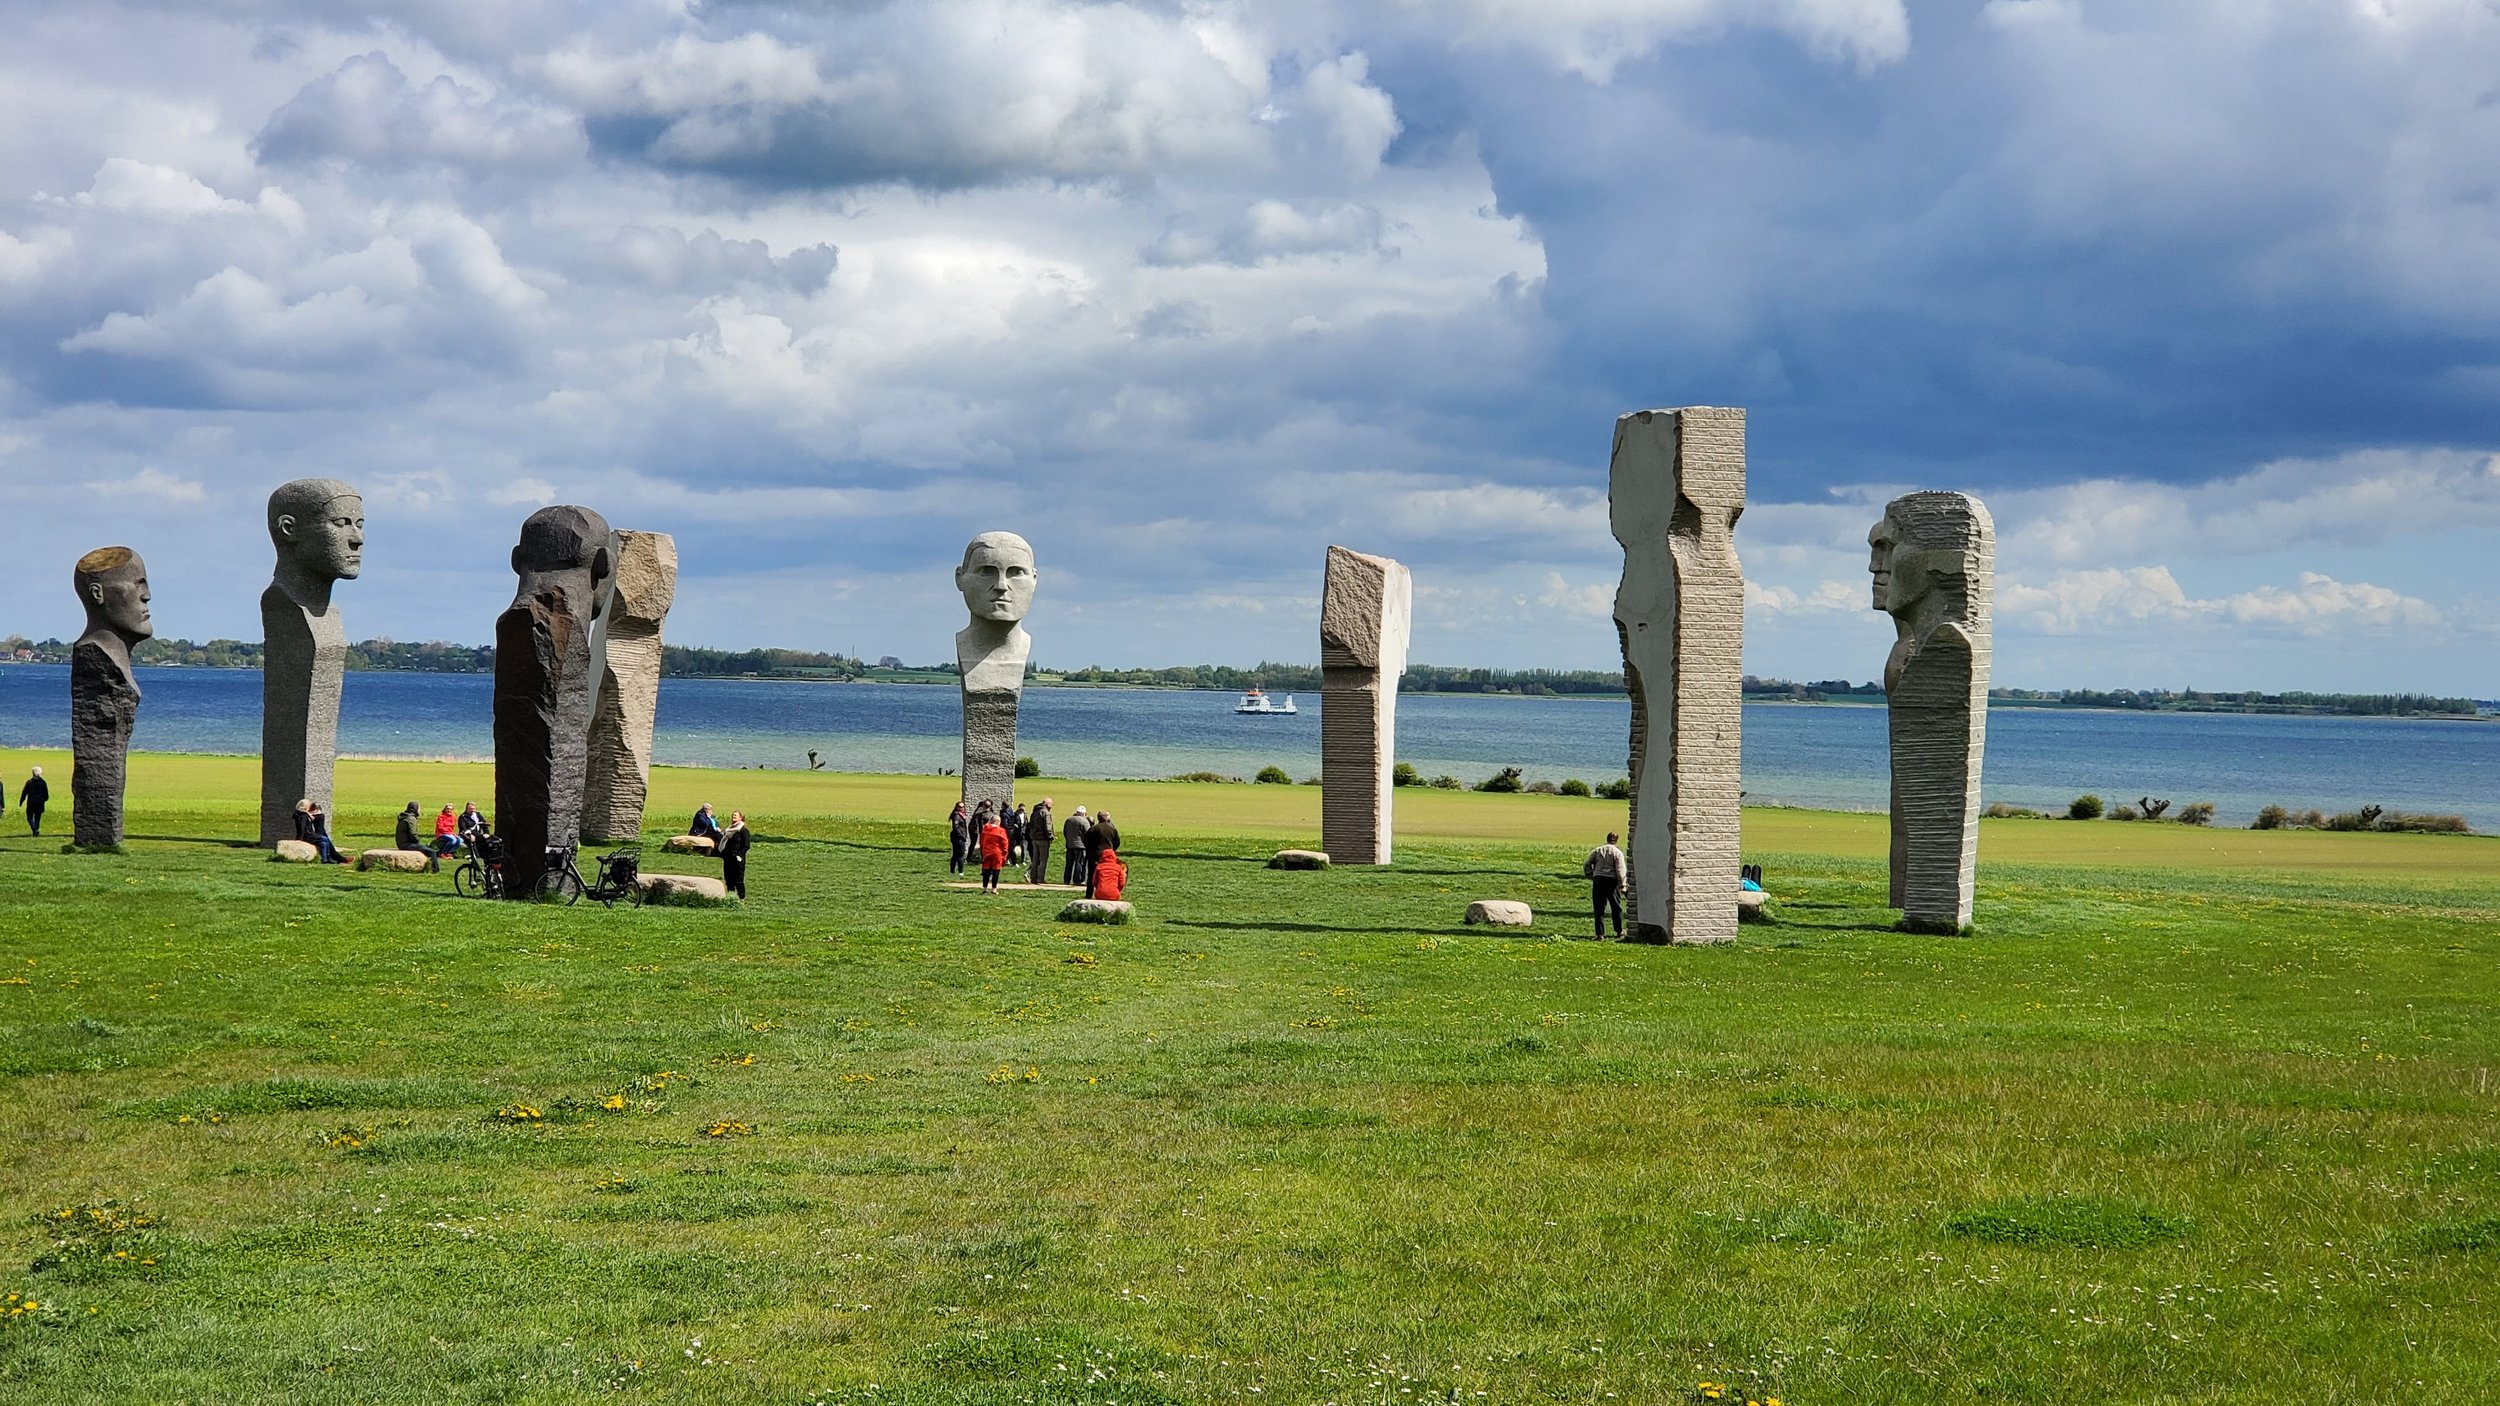
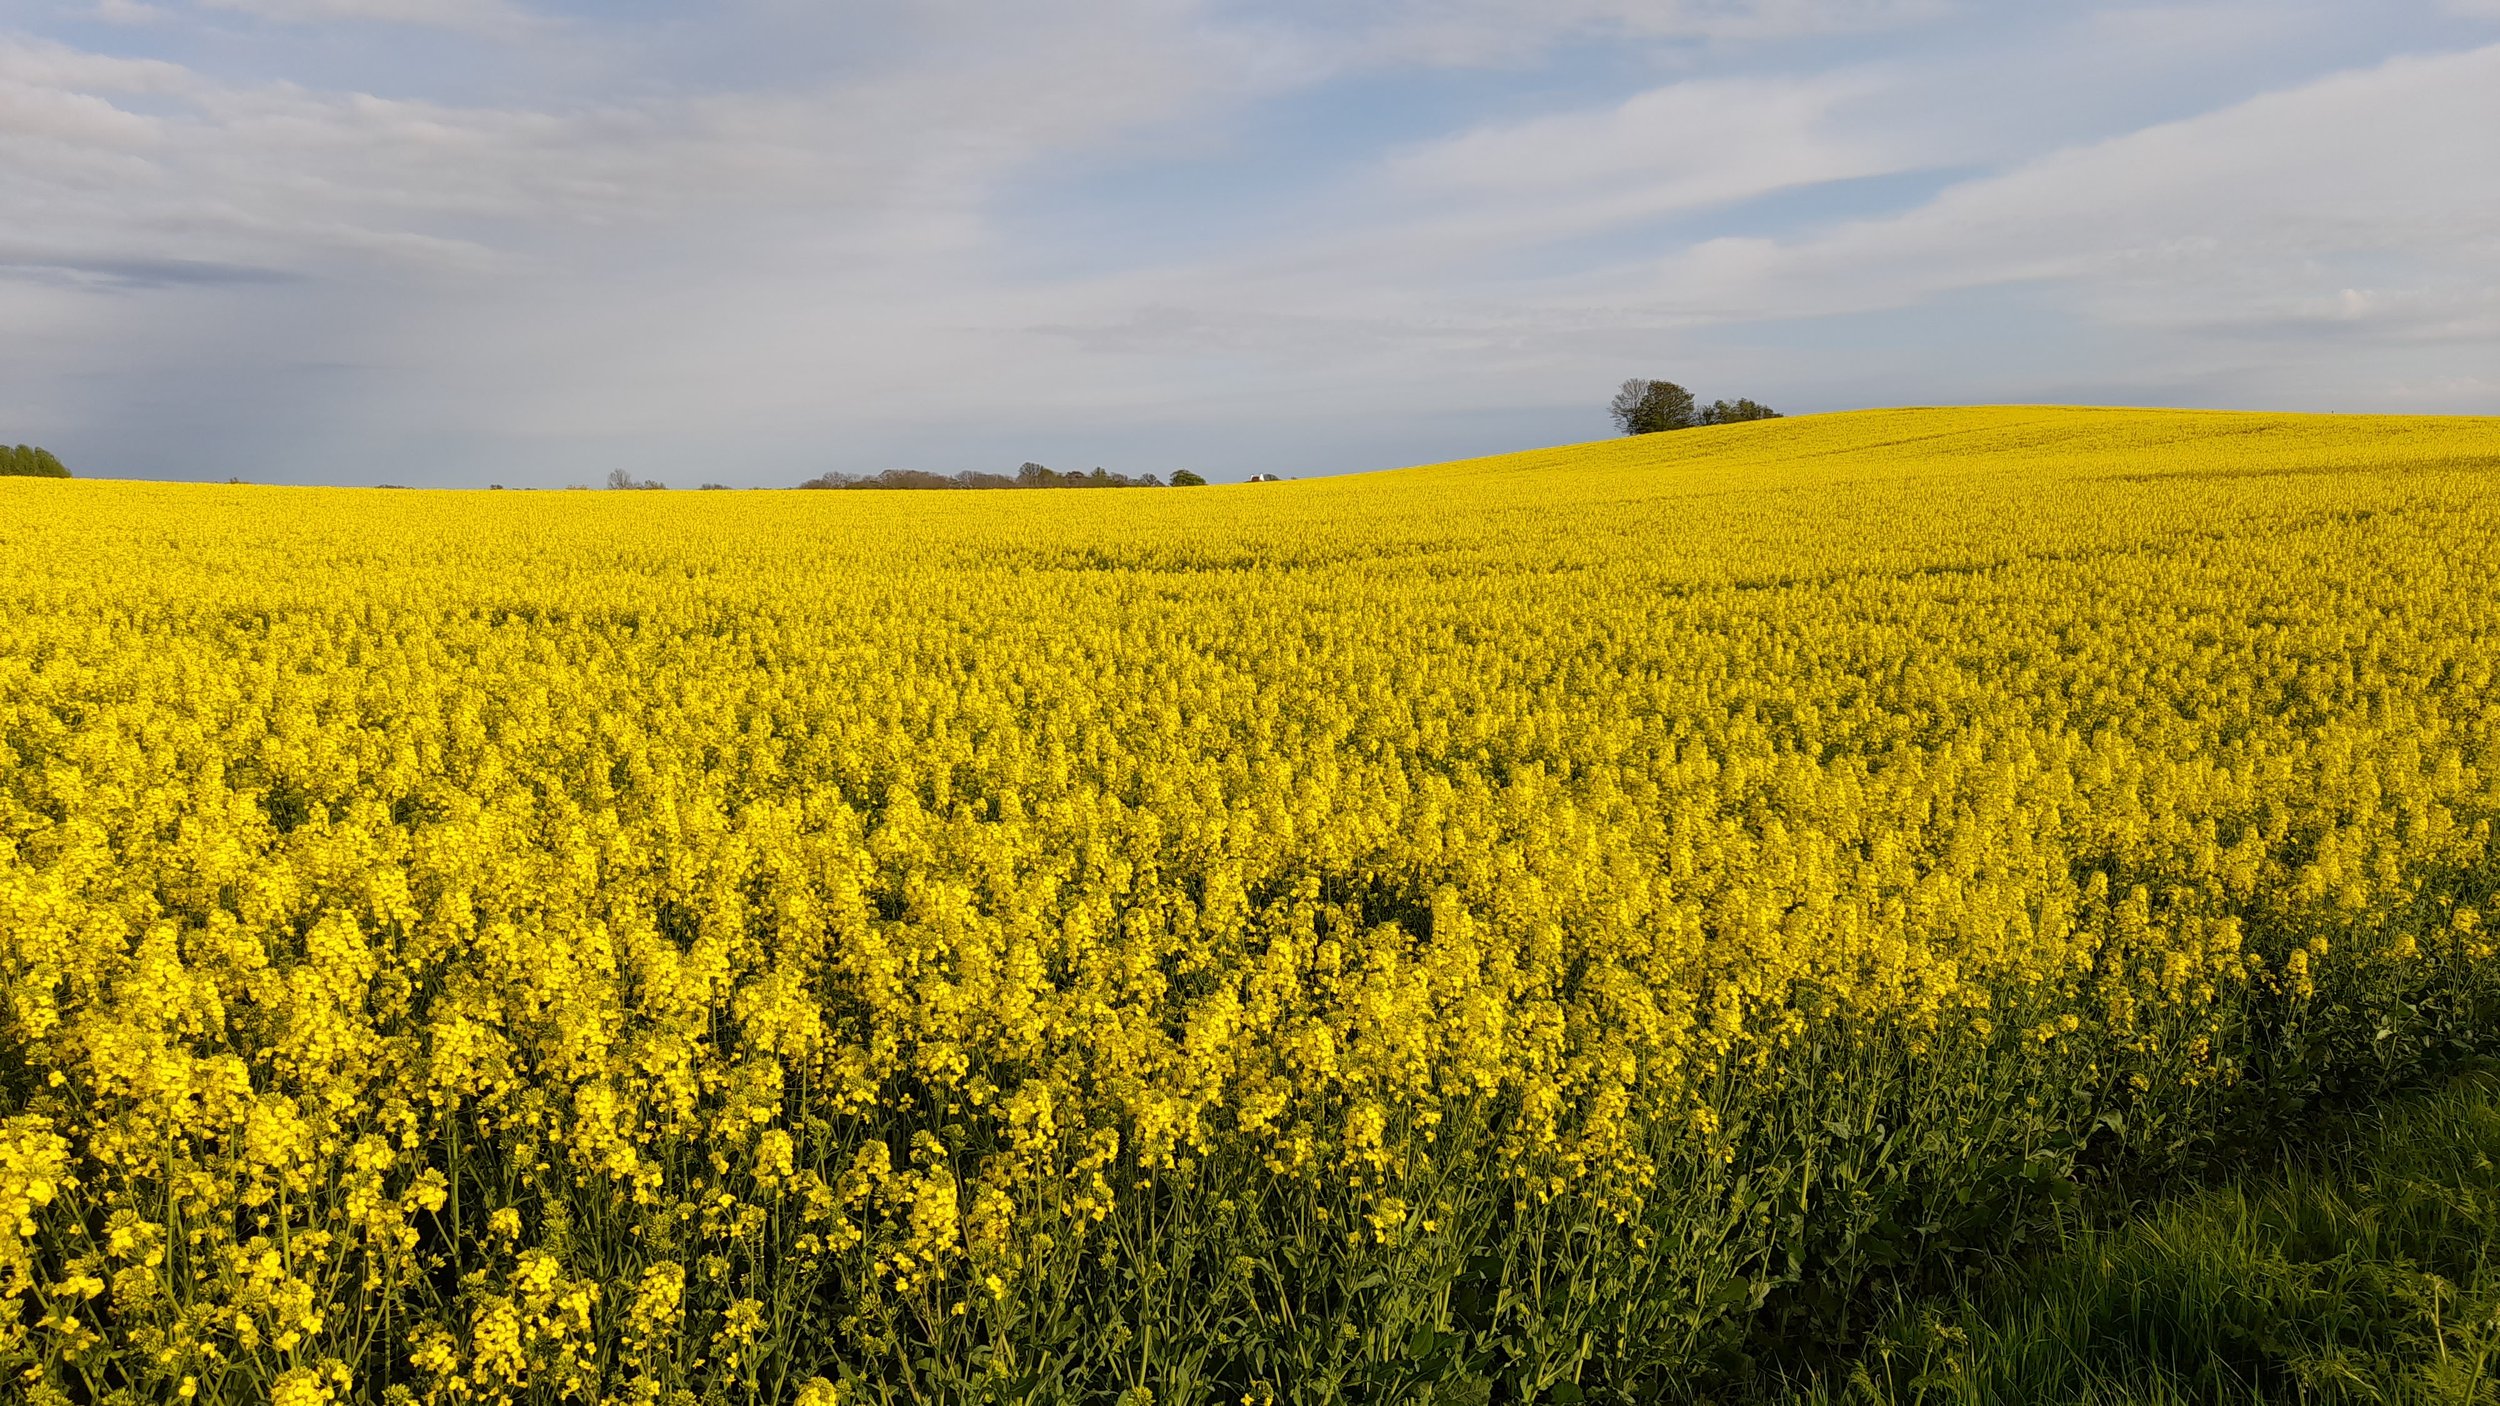
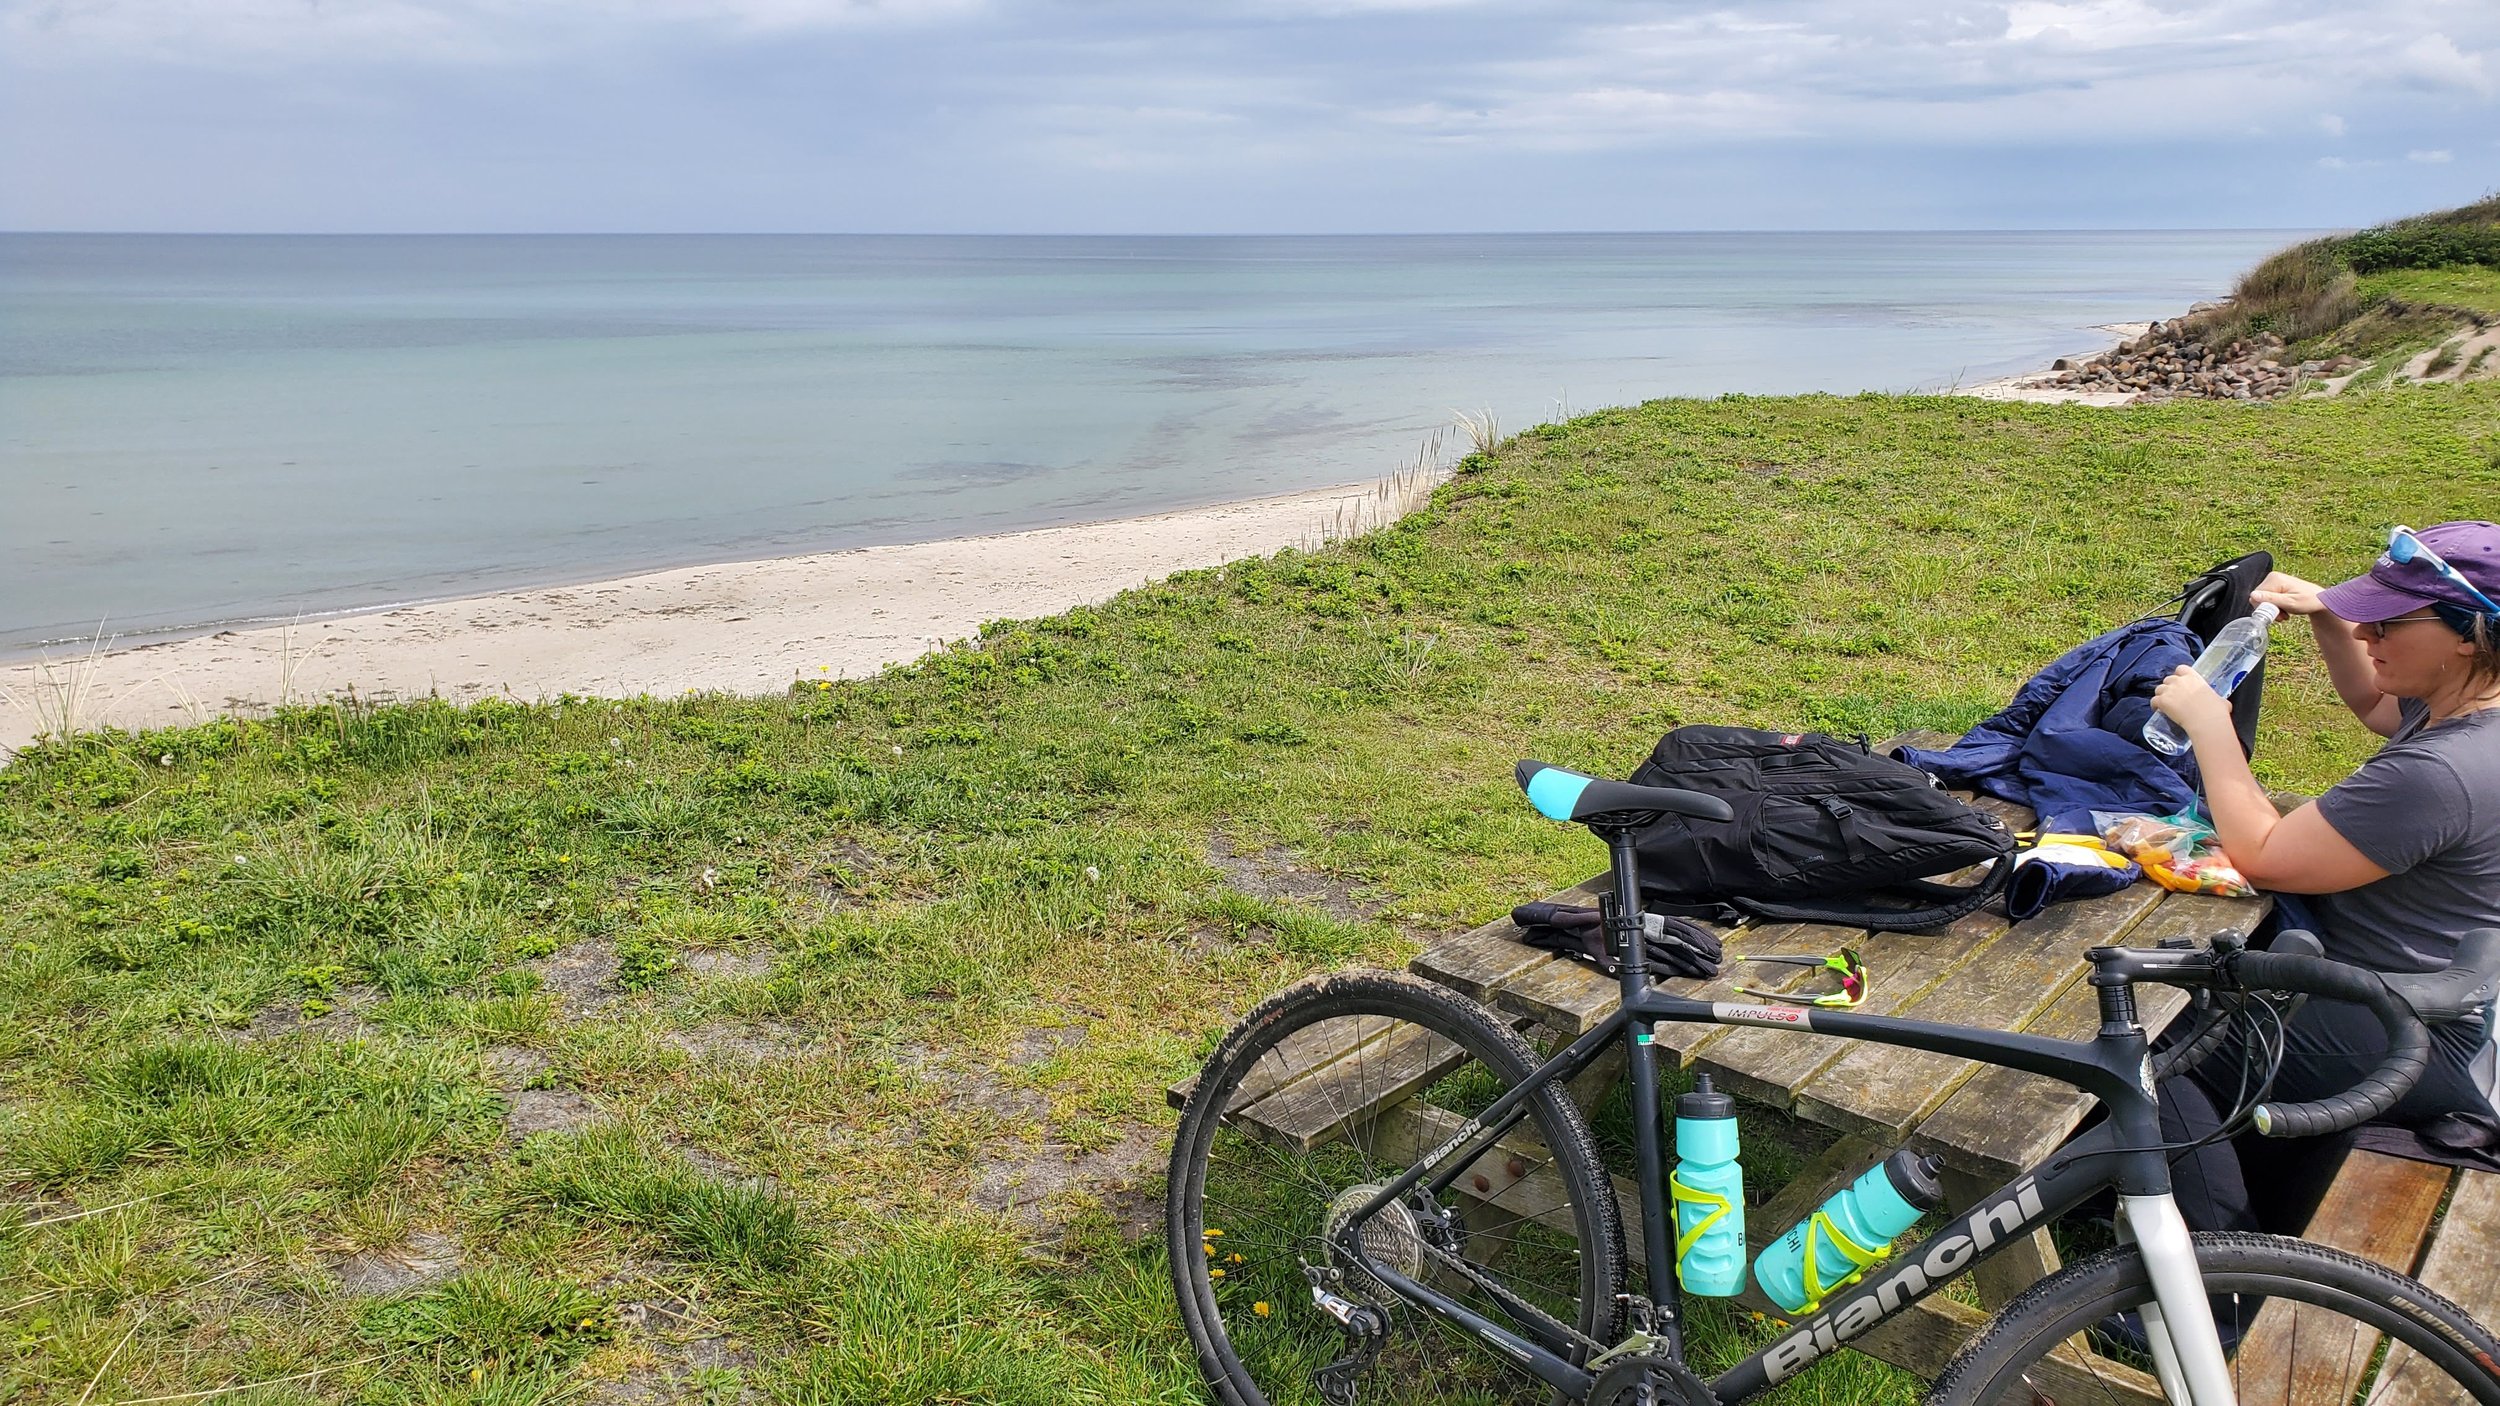
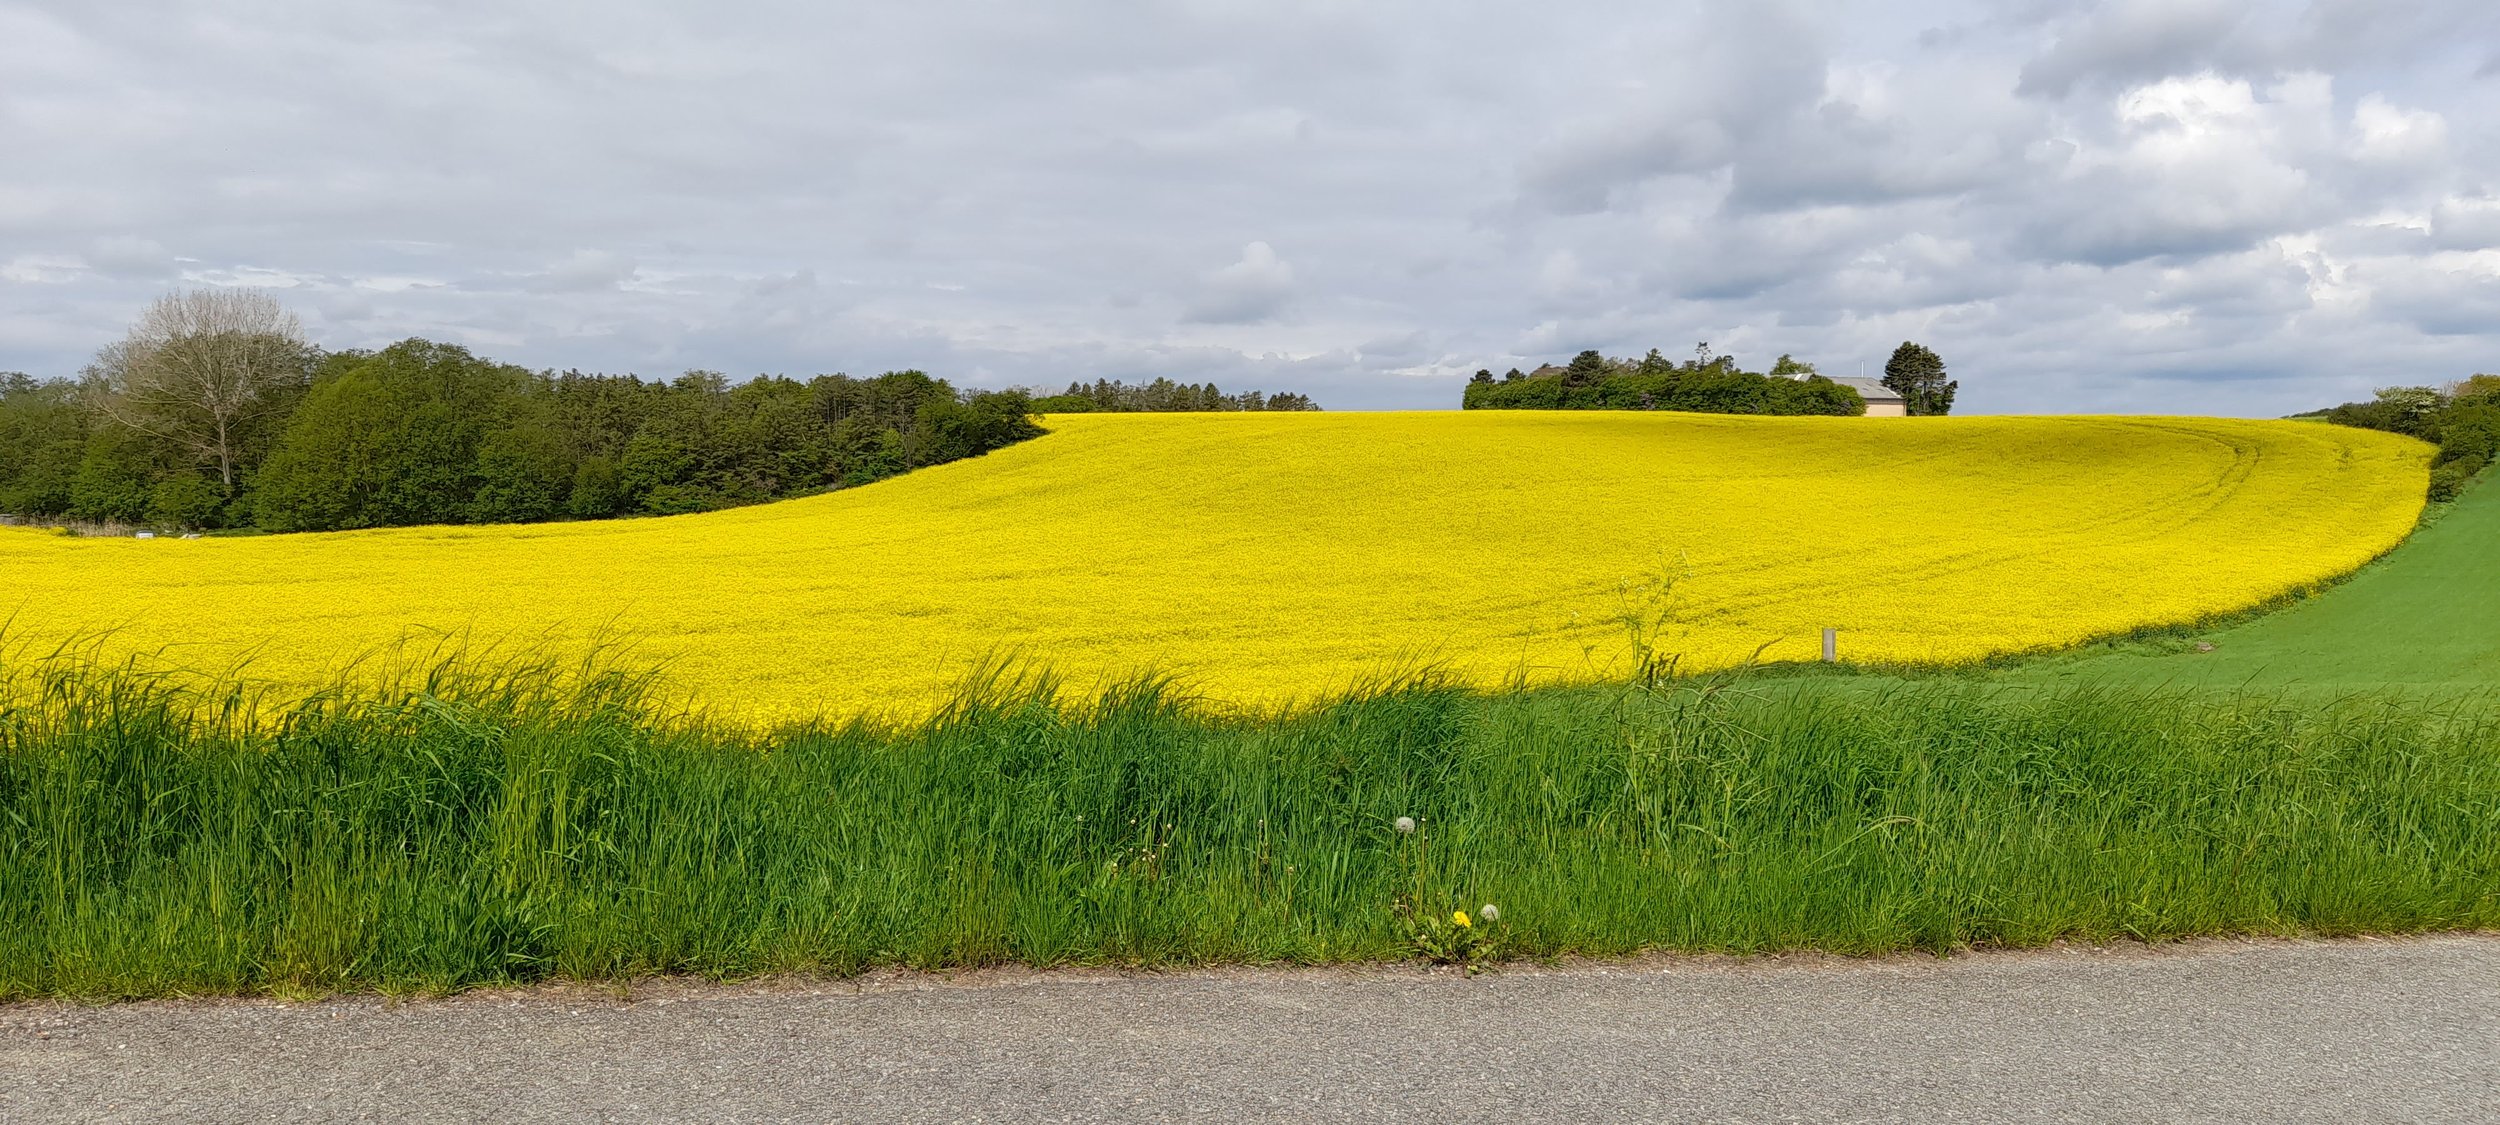
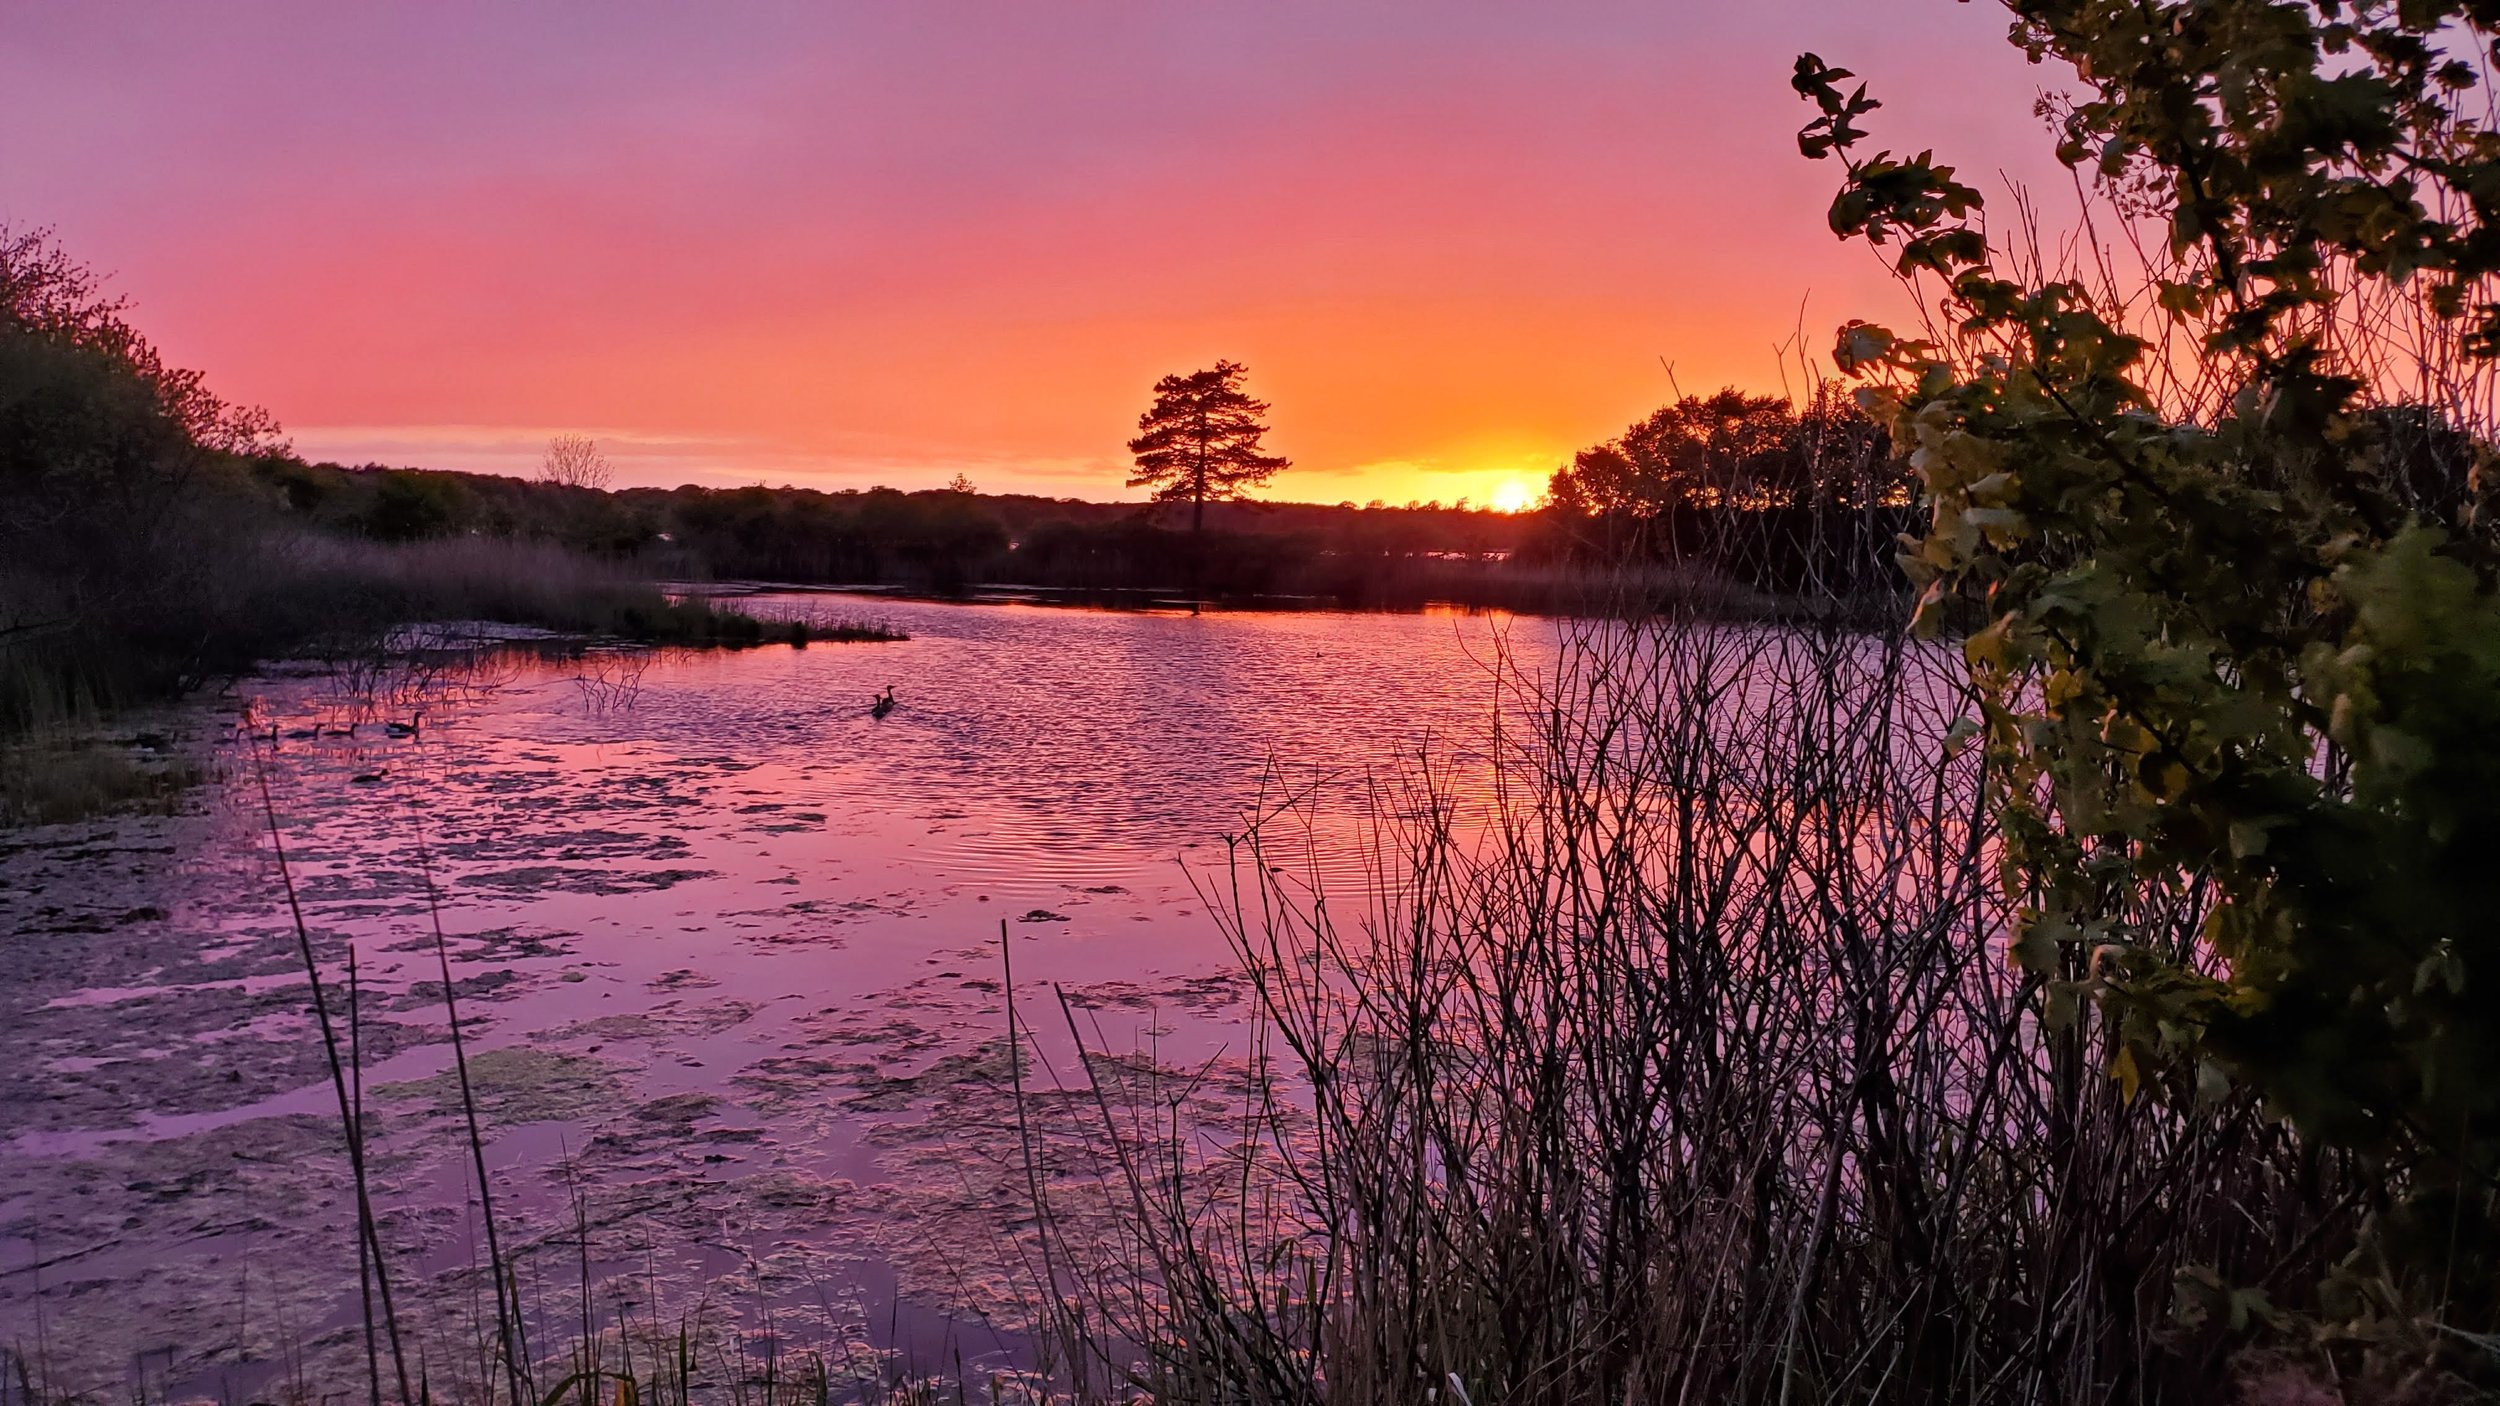
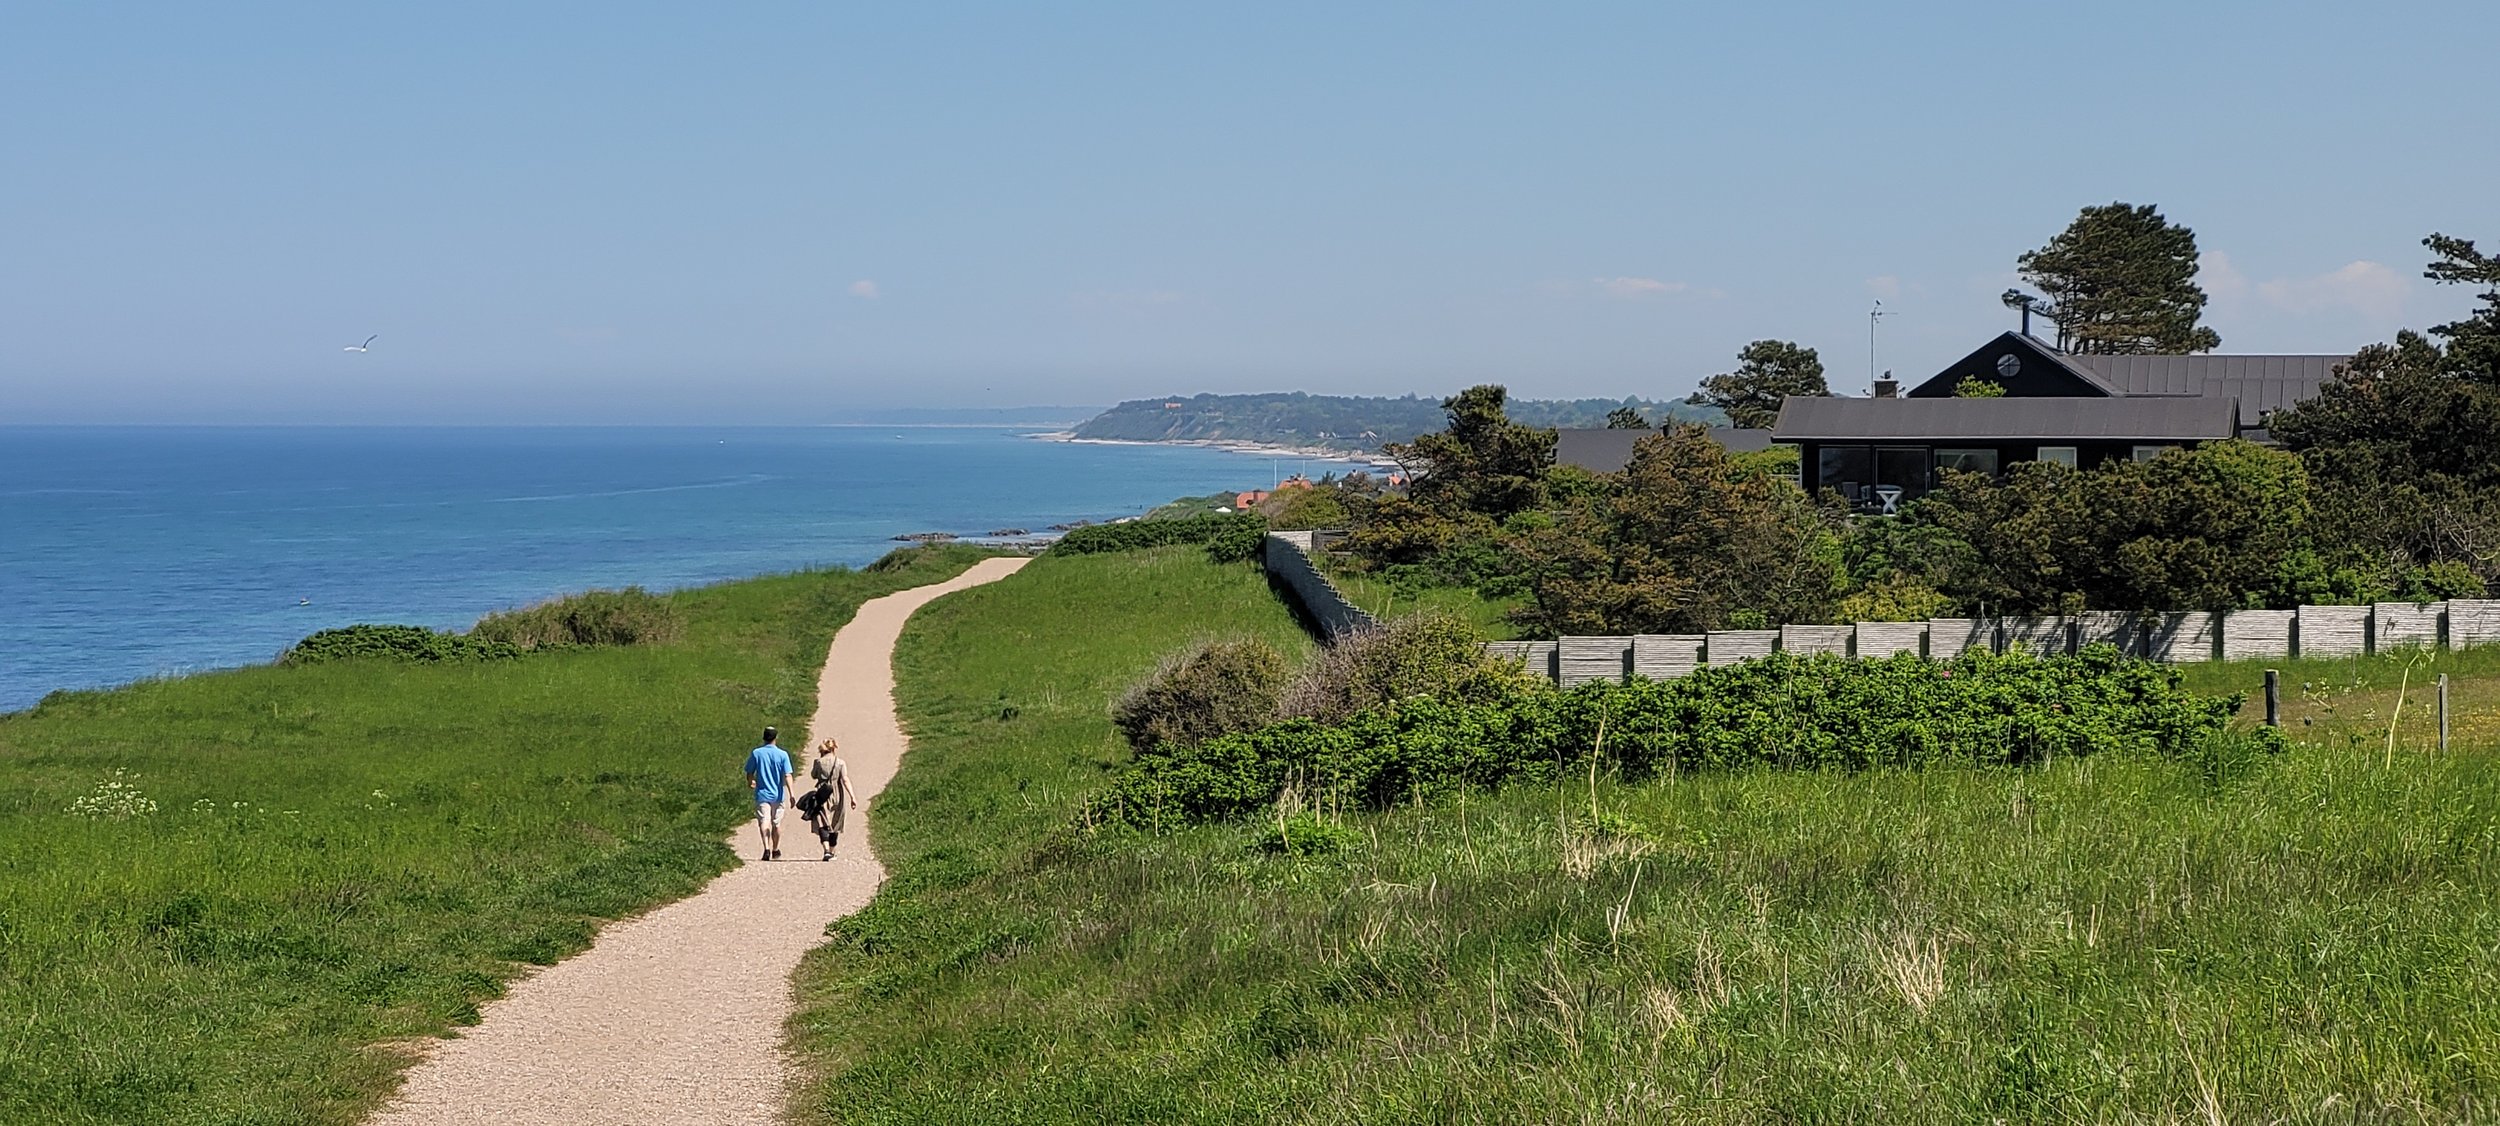
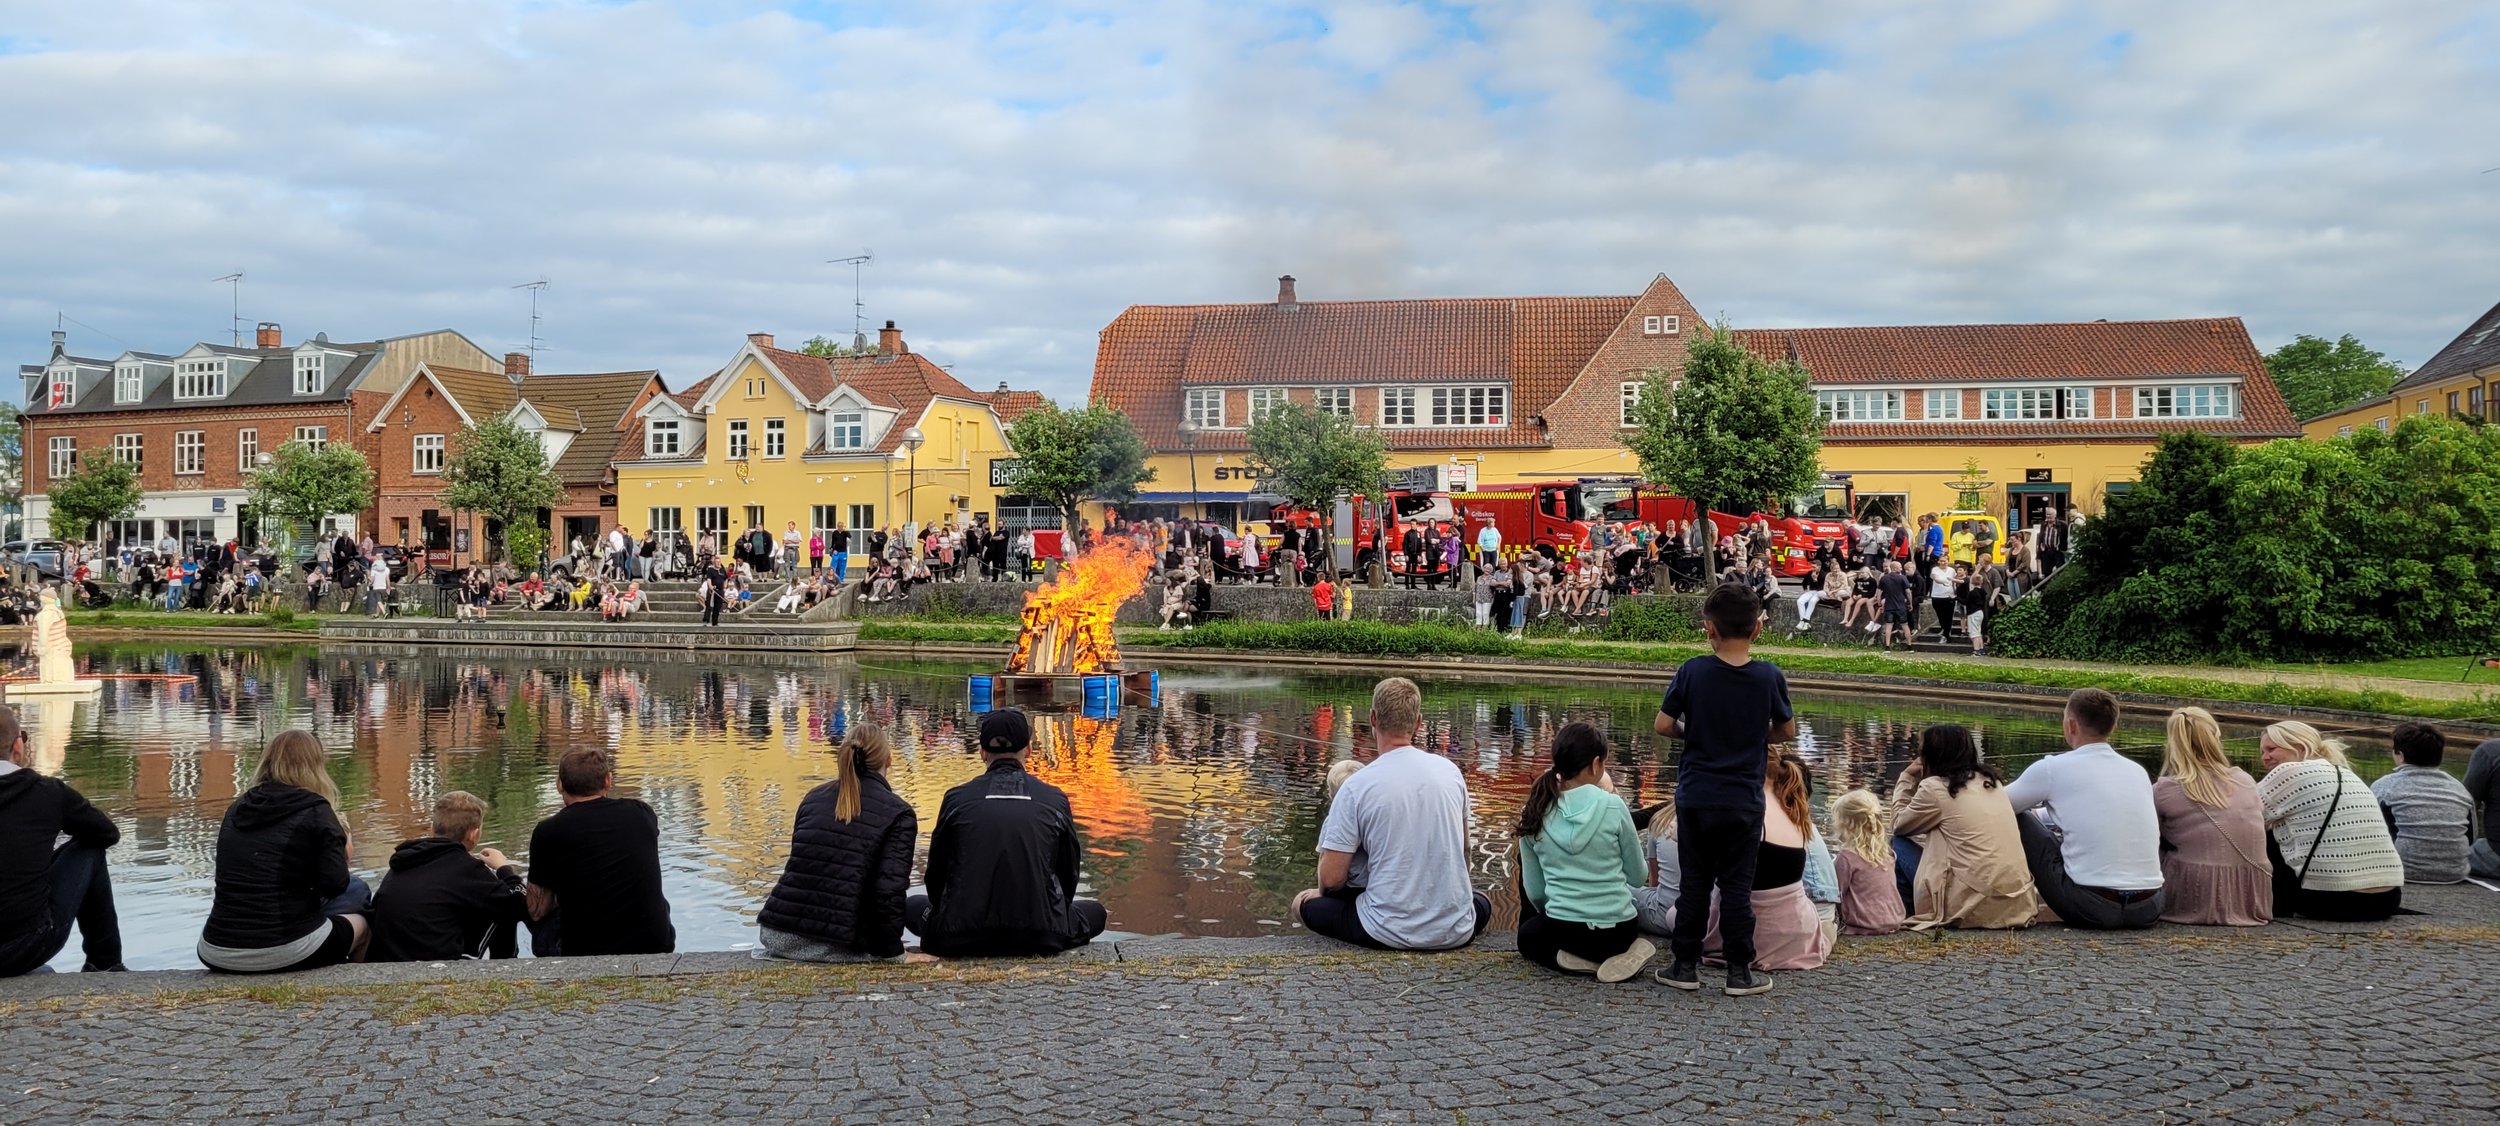
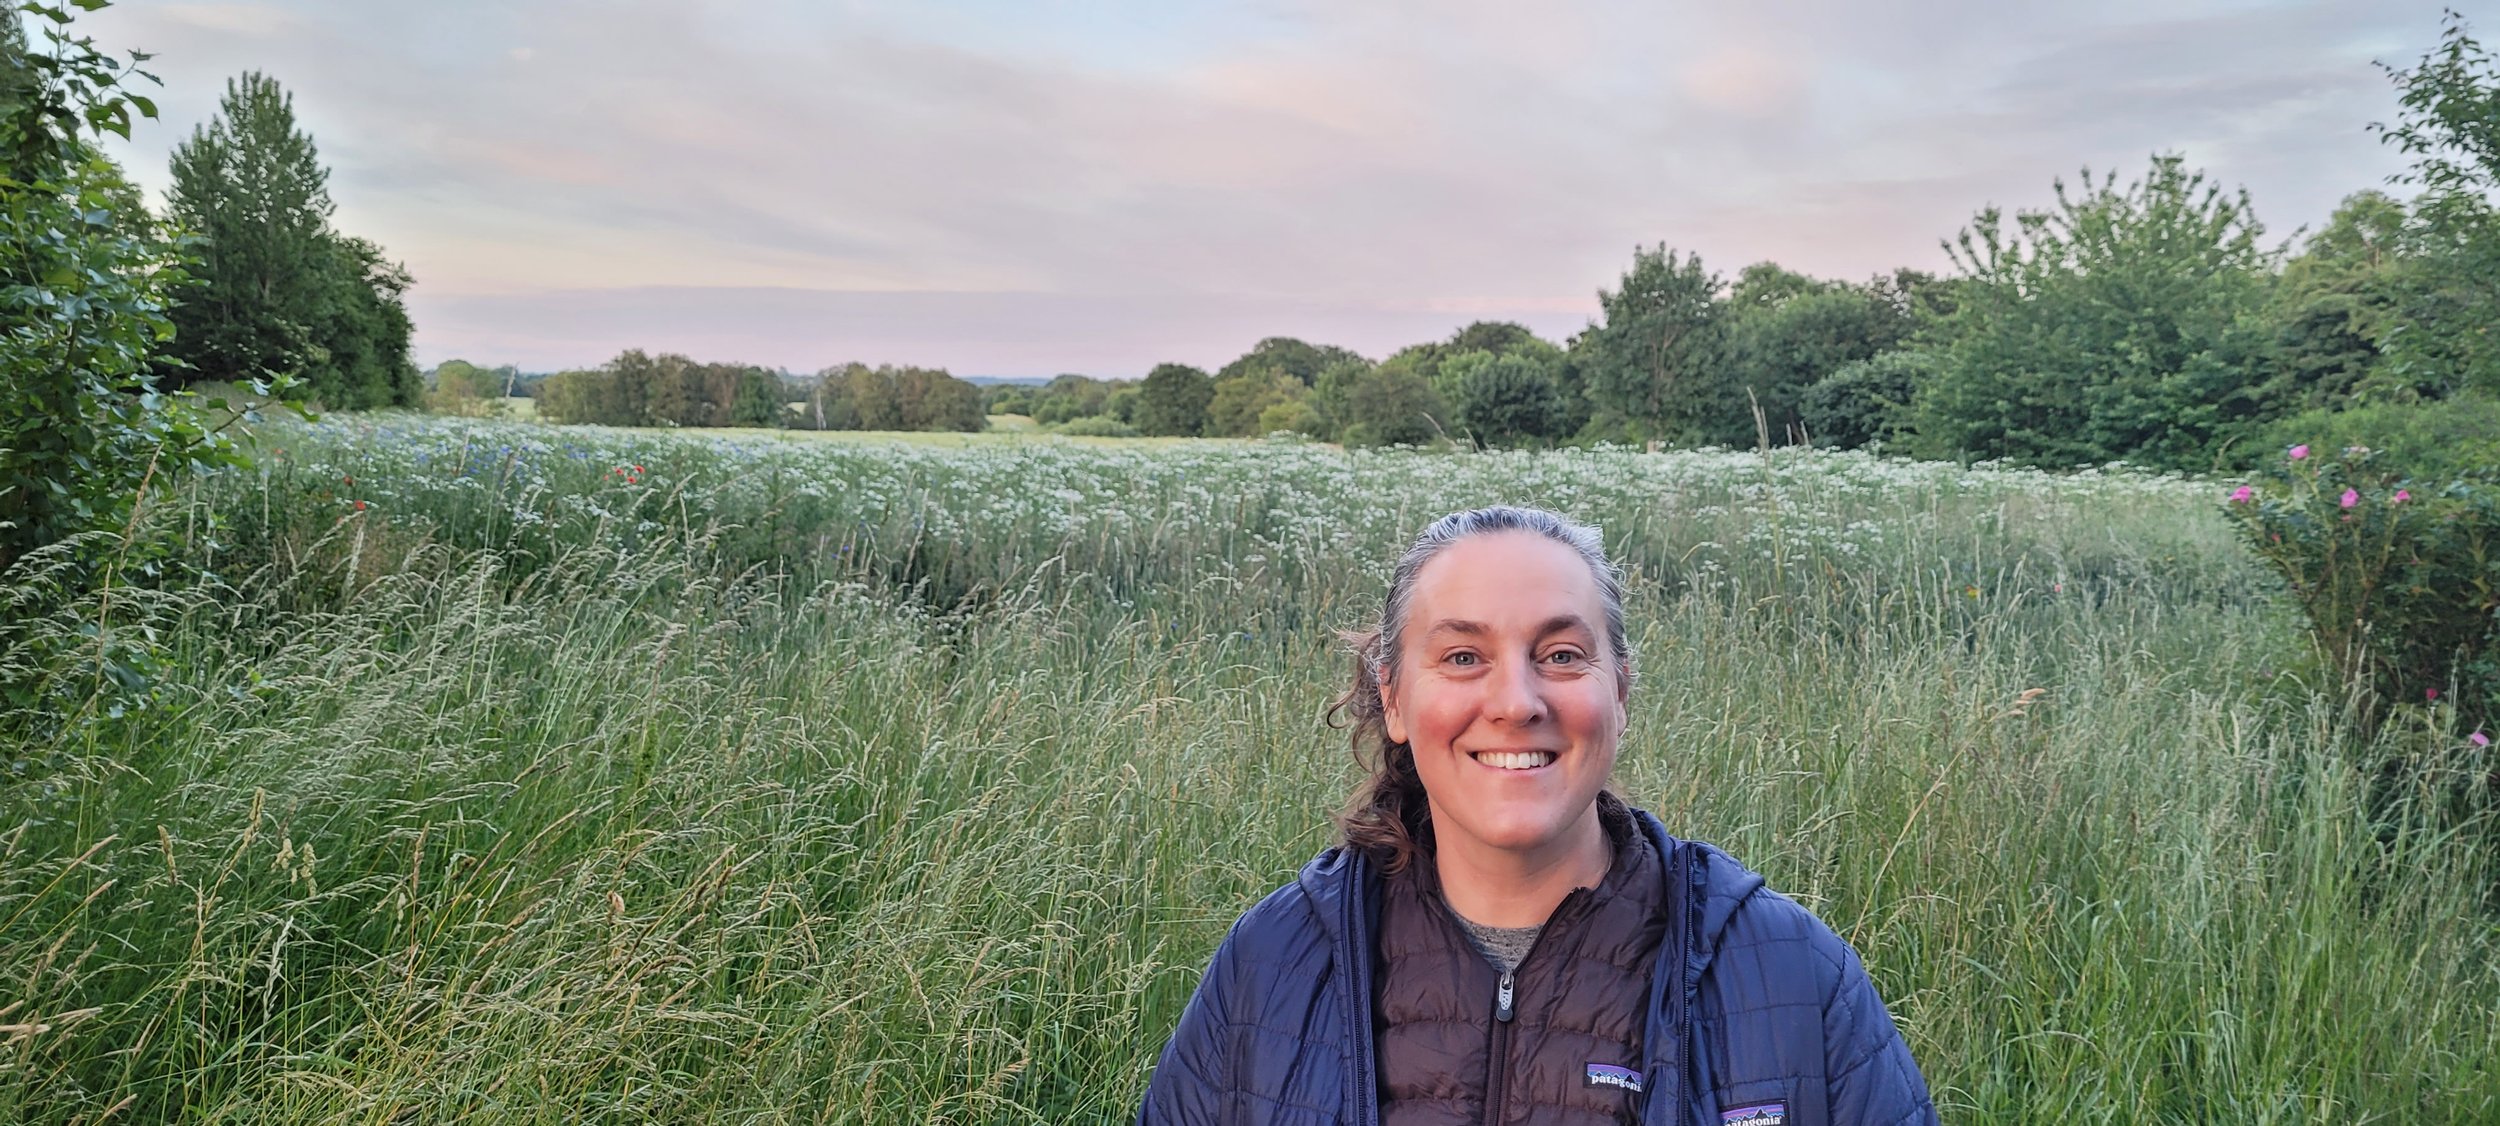
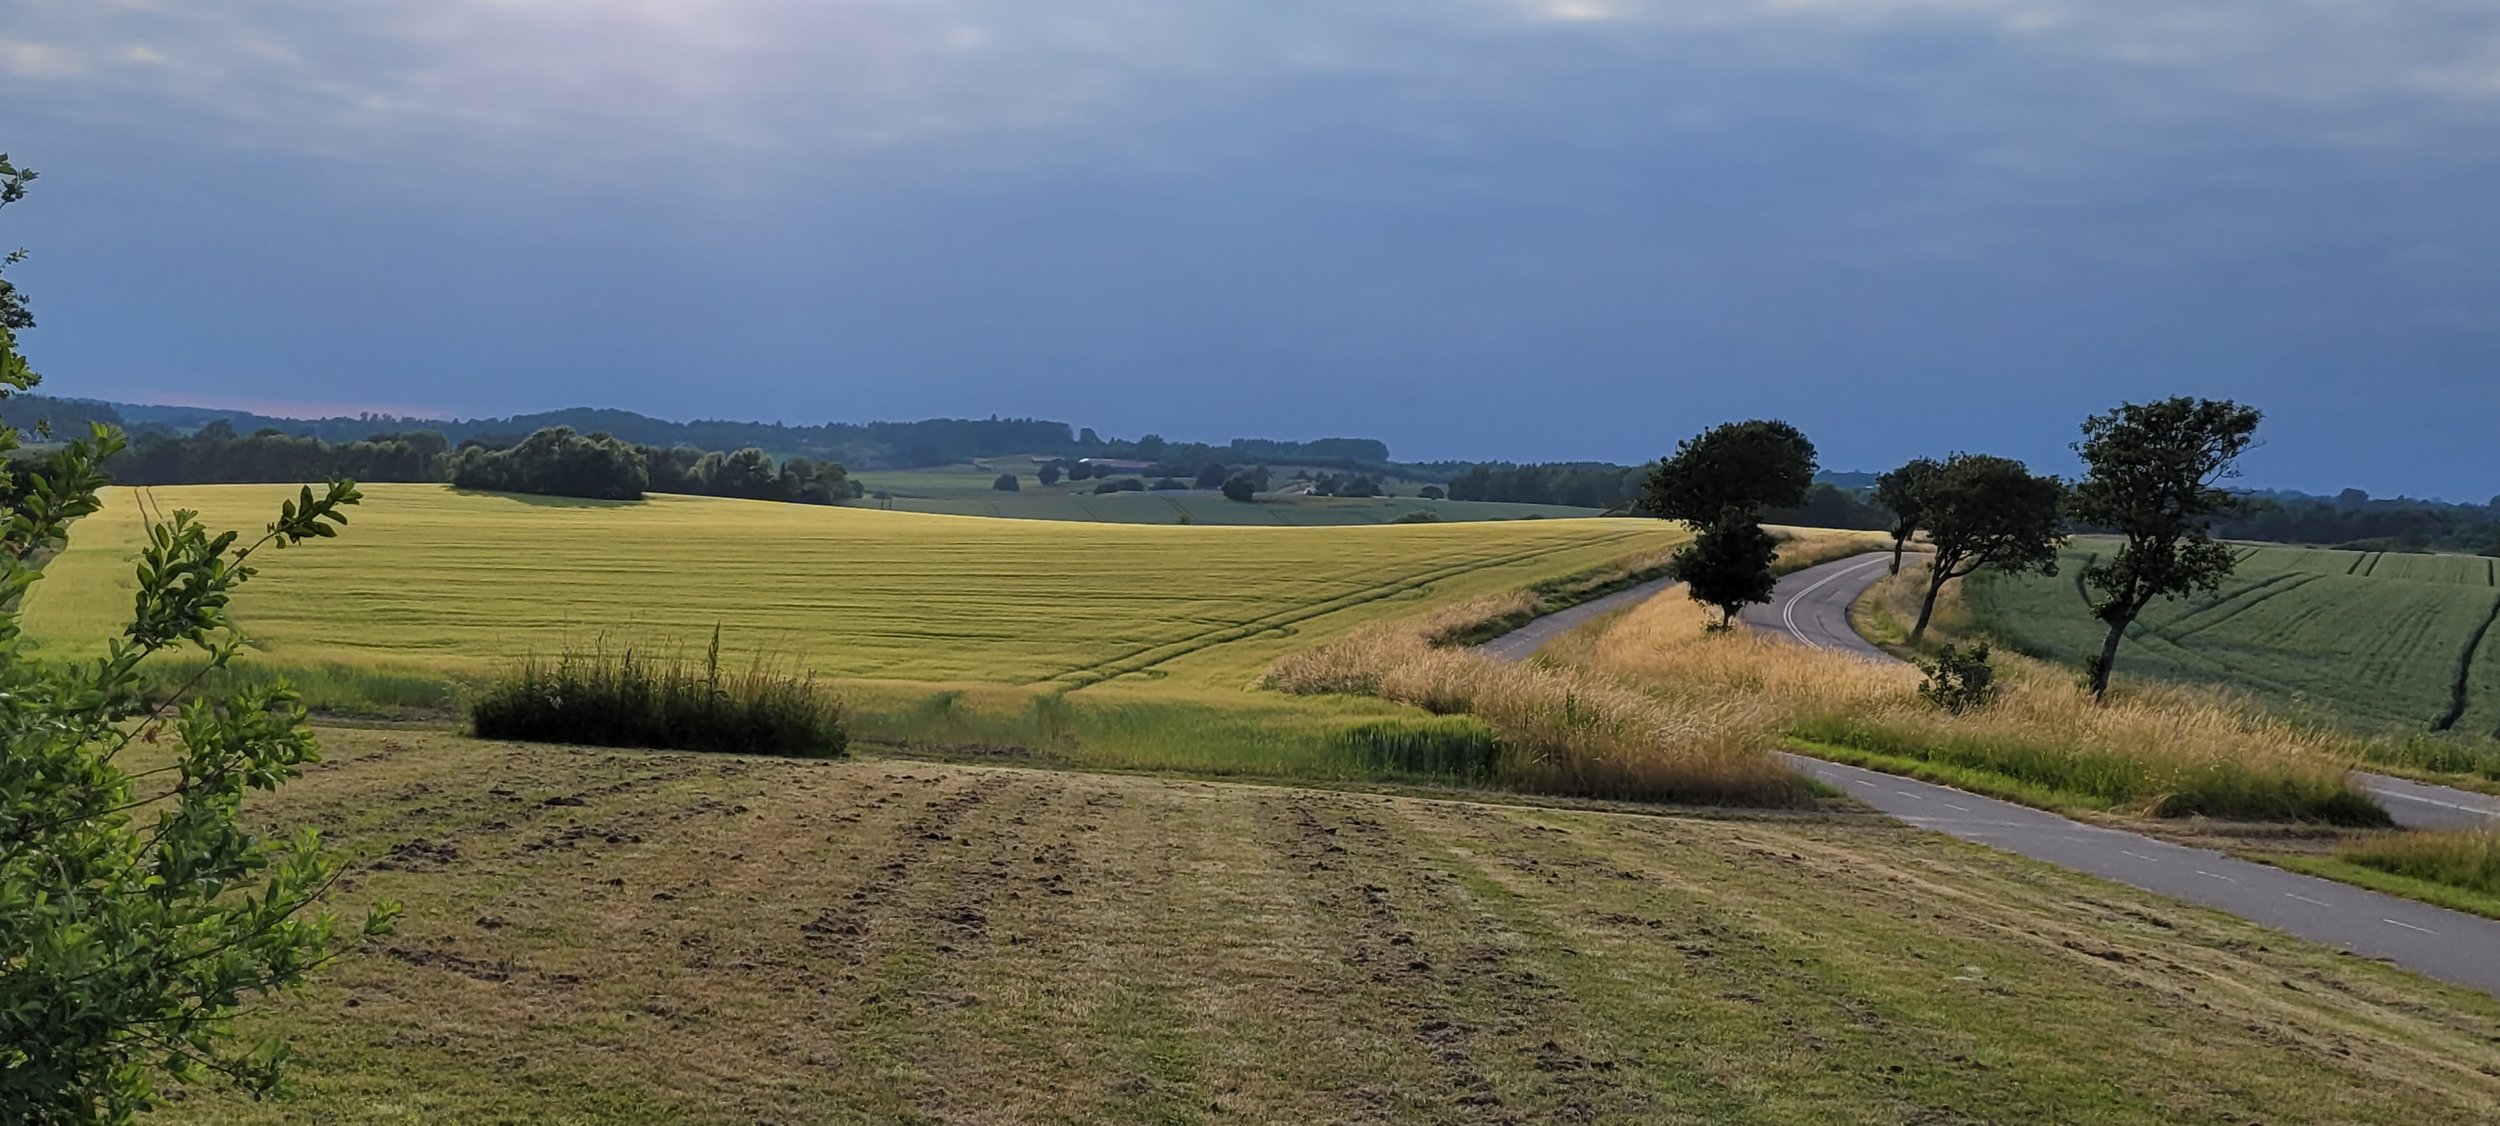
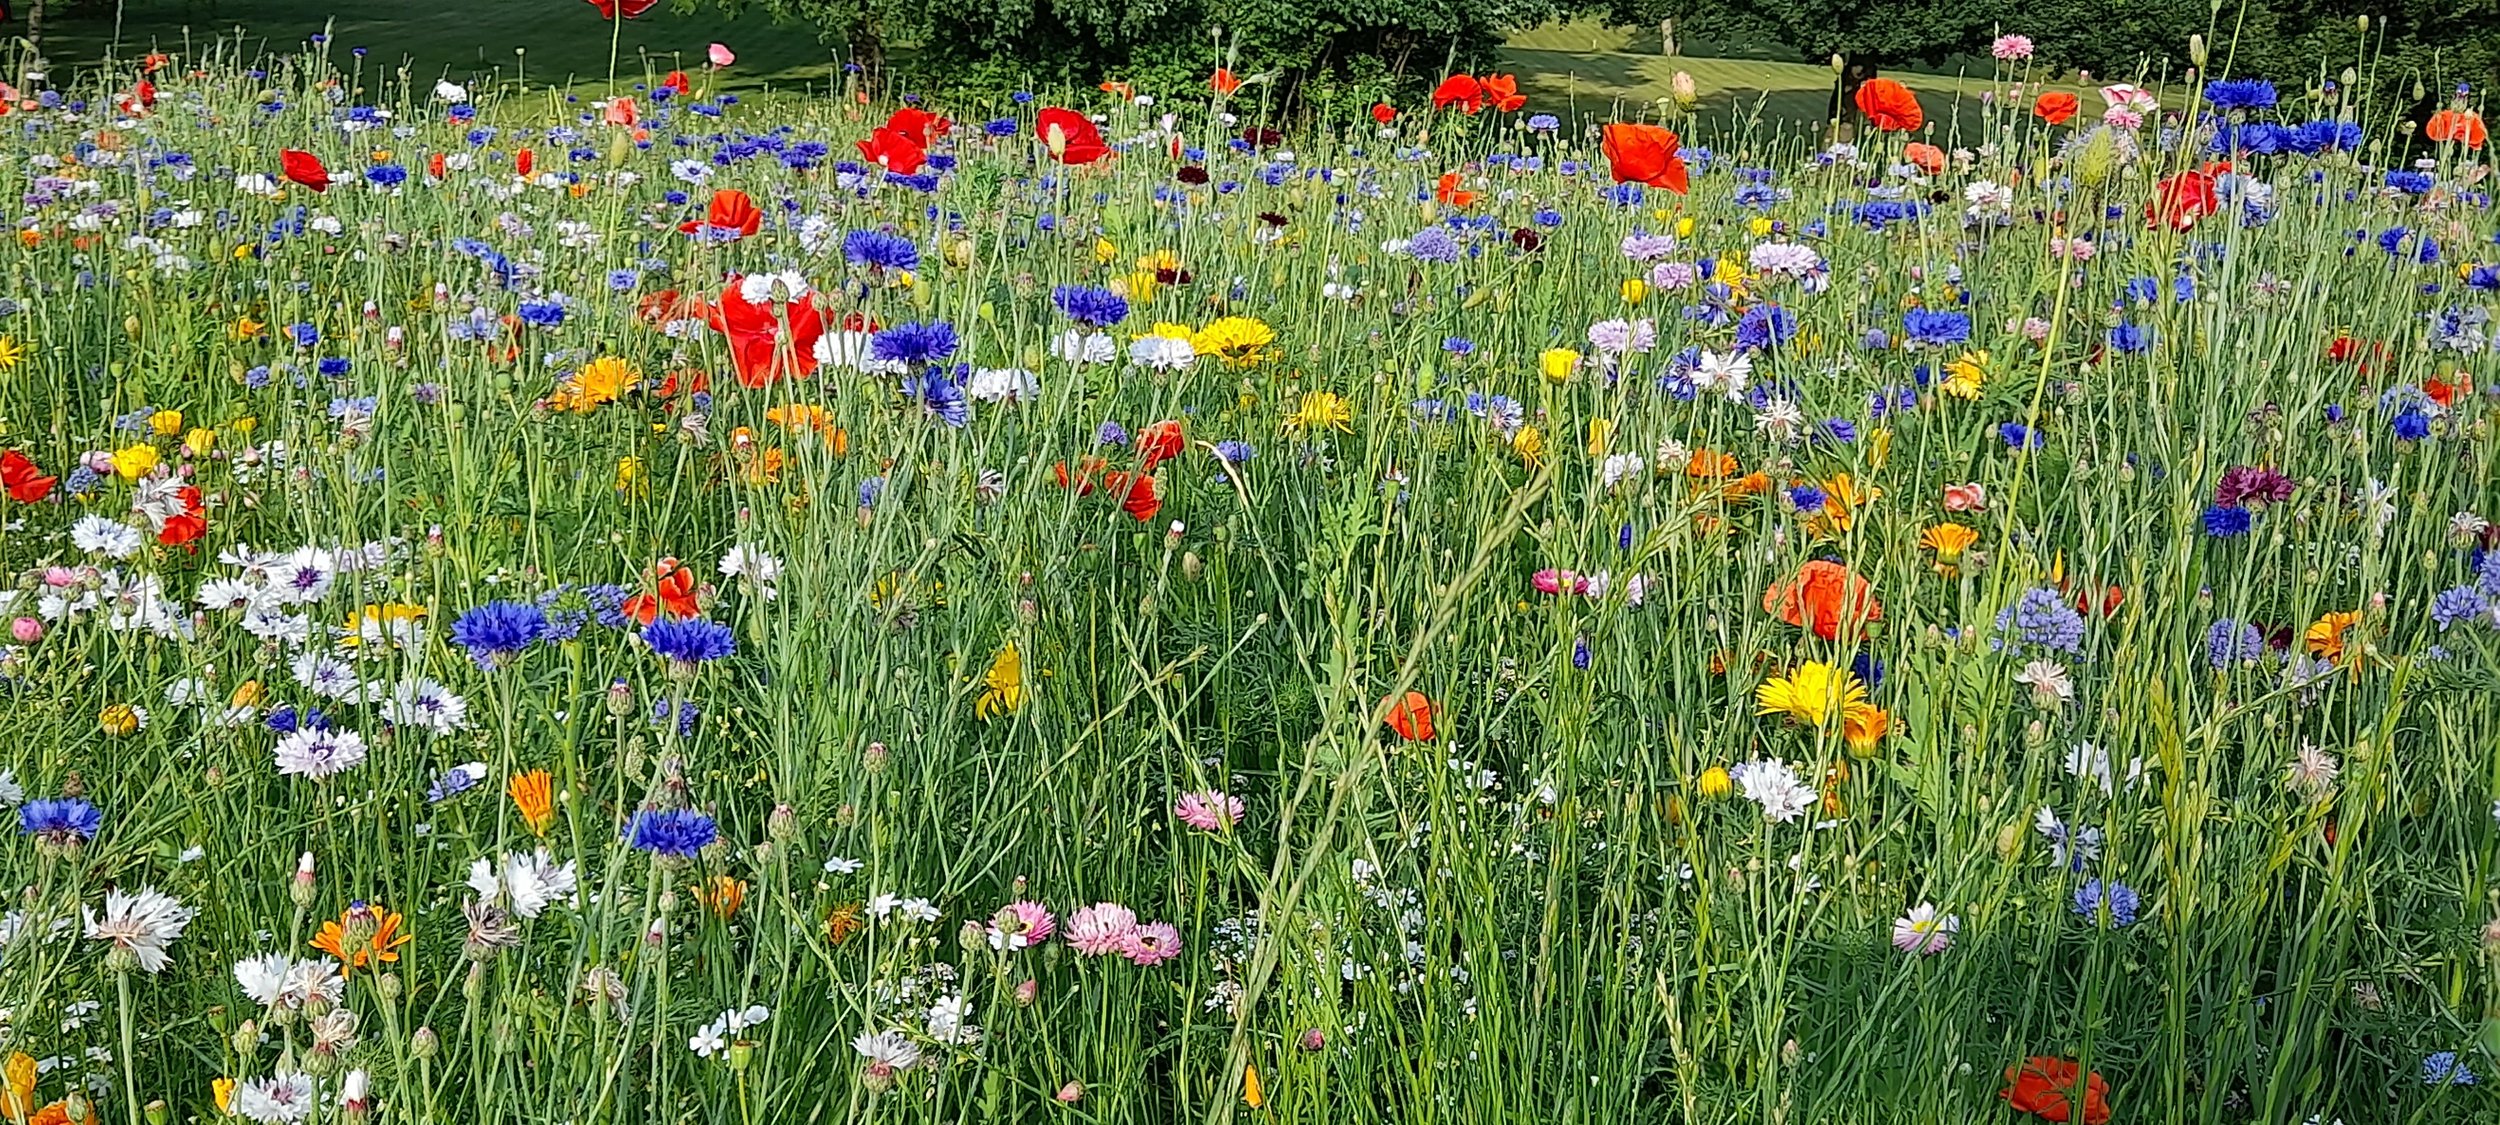
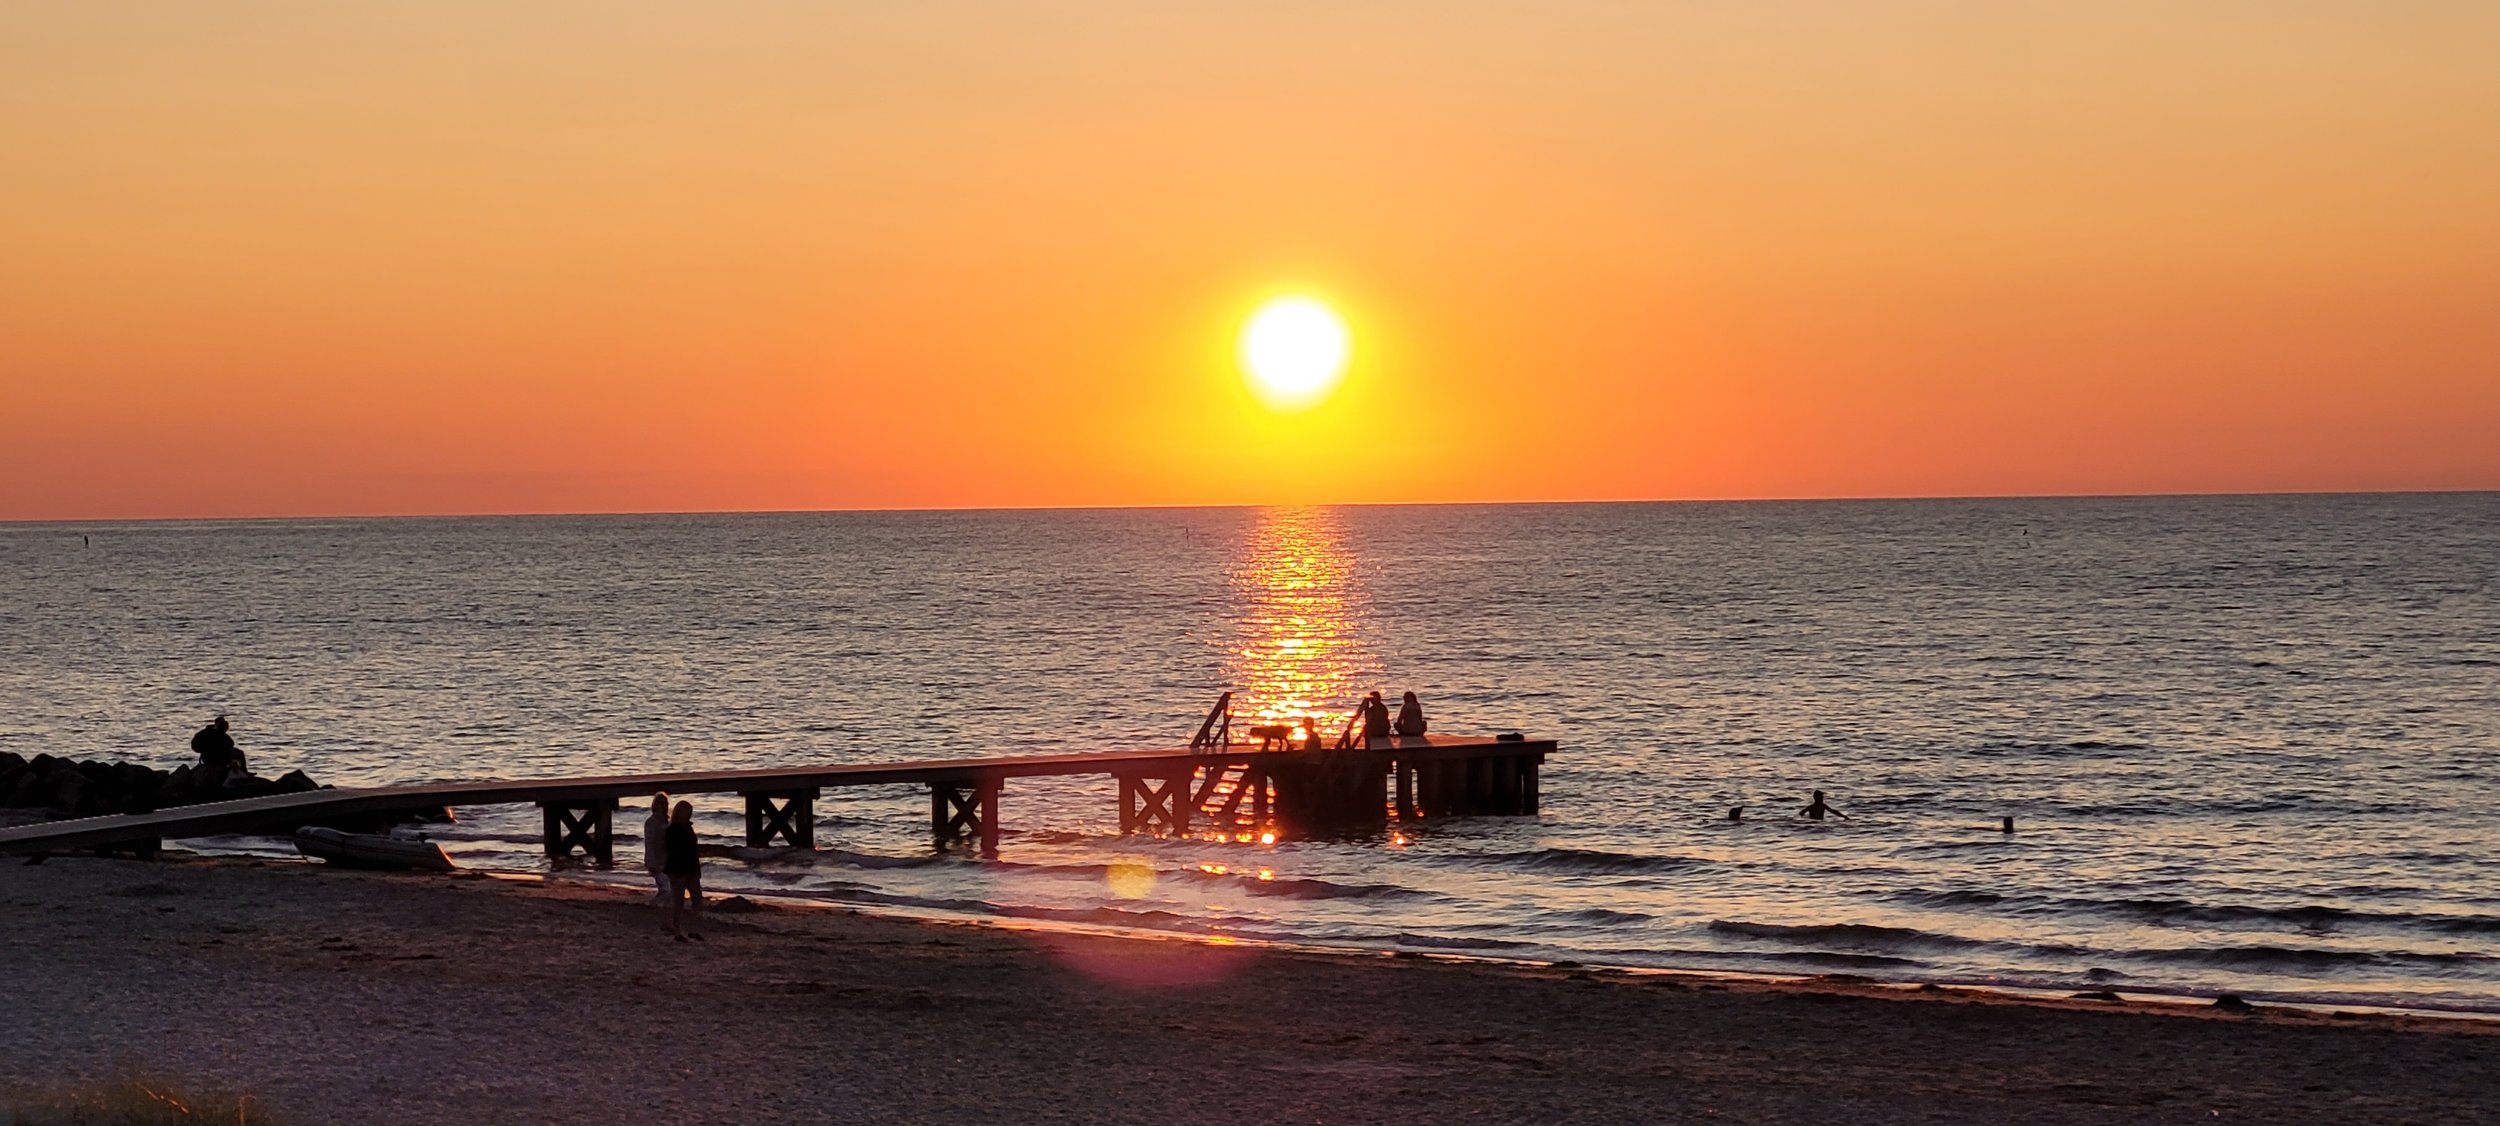
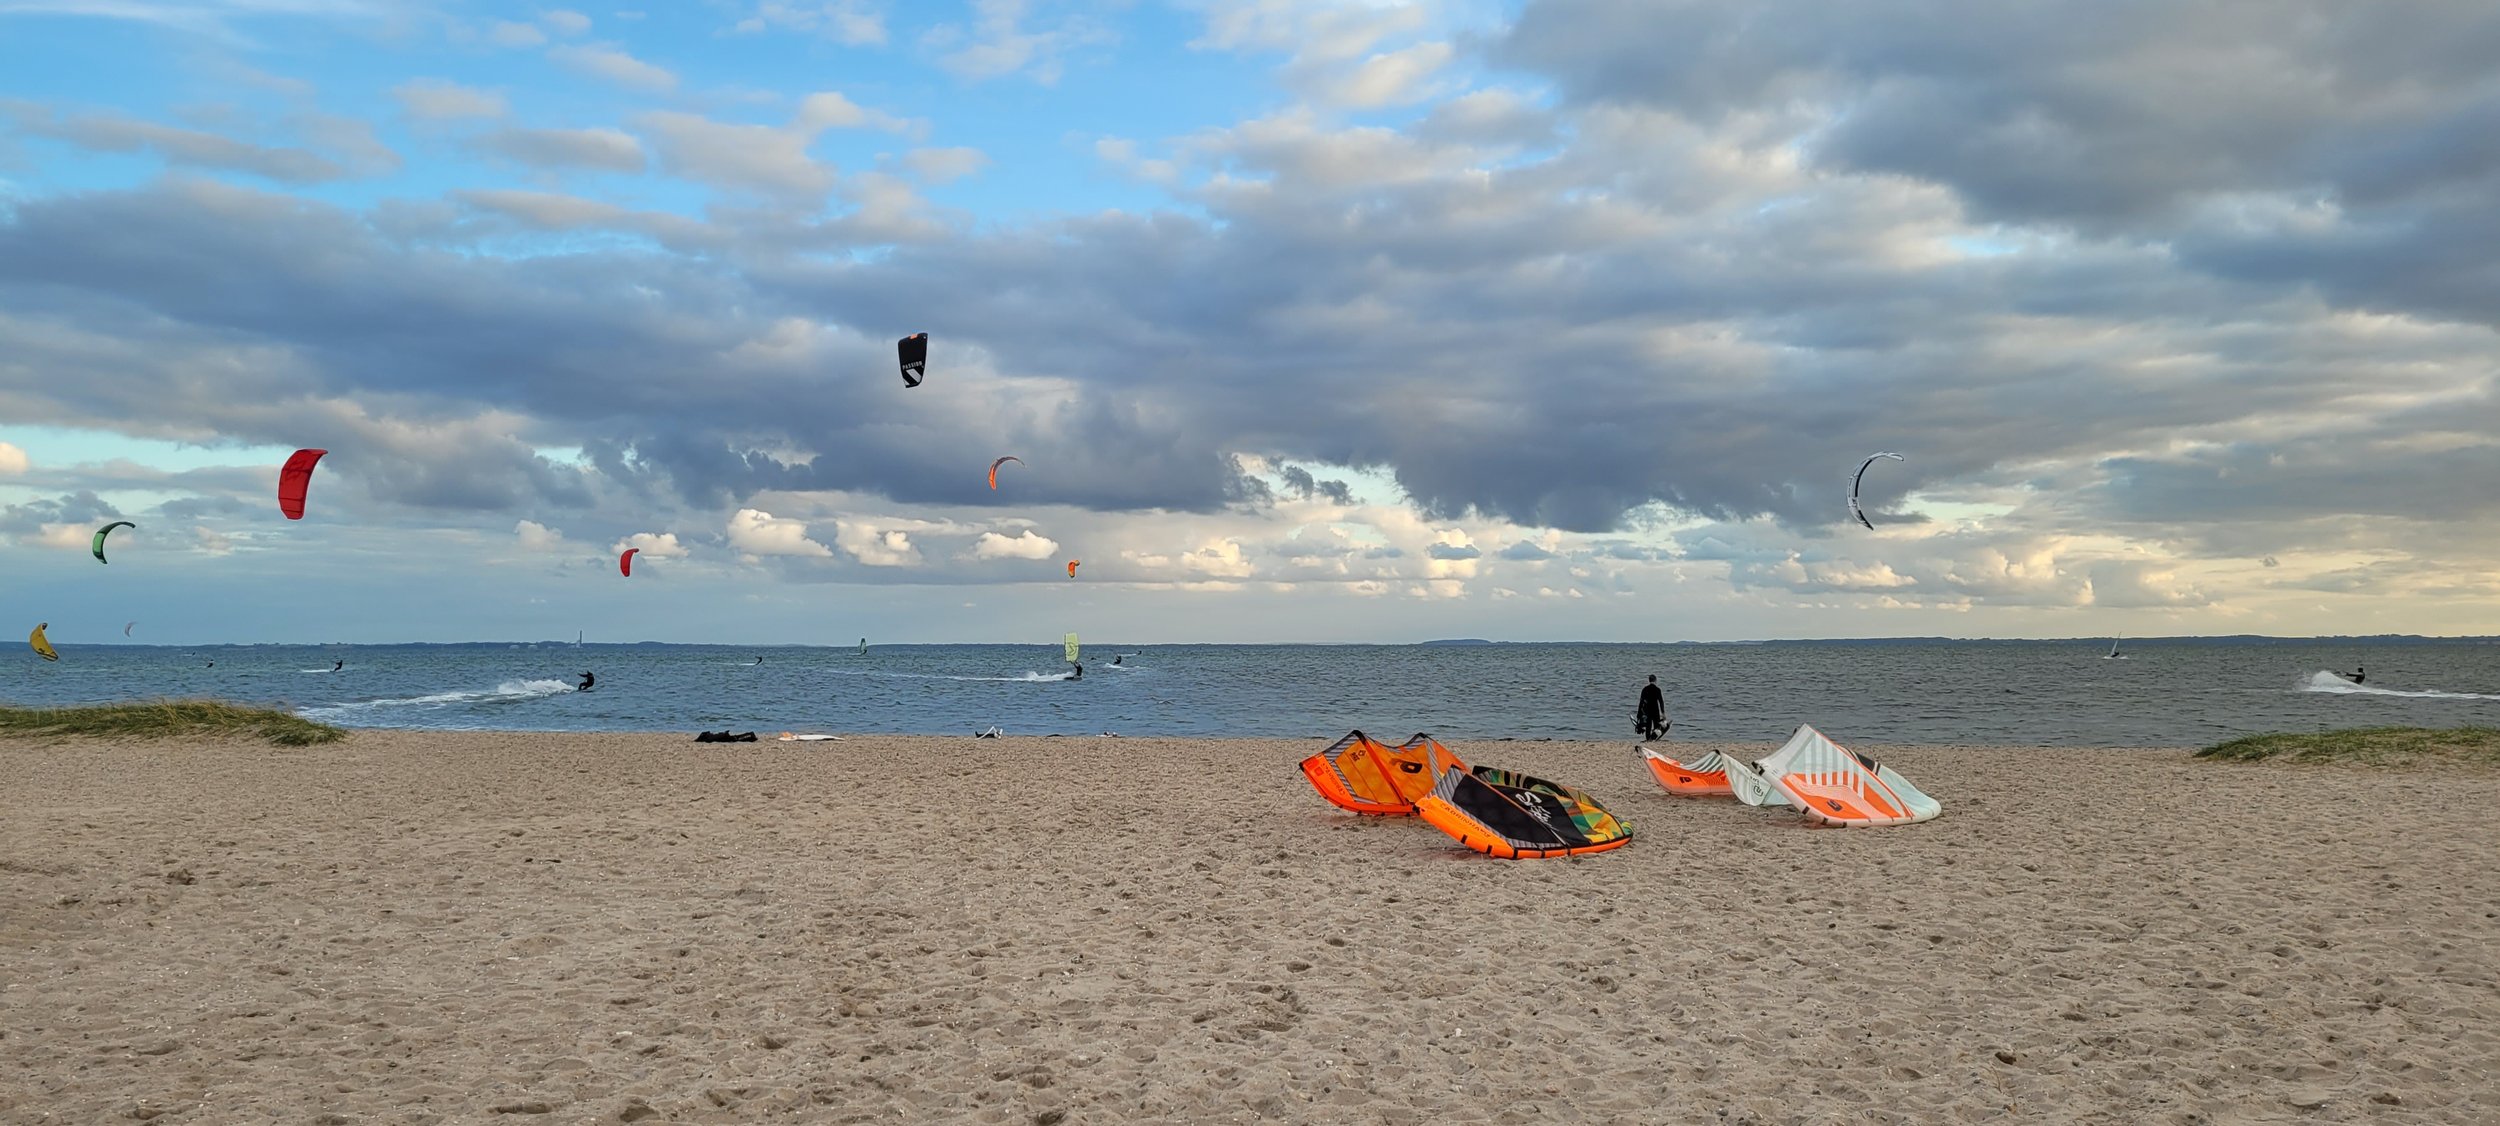
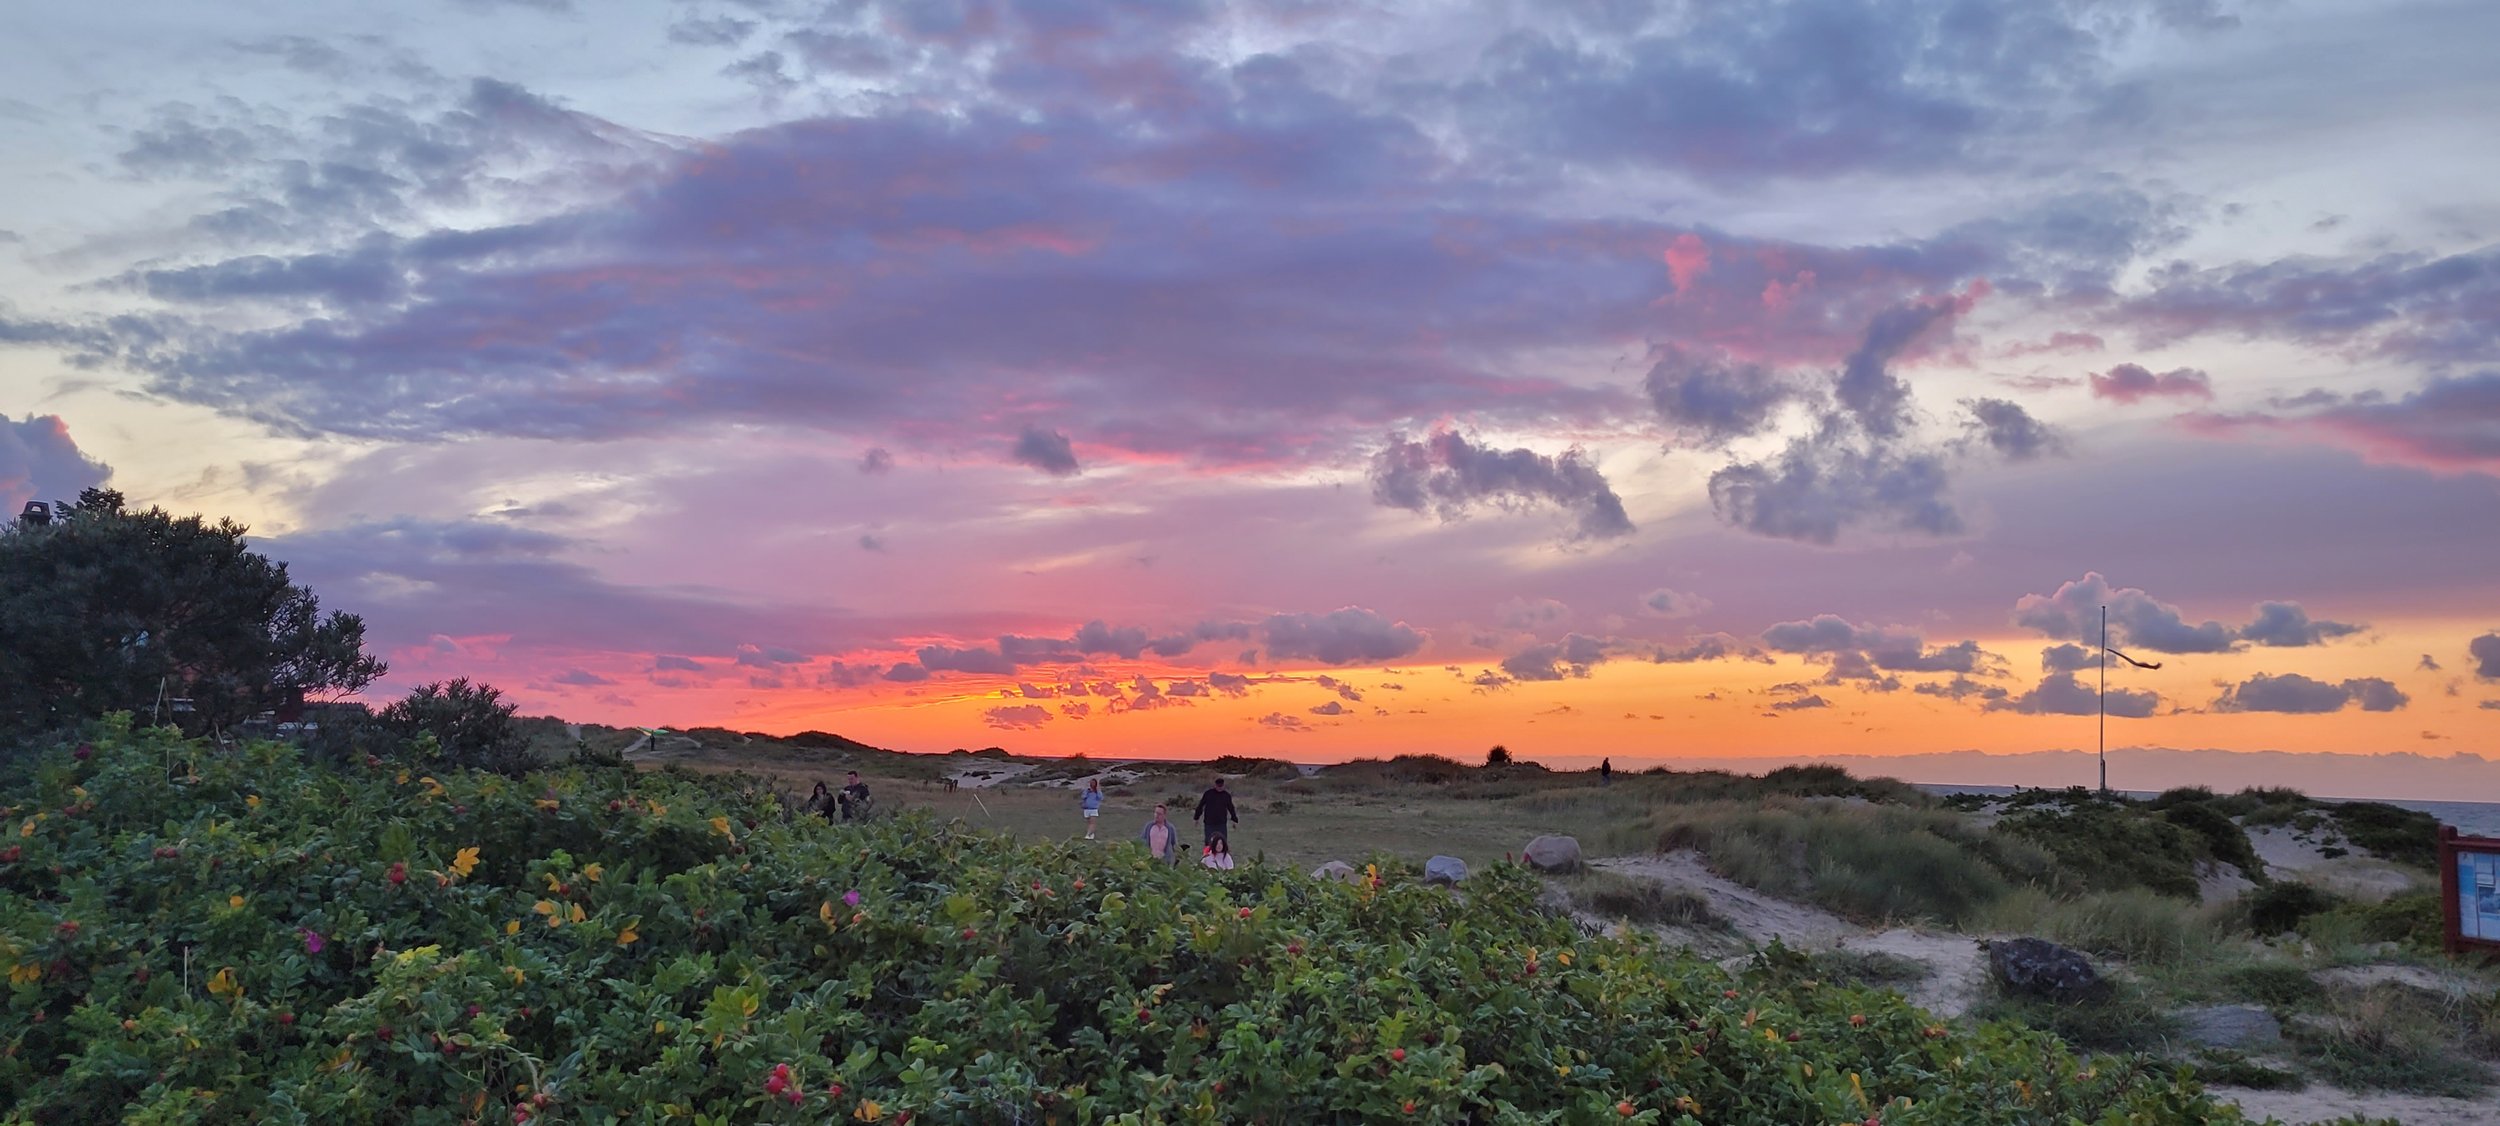
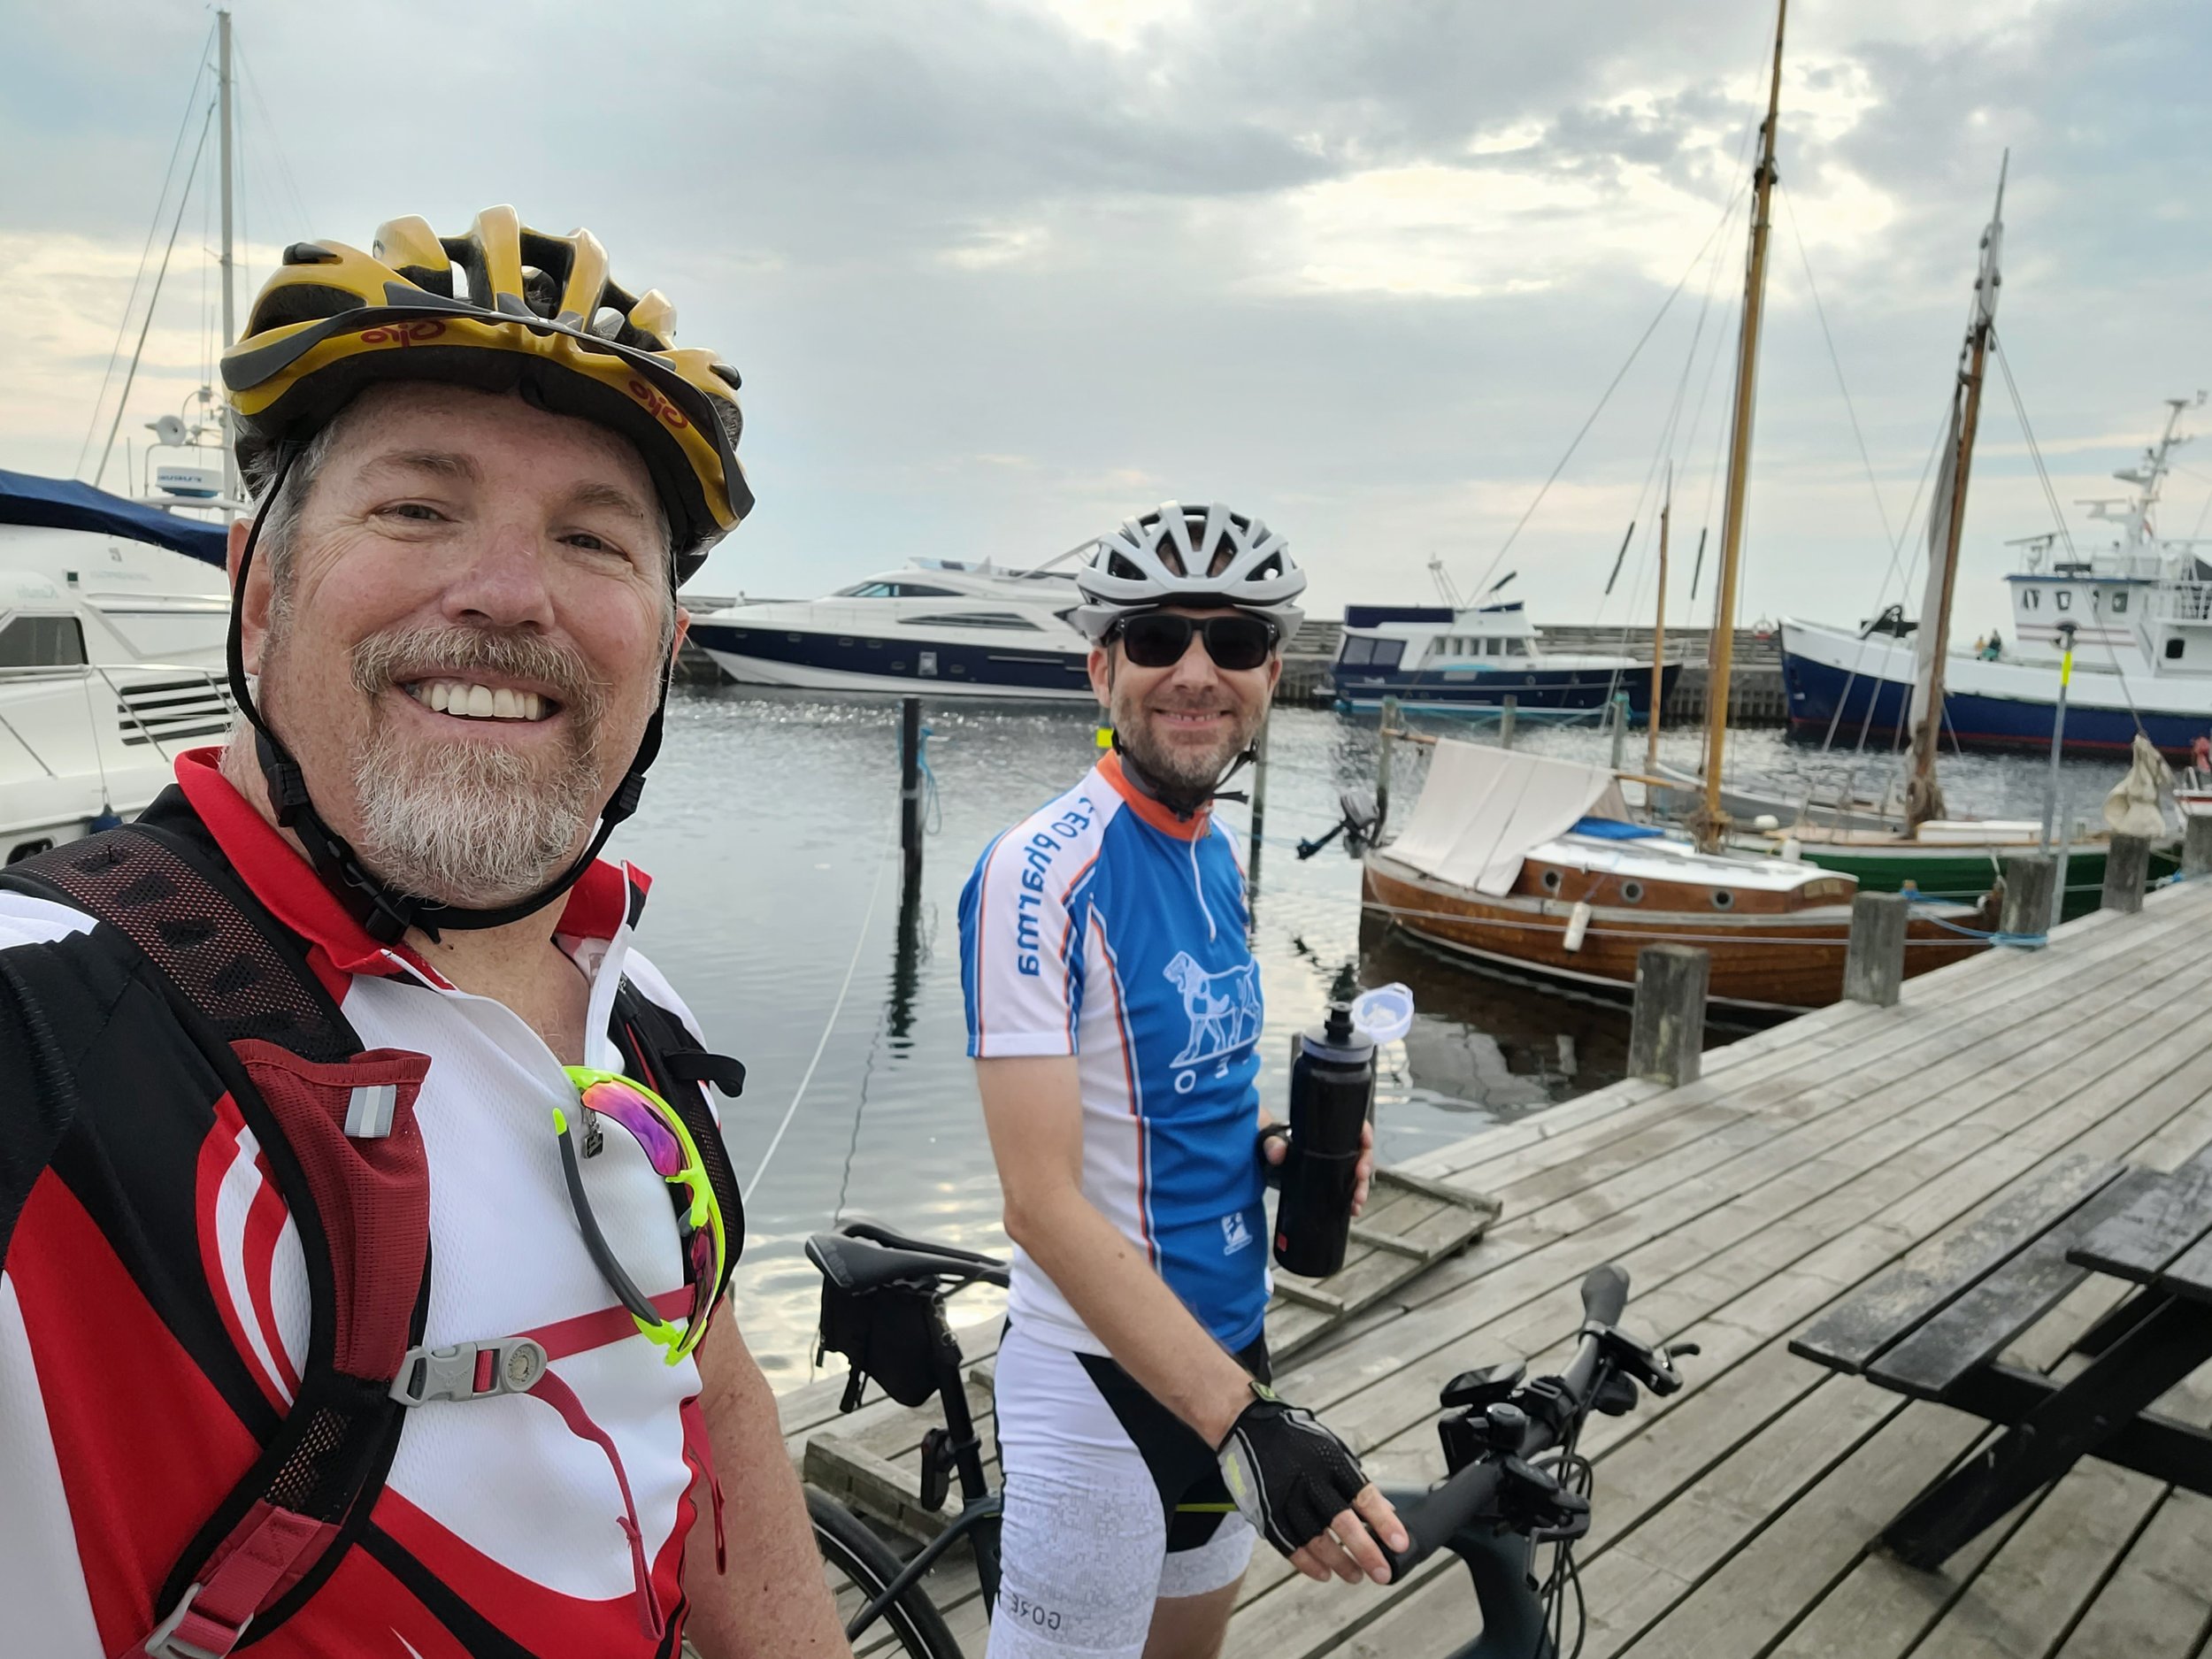
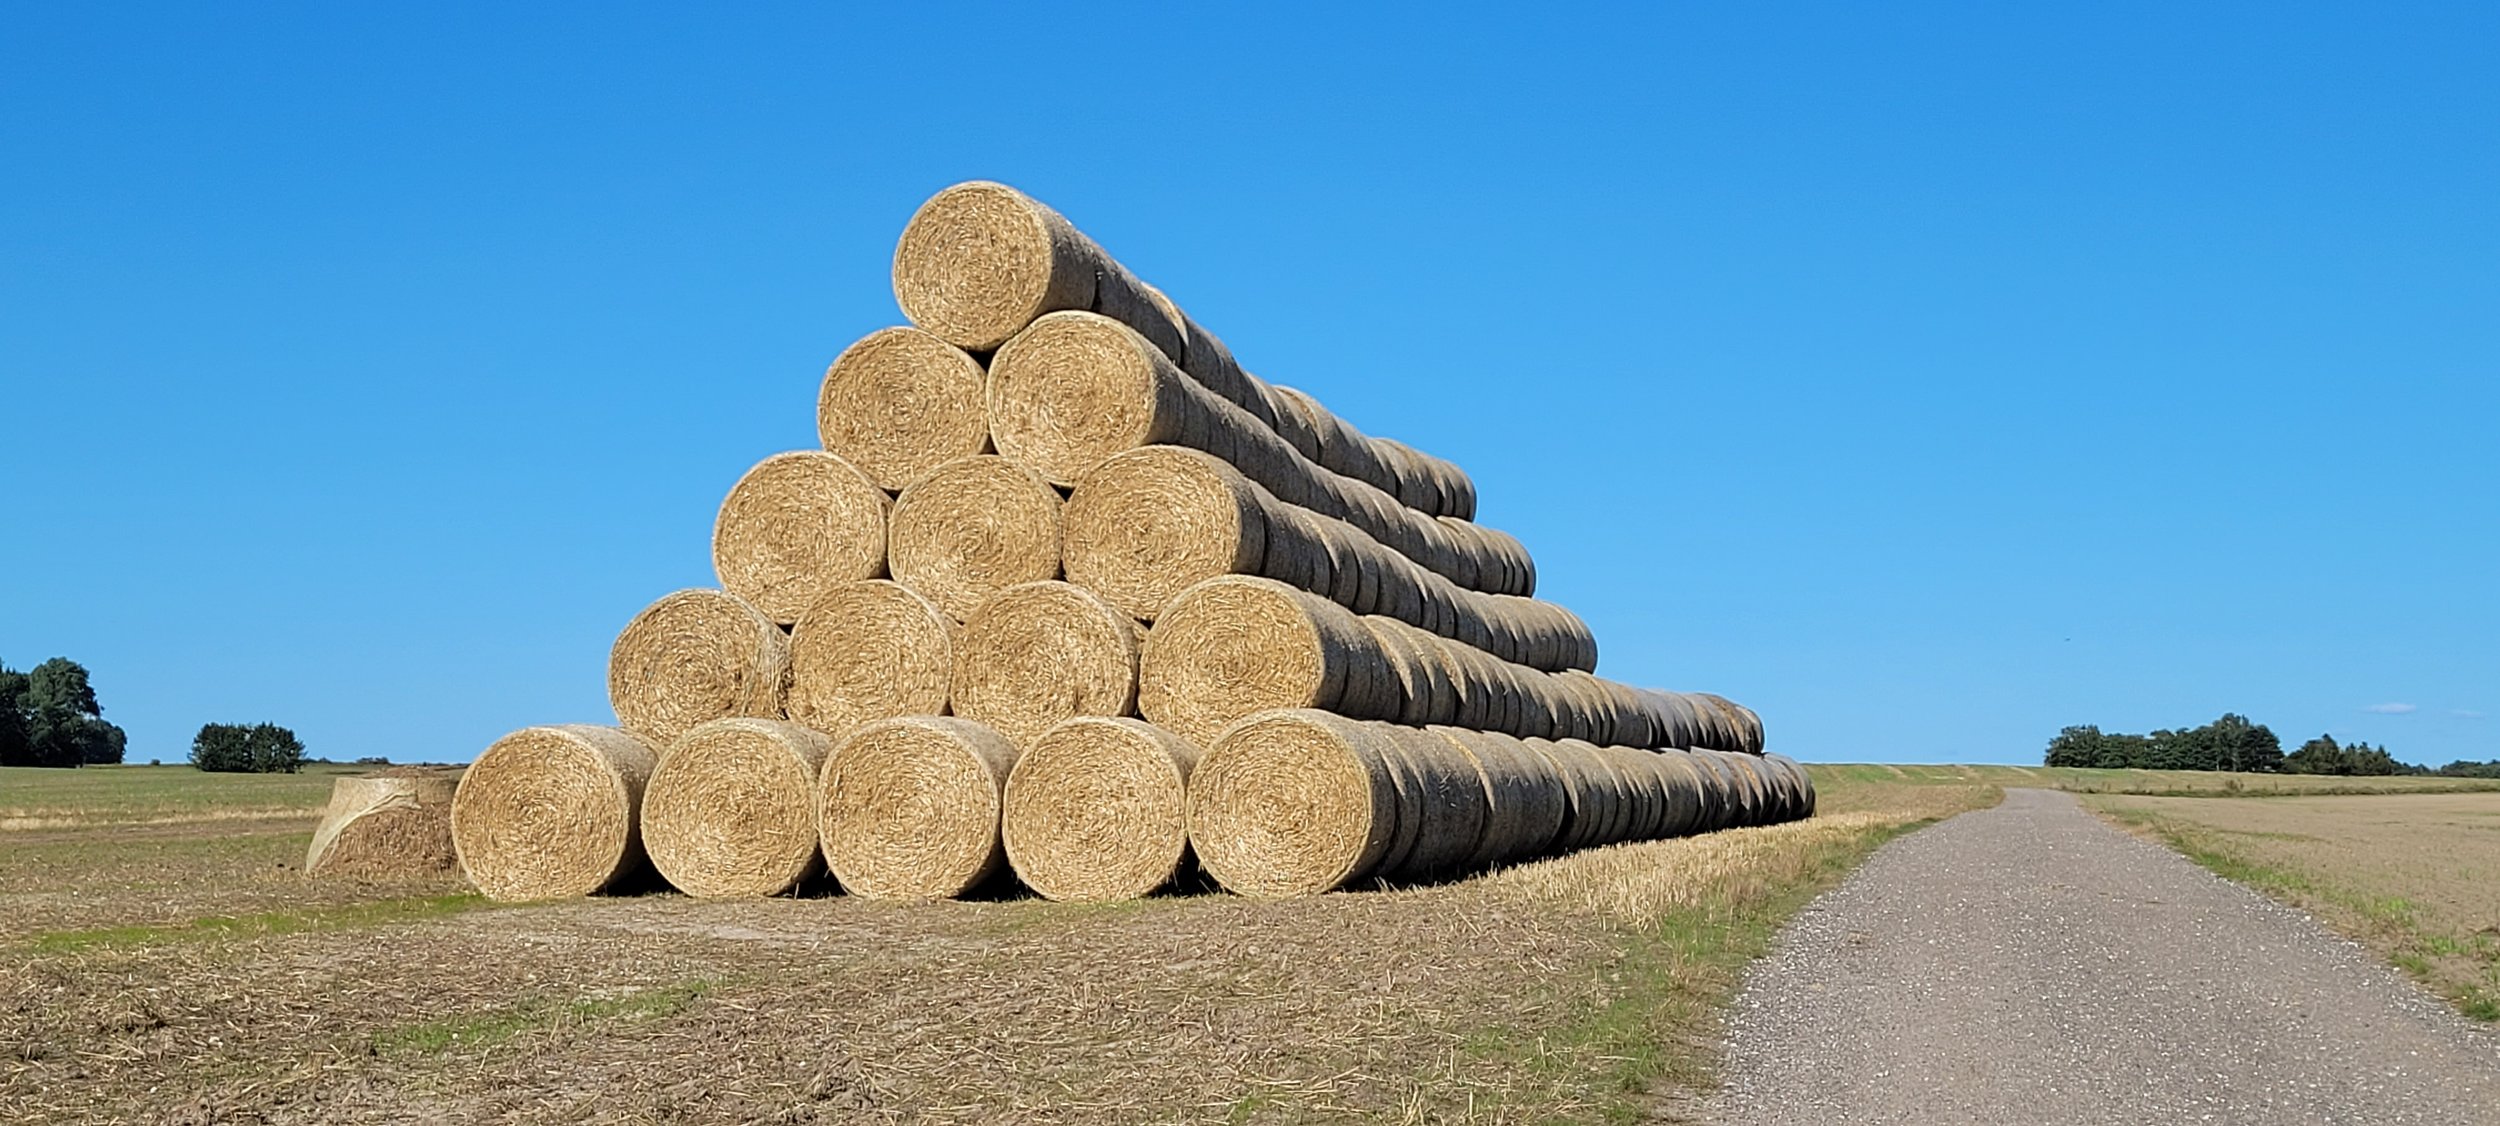
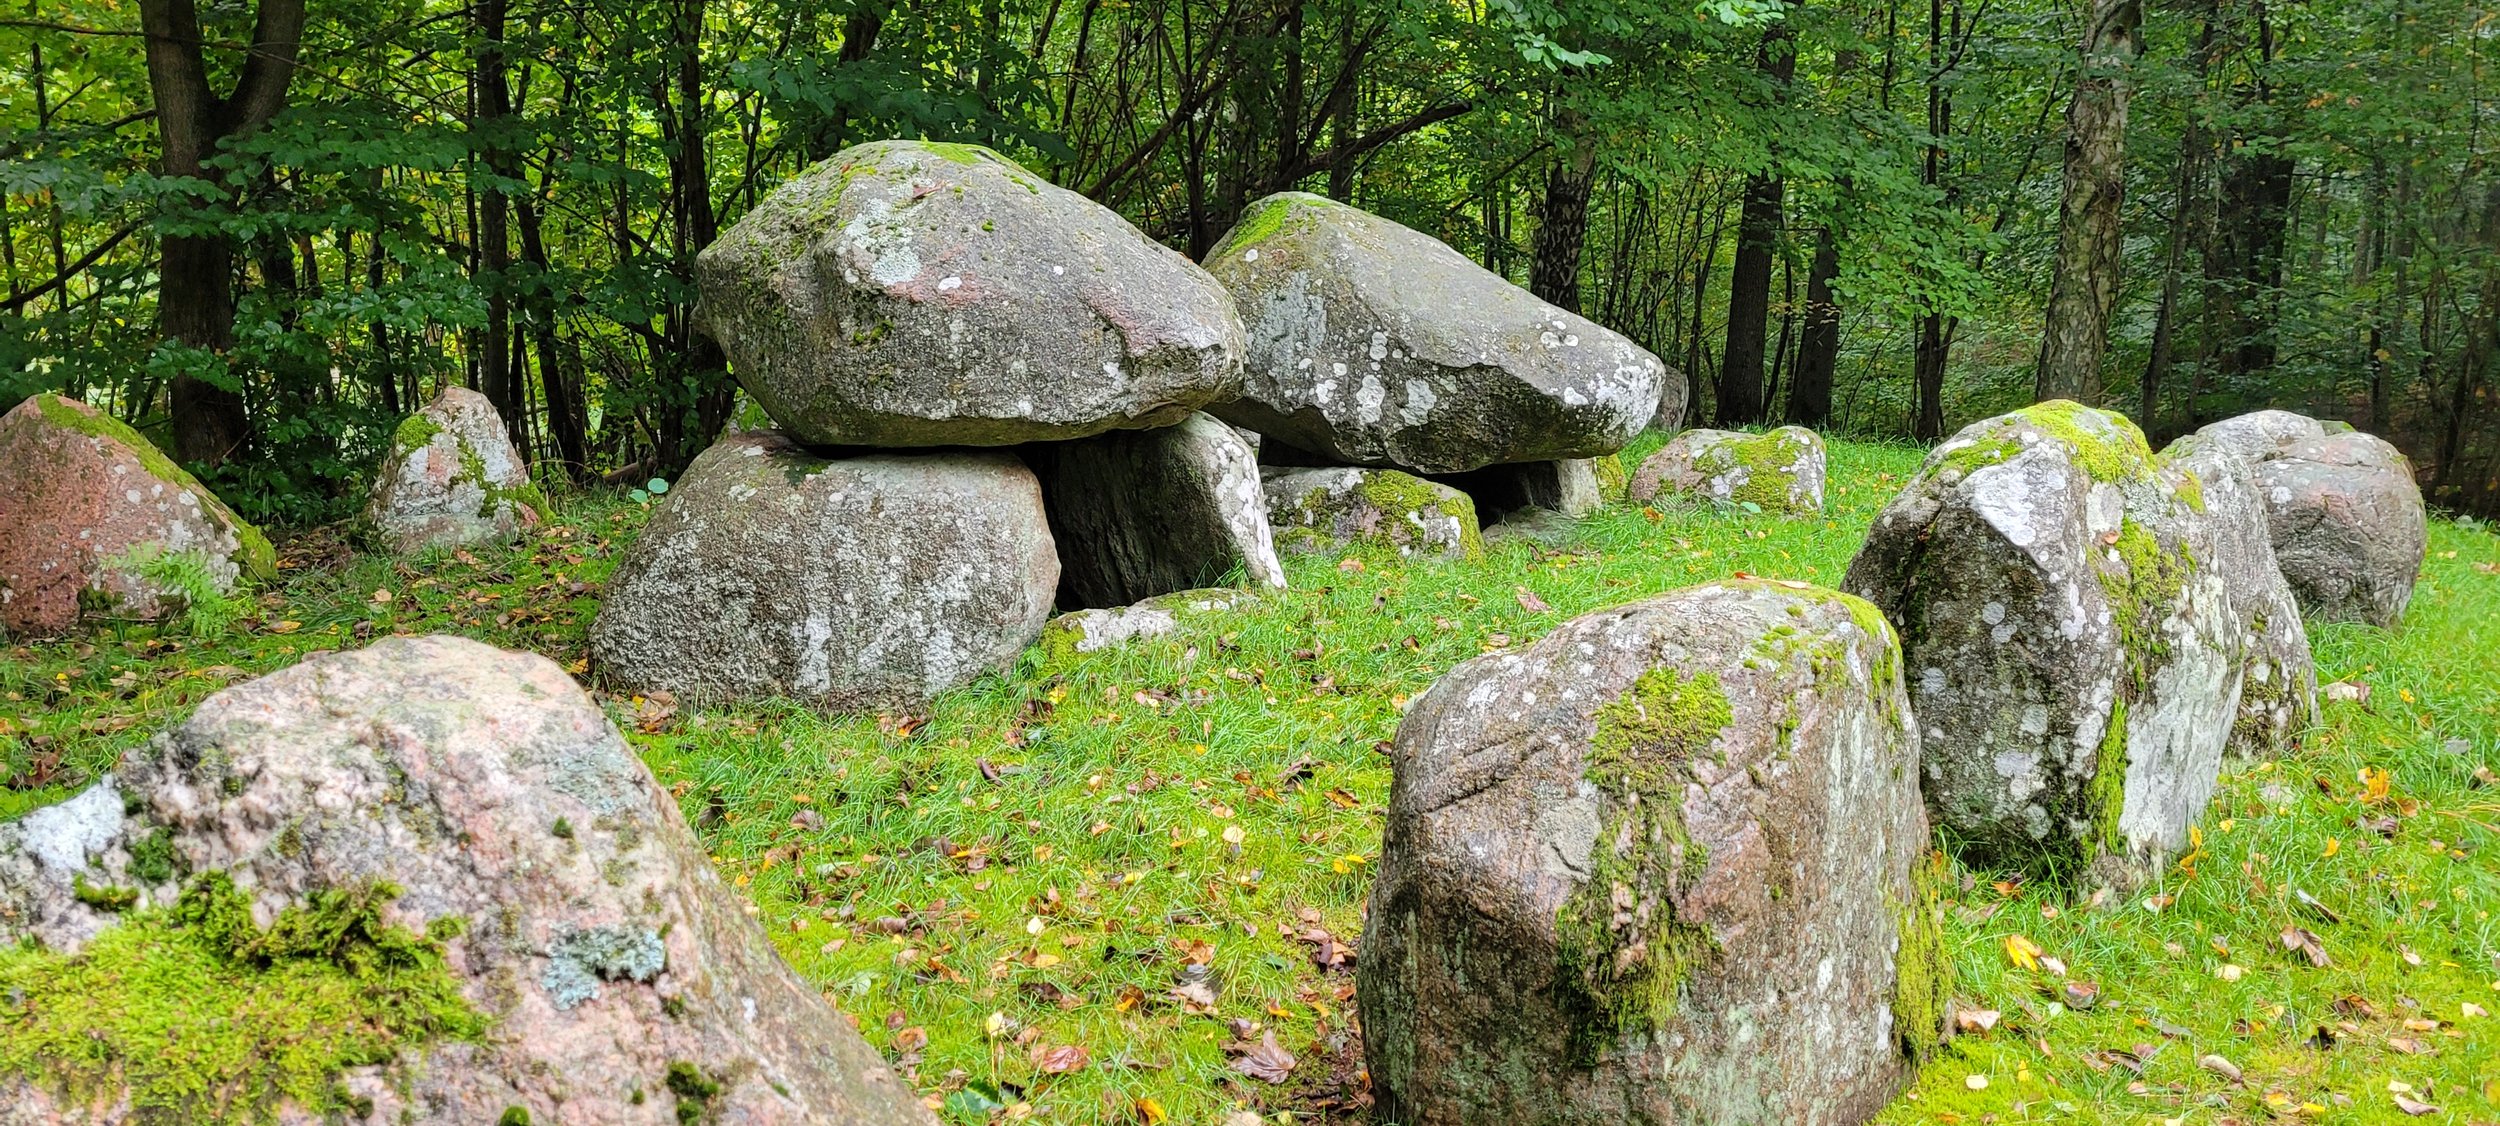
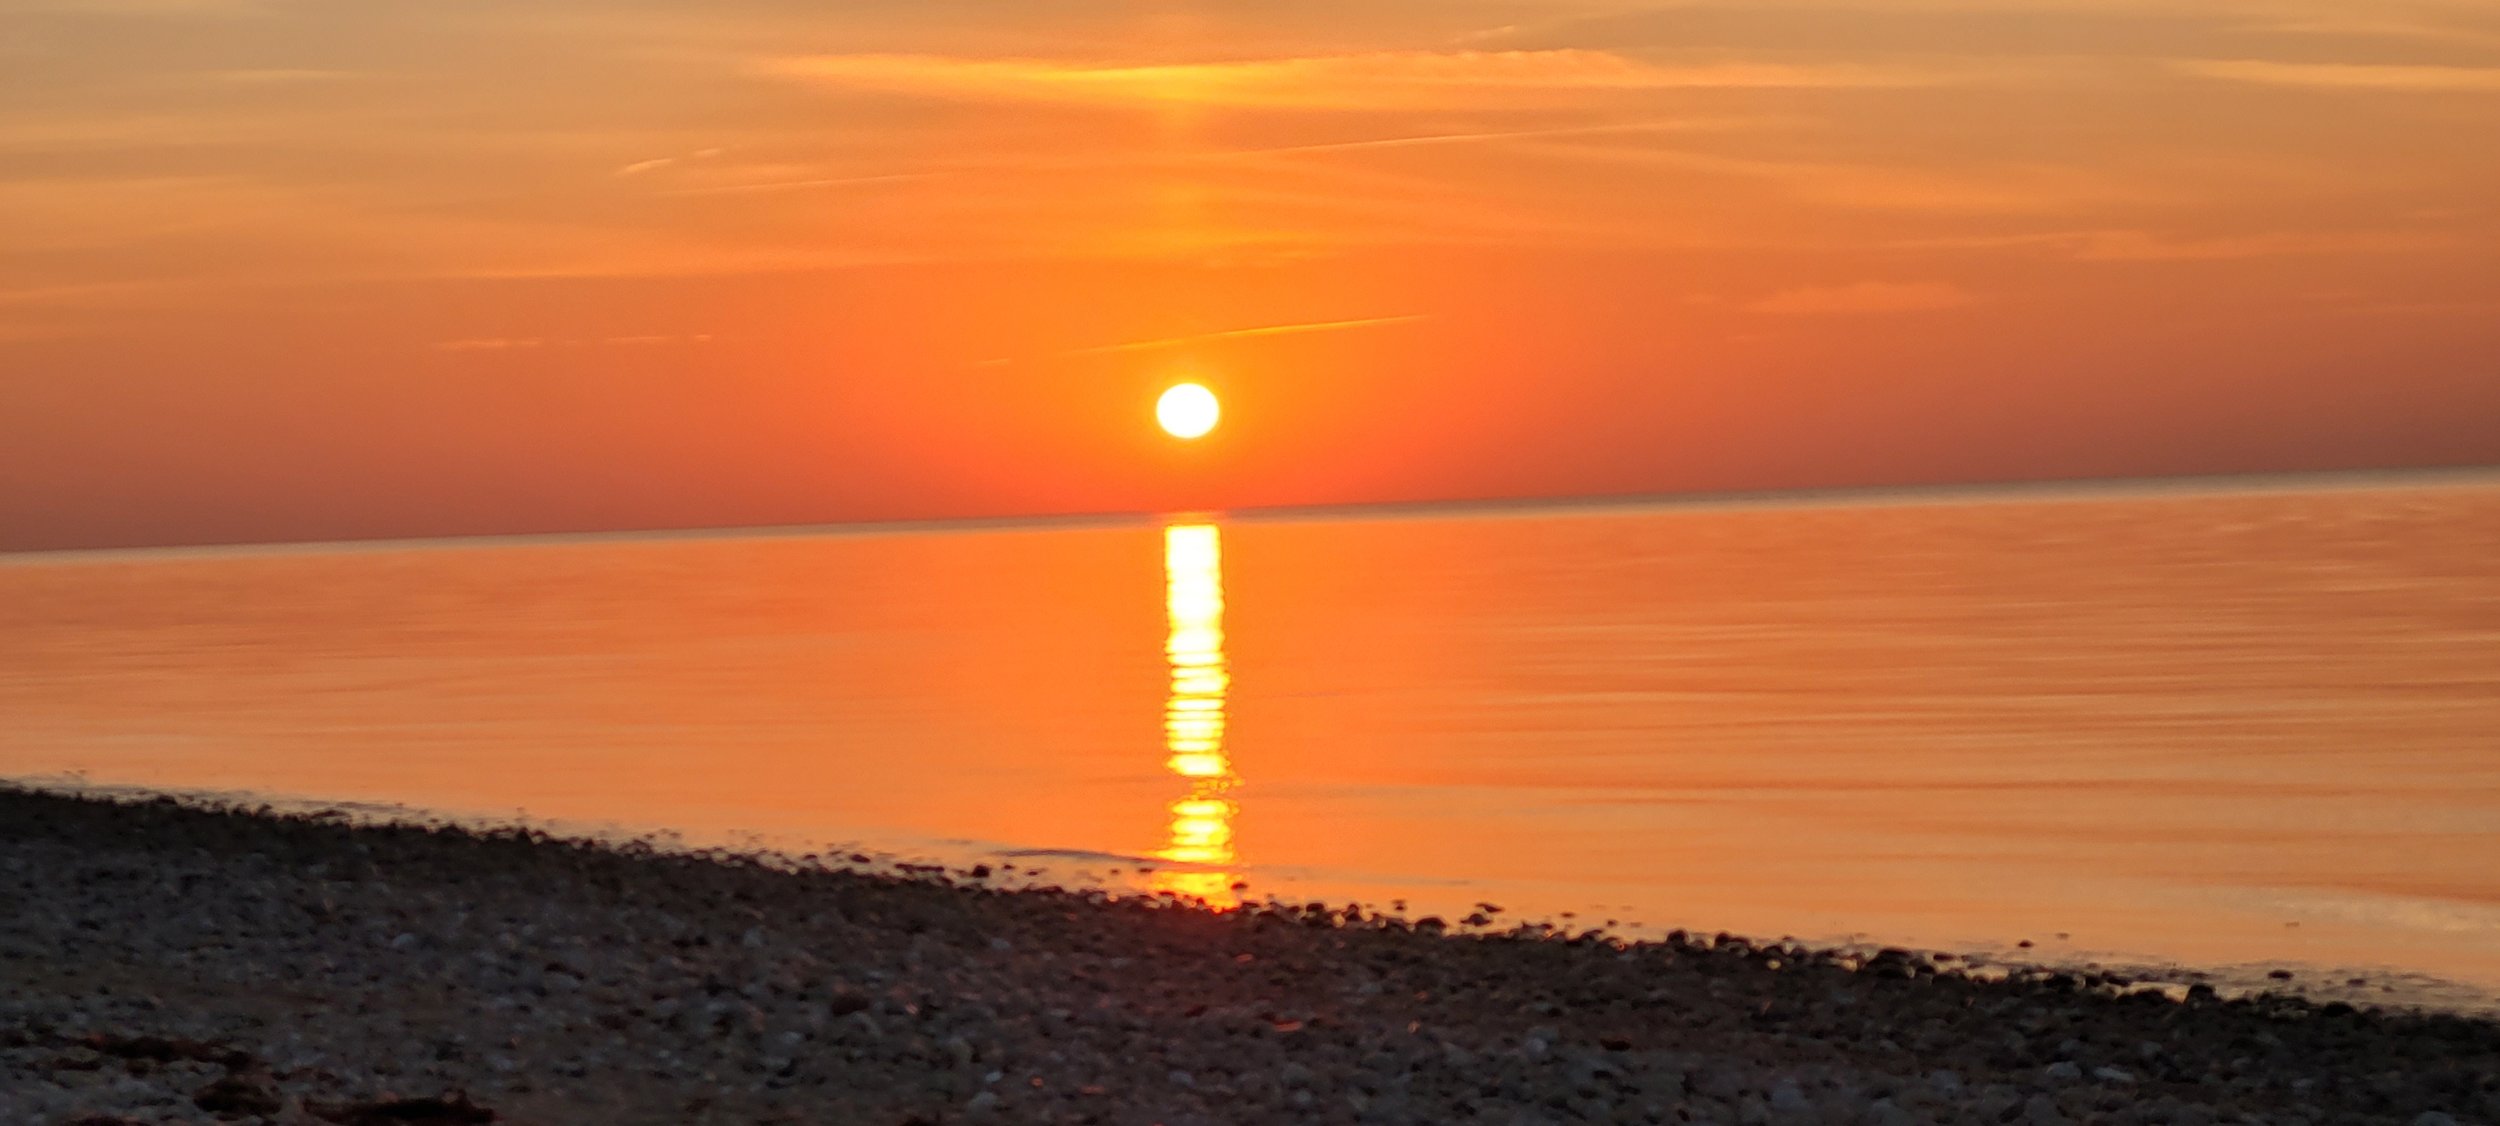
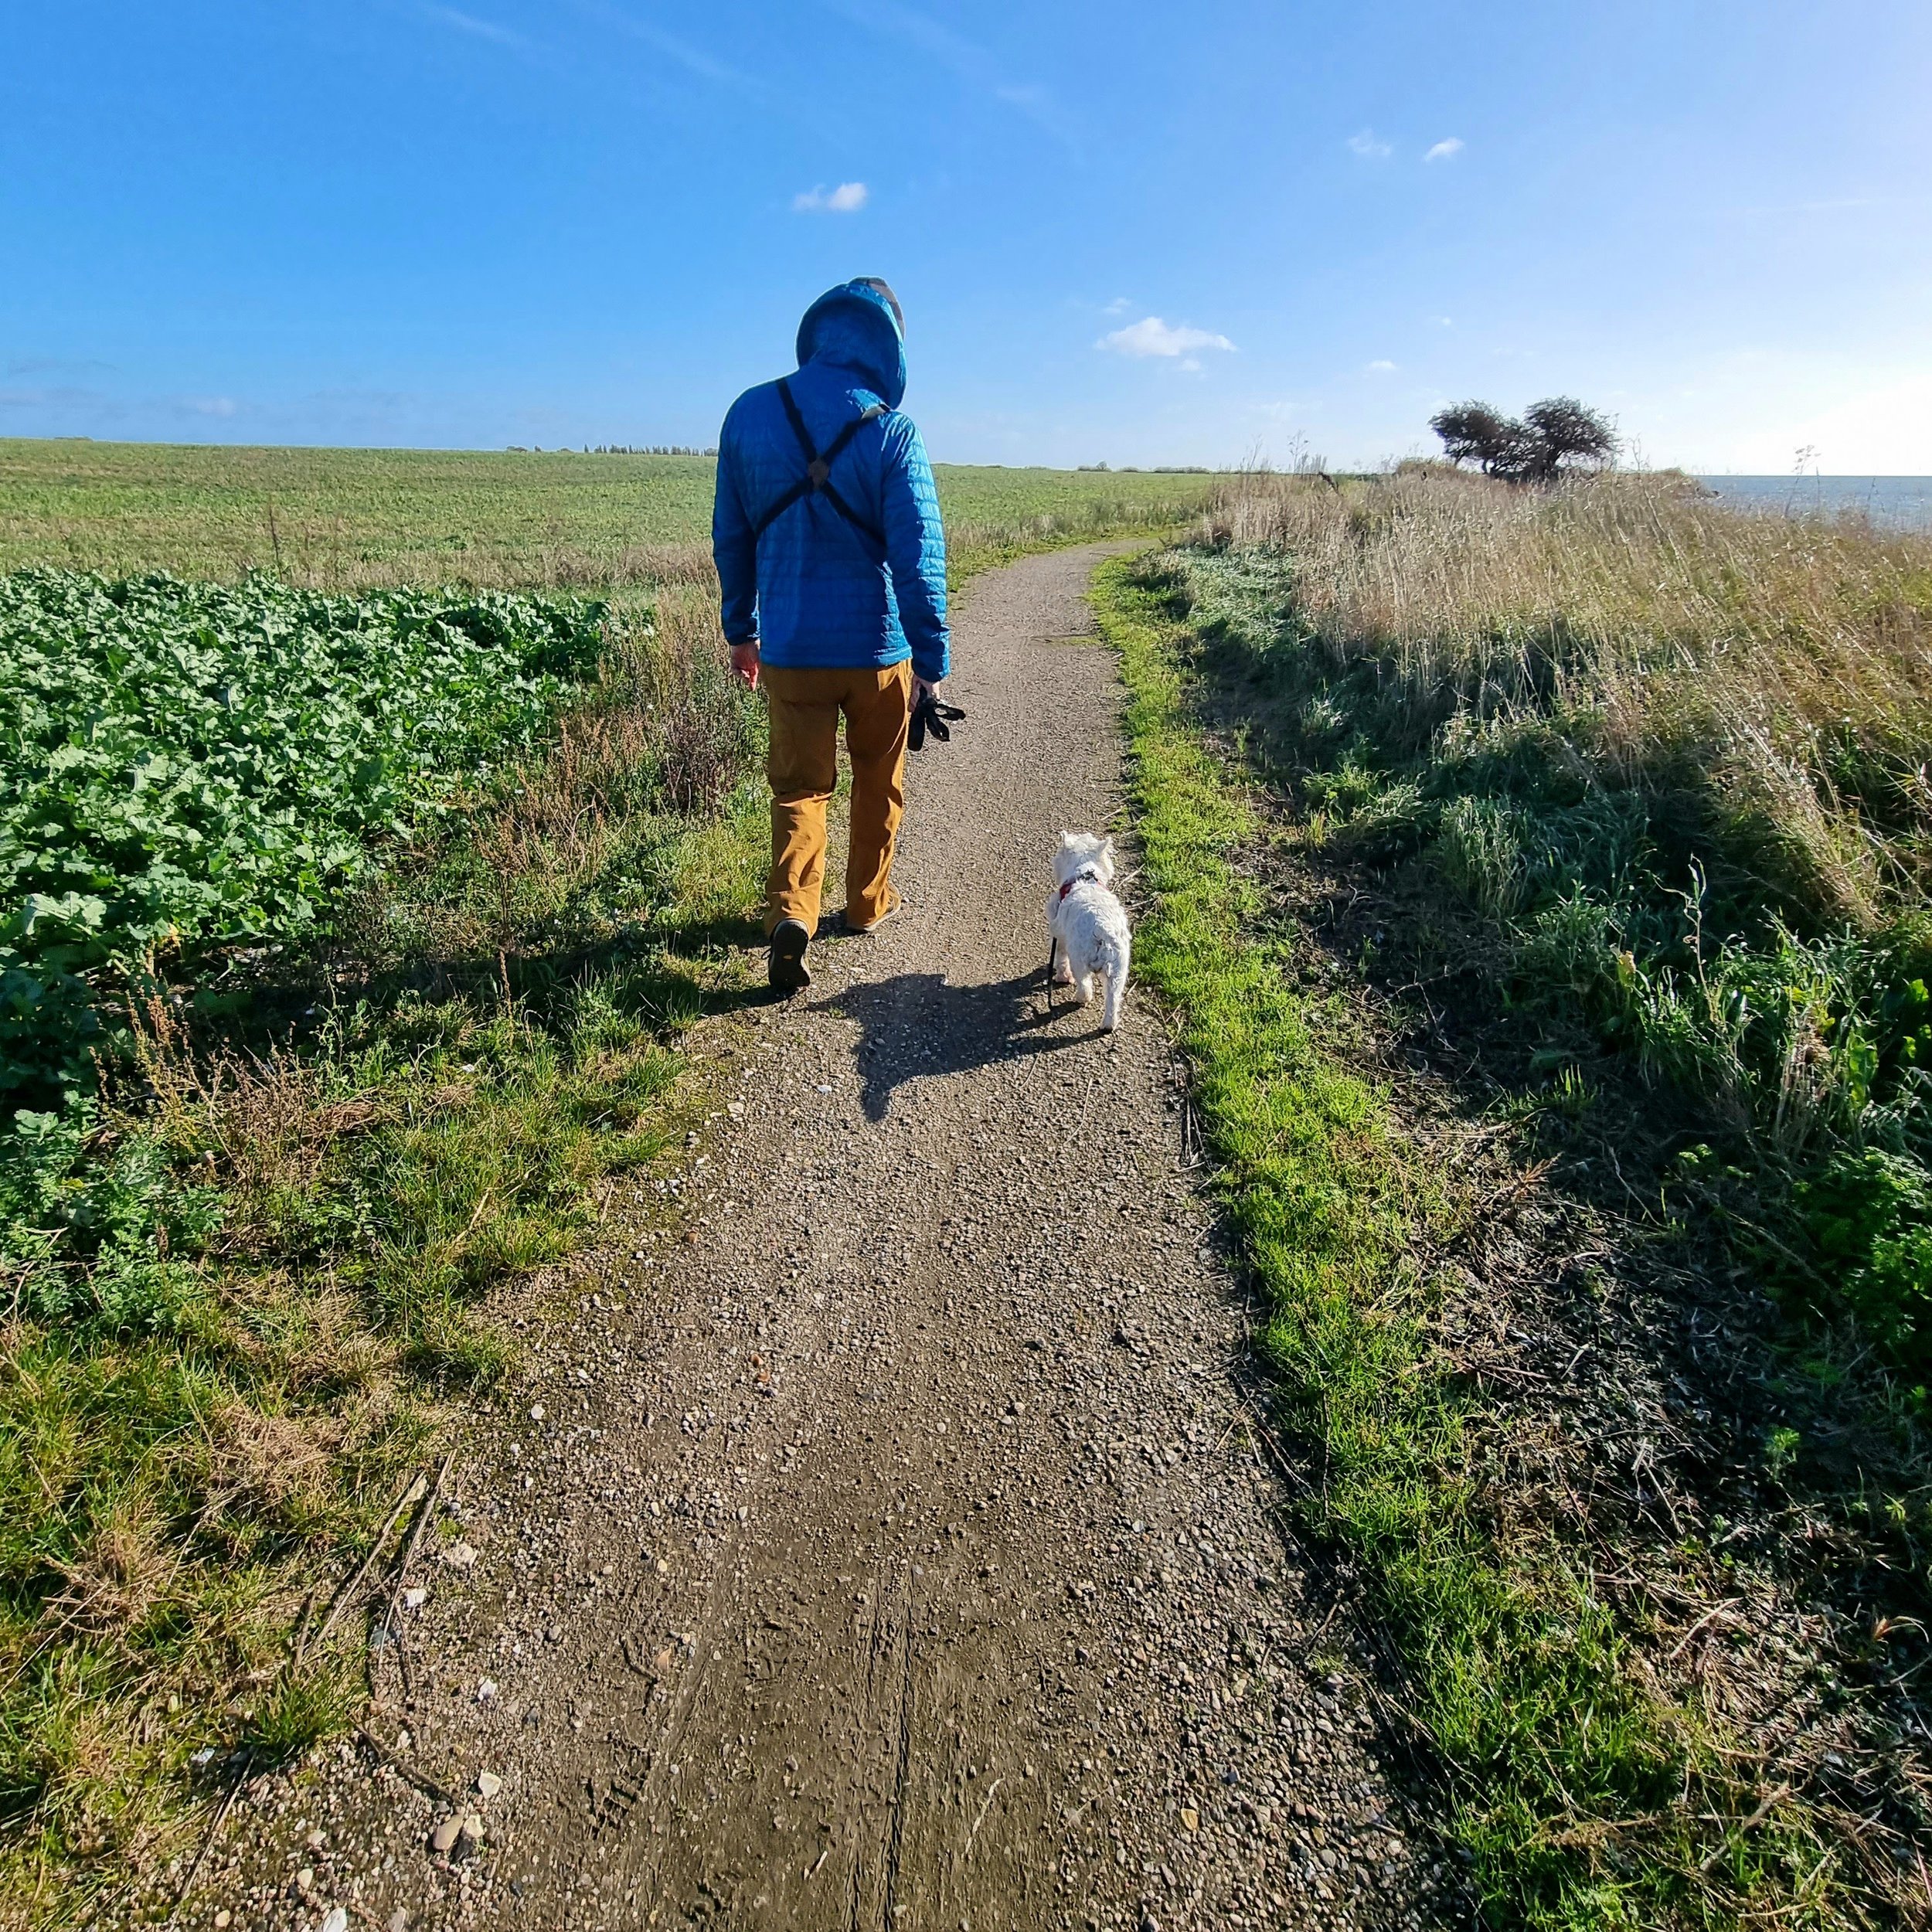
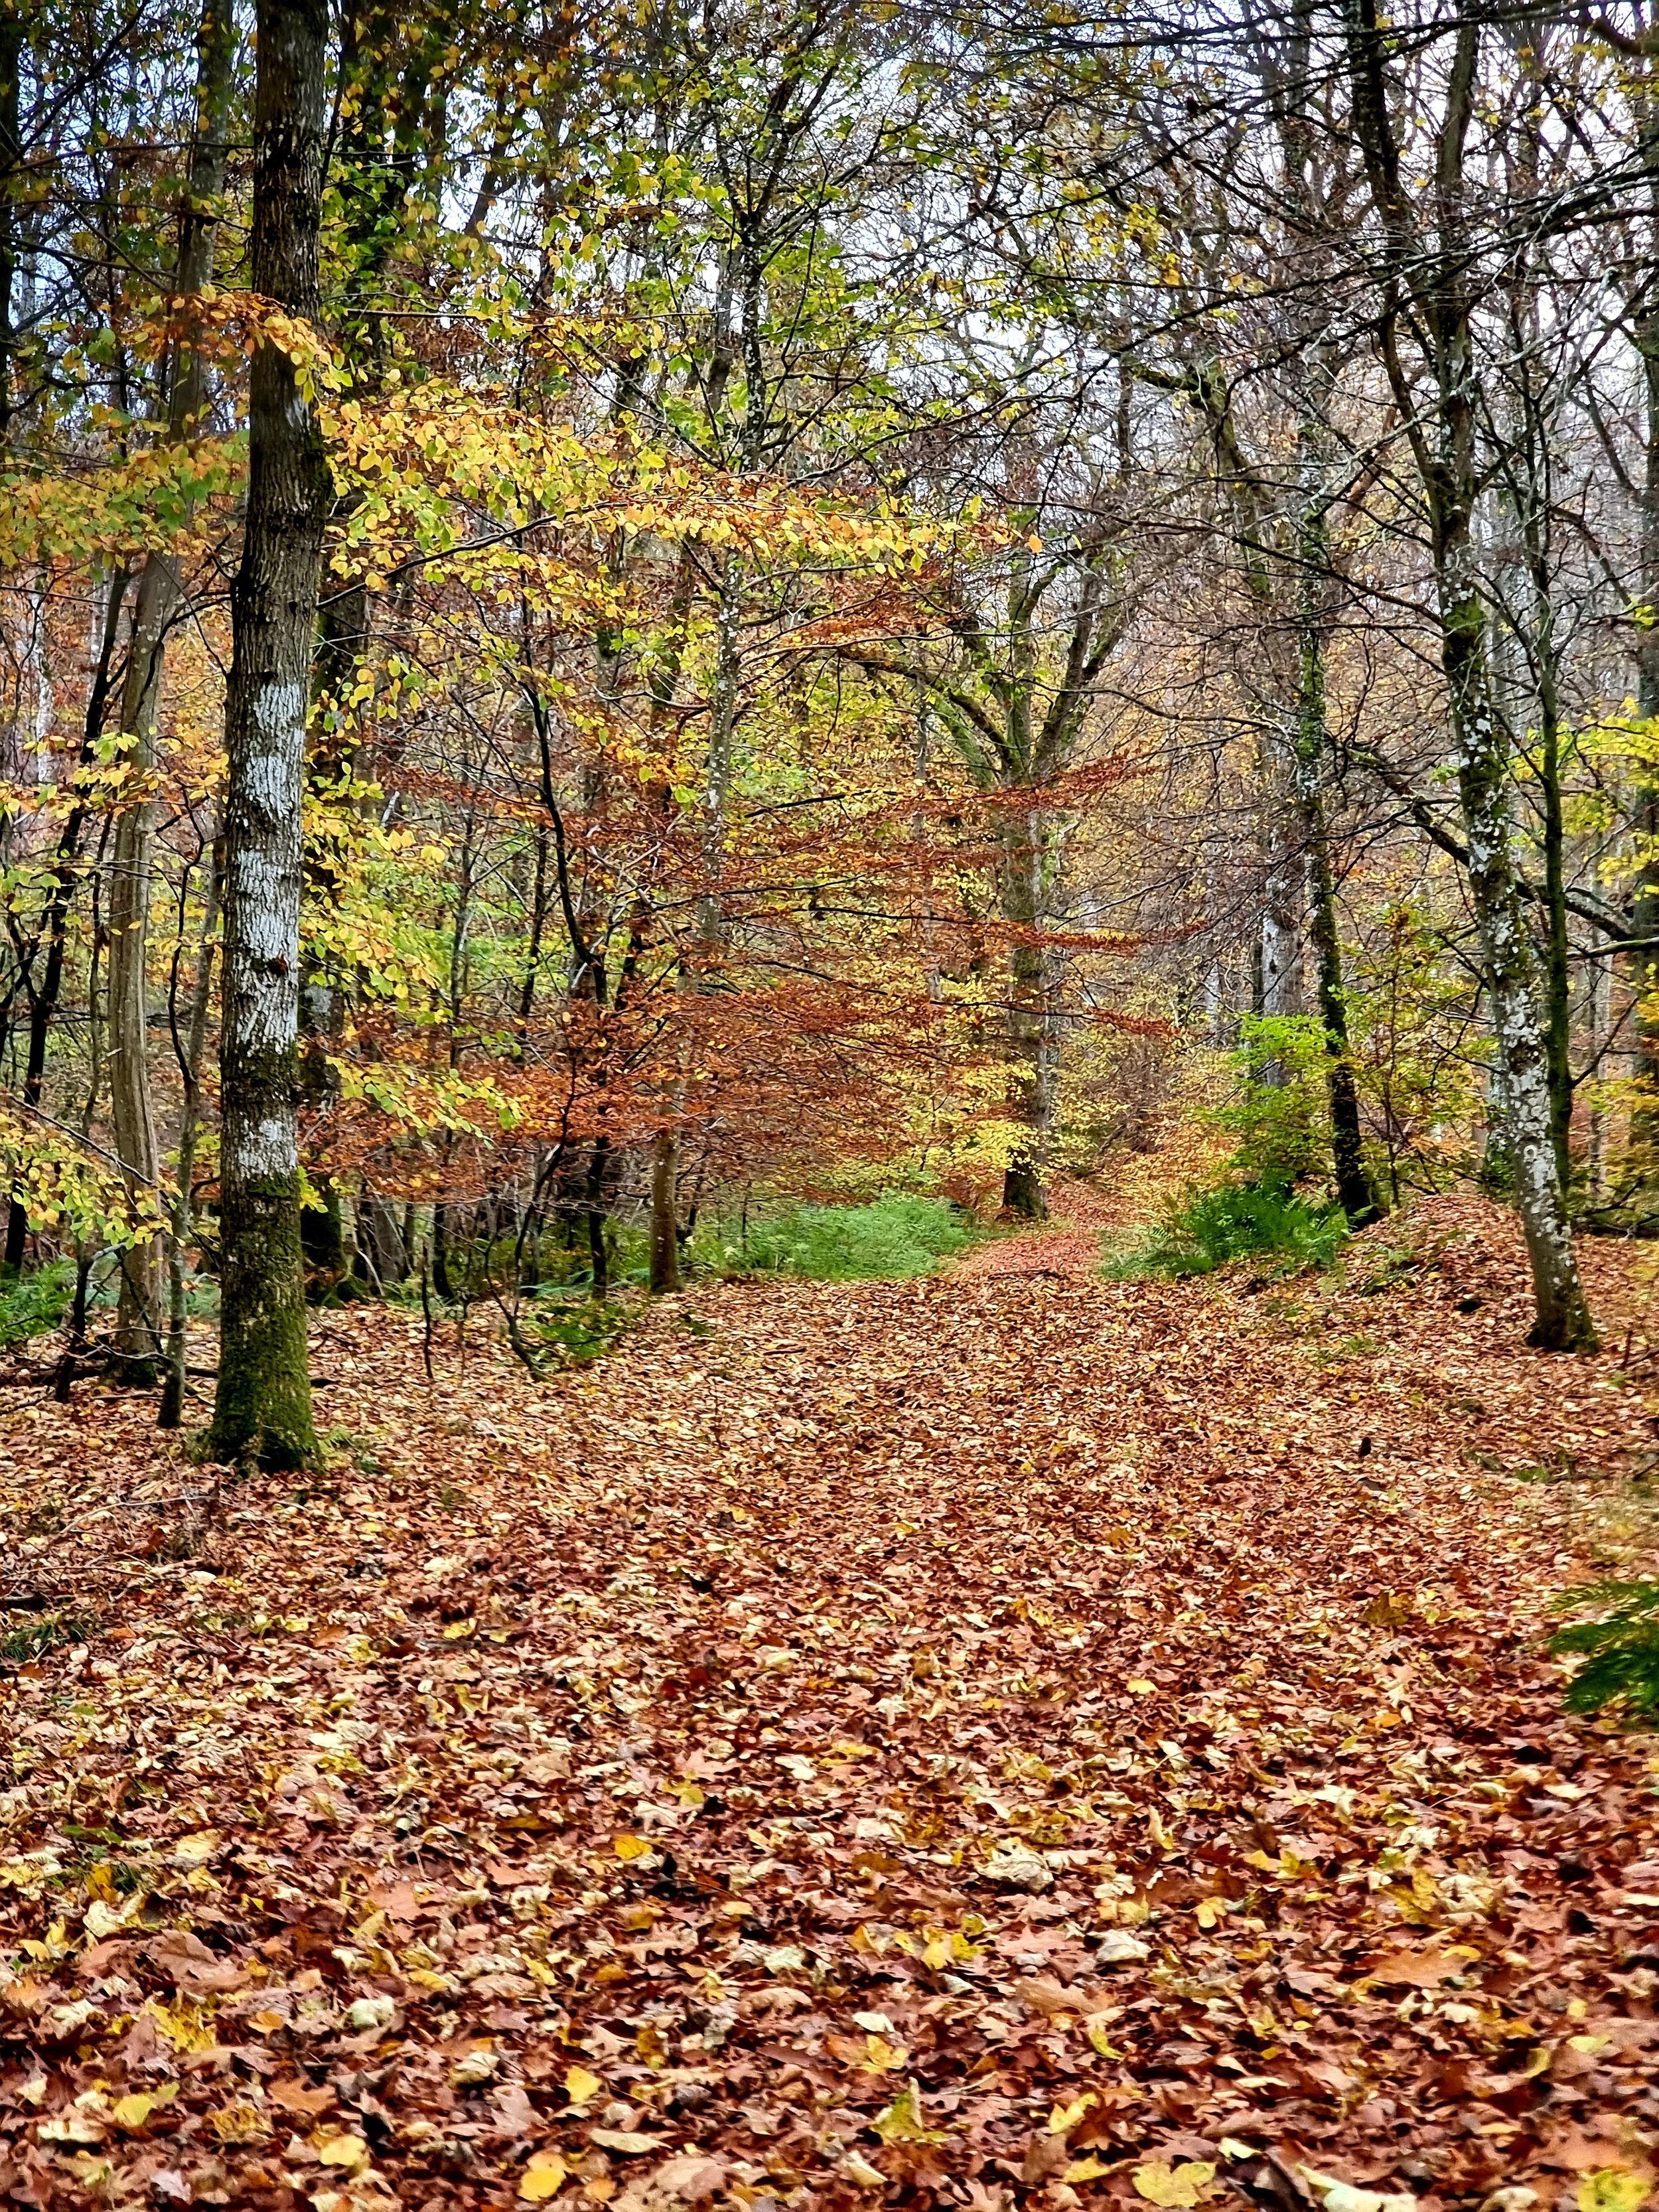
It is so easy to access nature here. We spend a lot of time going for walks along one of the nearby beaches, going on bike rides through the Danish countryside, exploring neolithic archaeological sites, and swimming in the sea. 

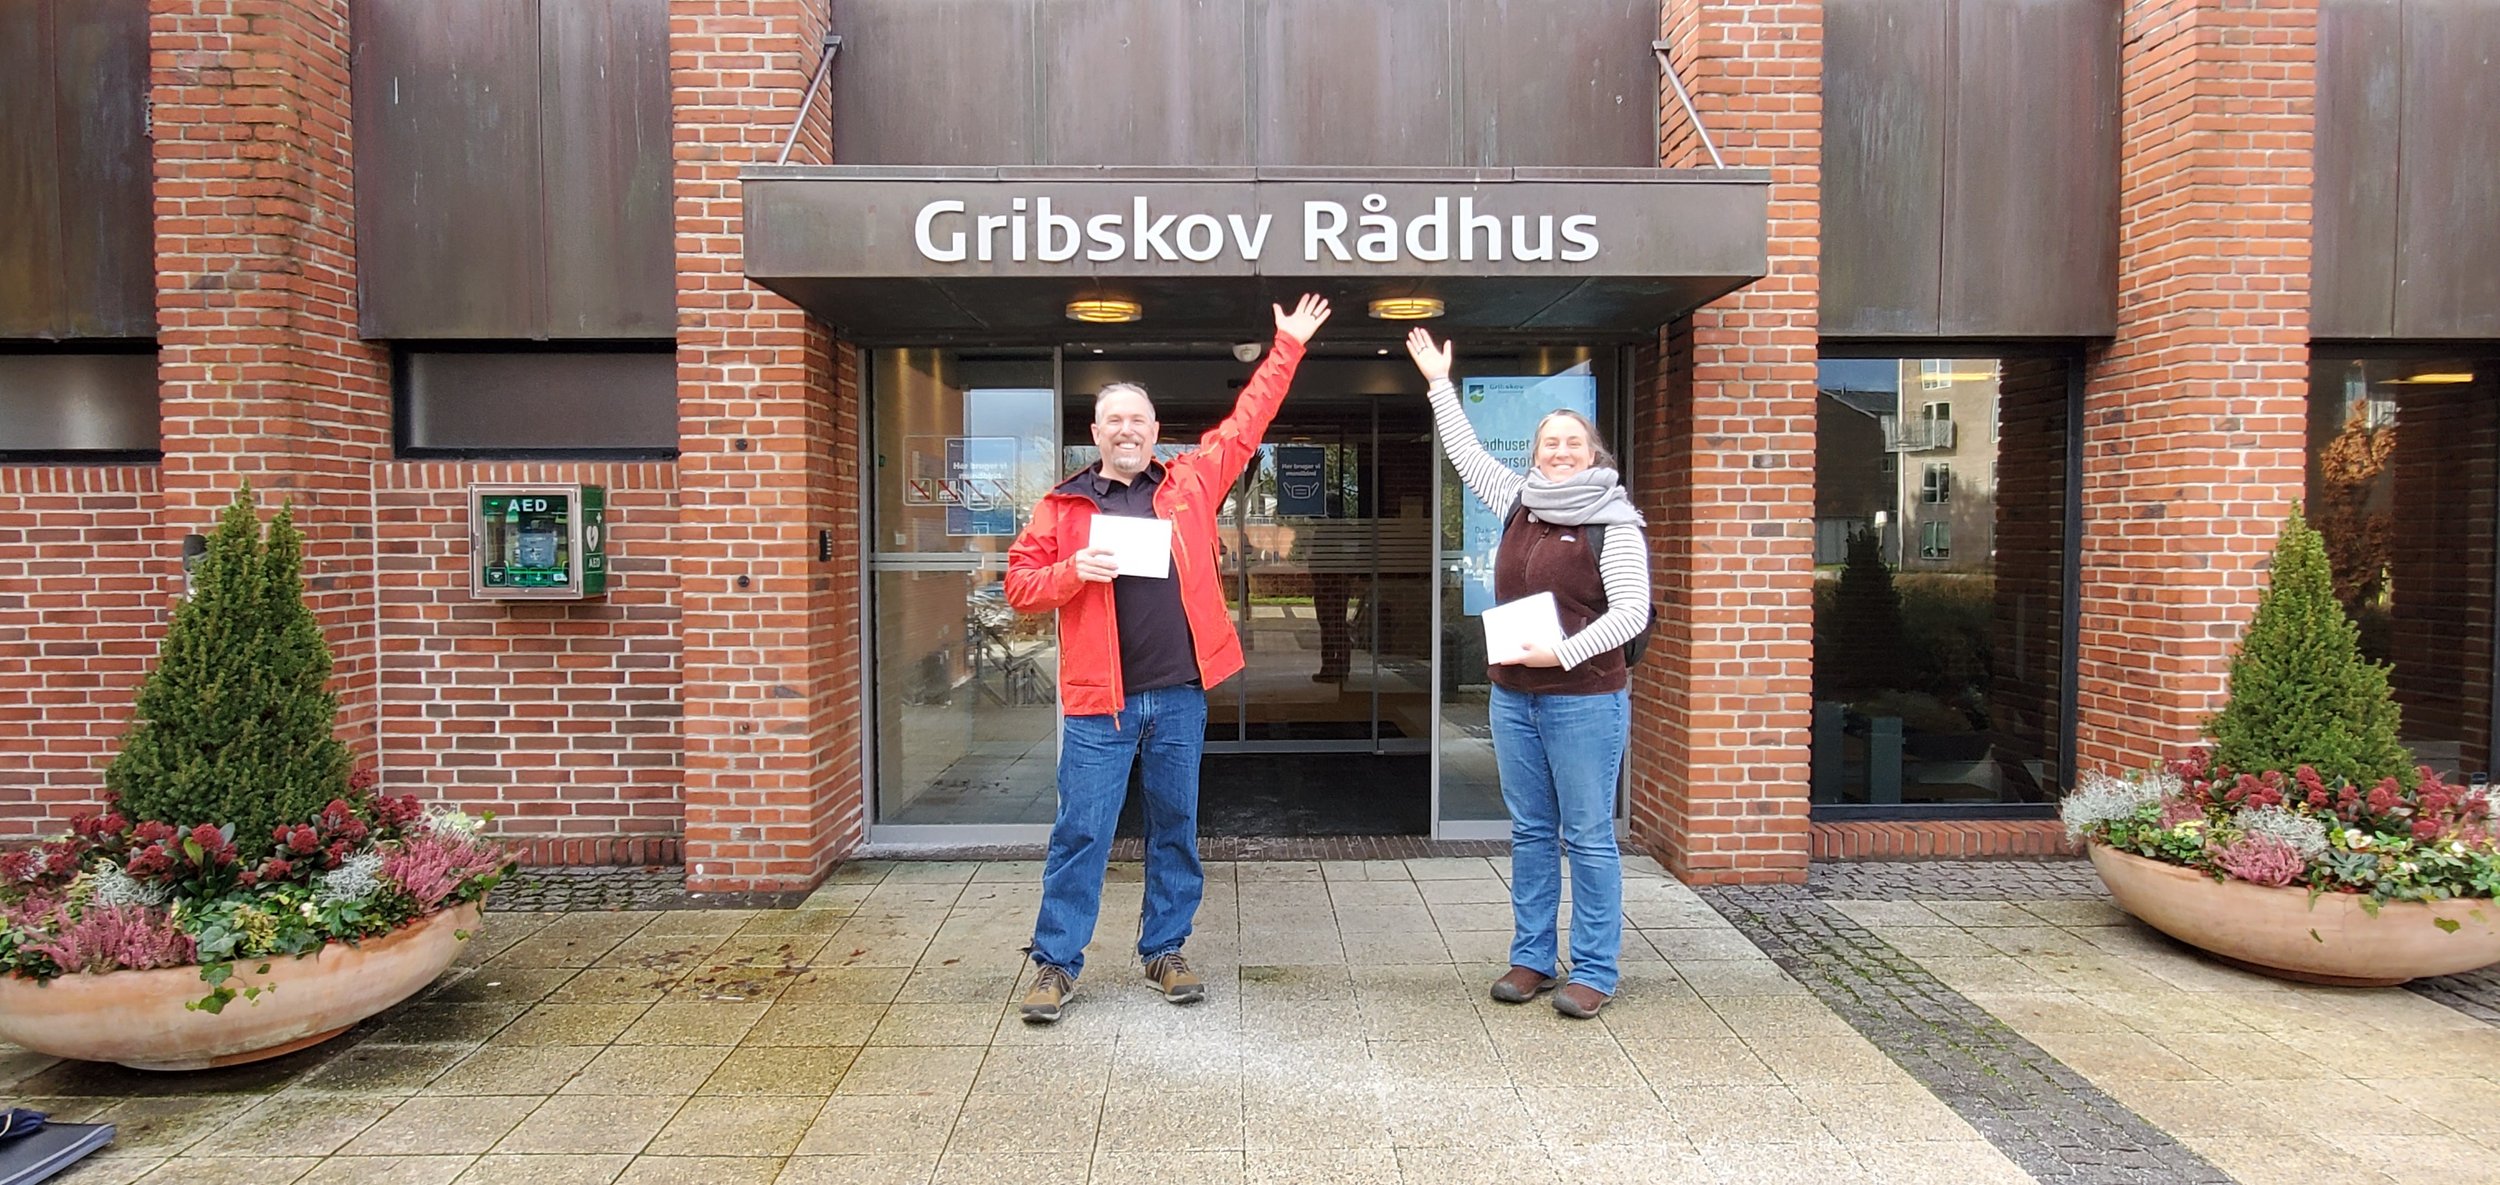
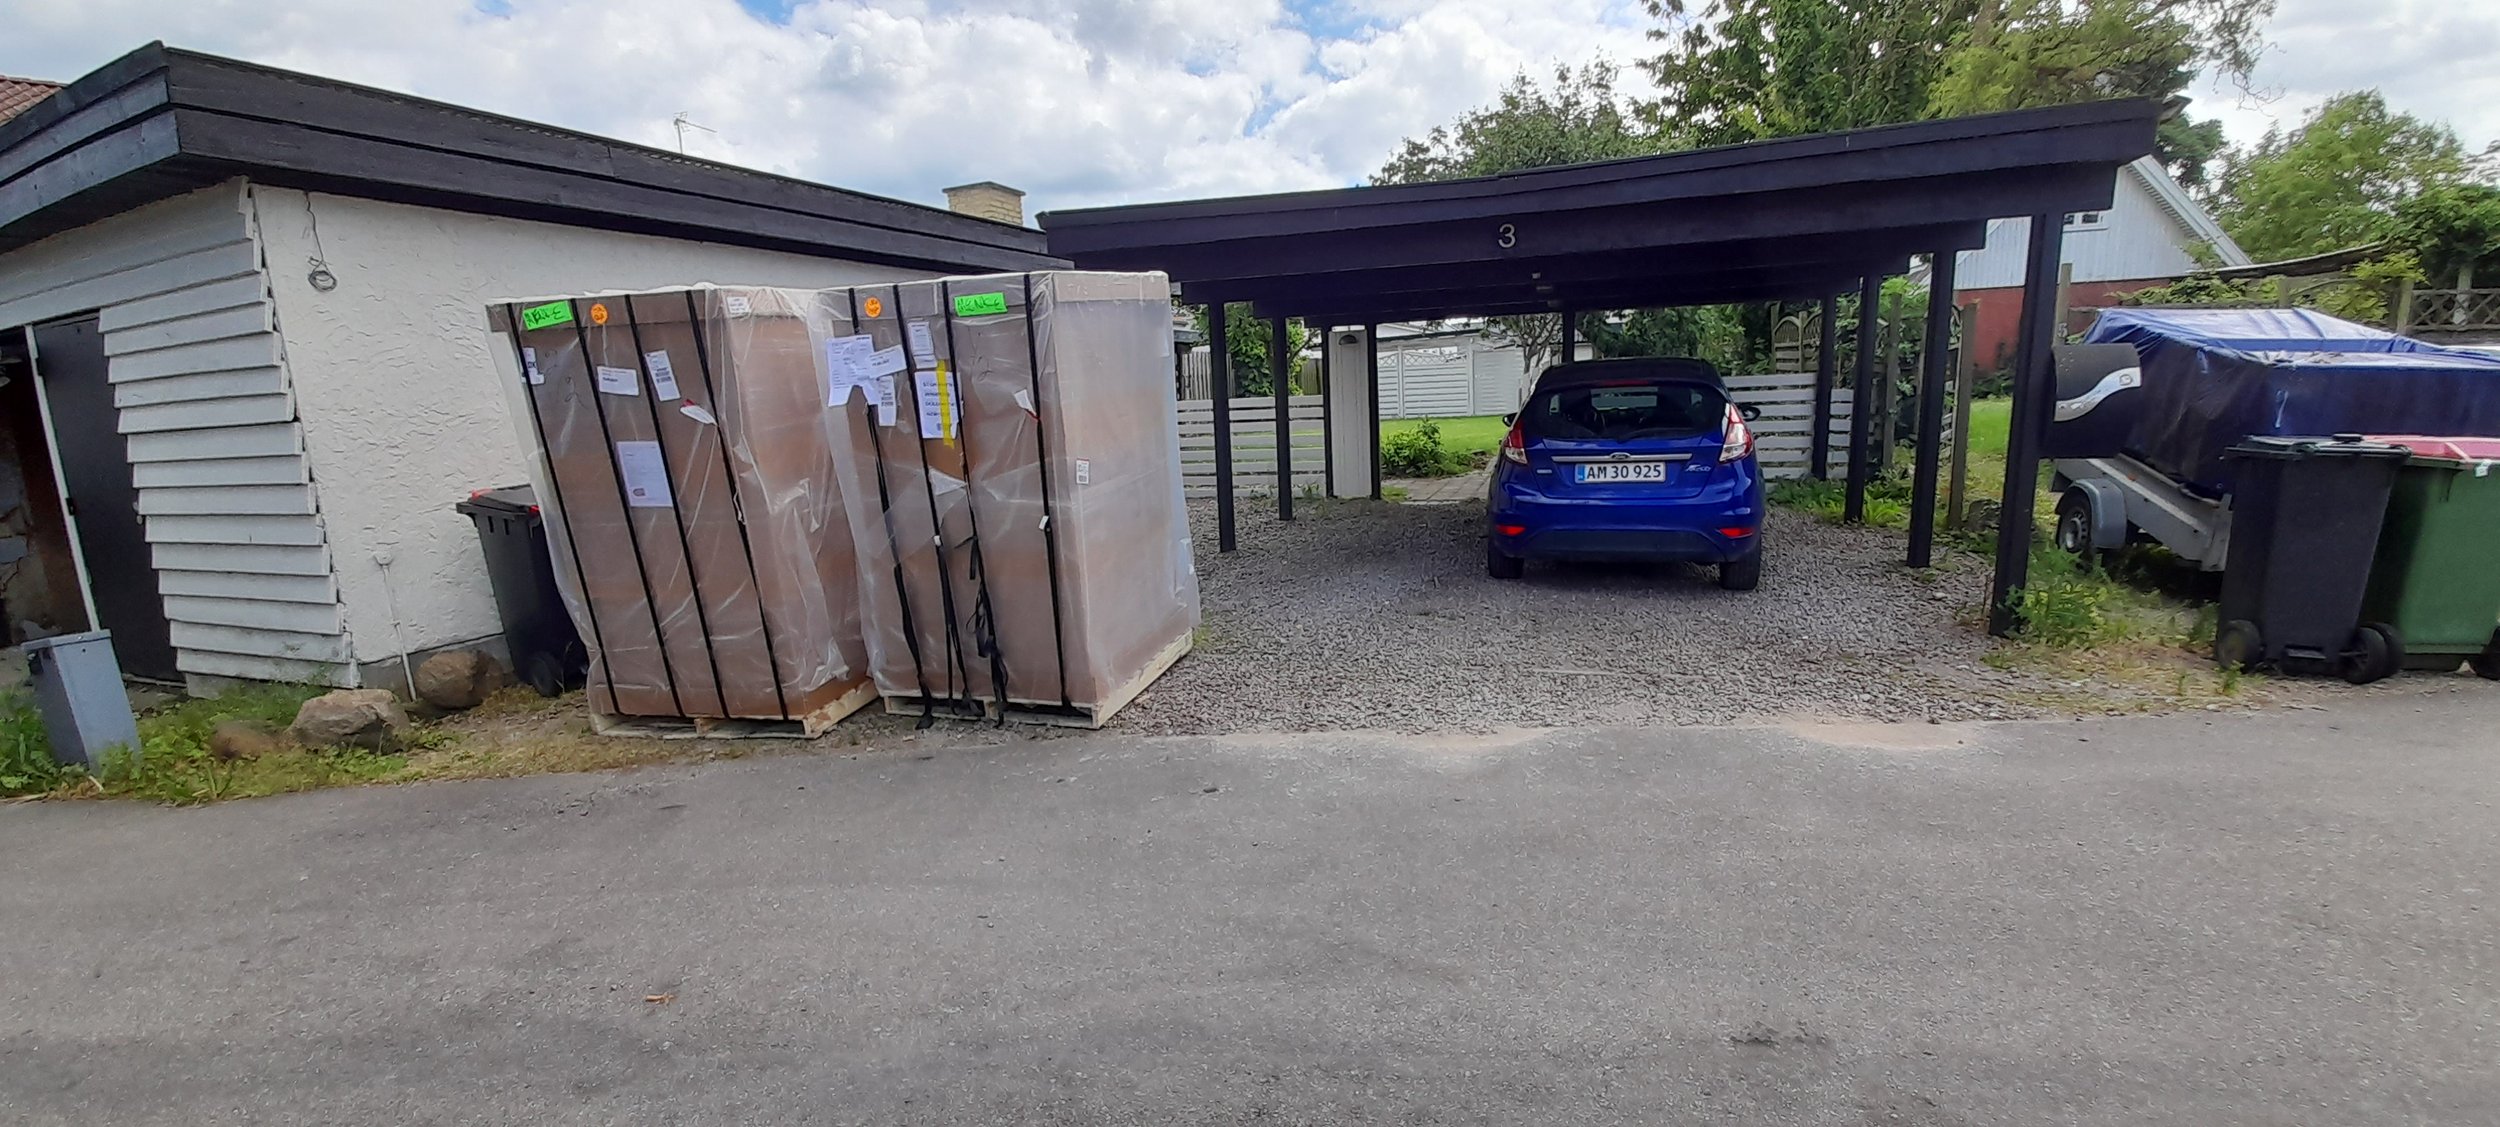
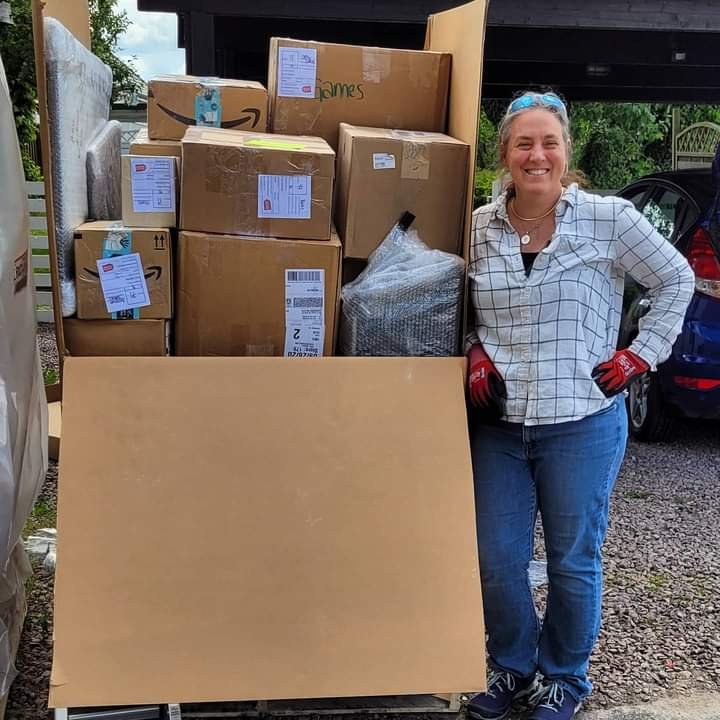
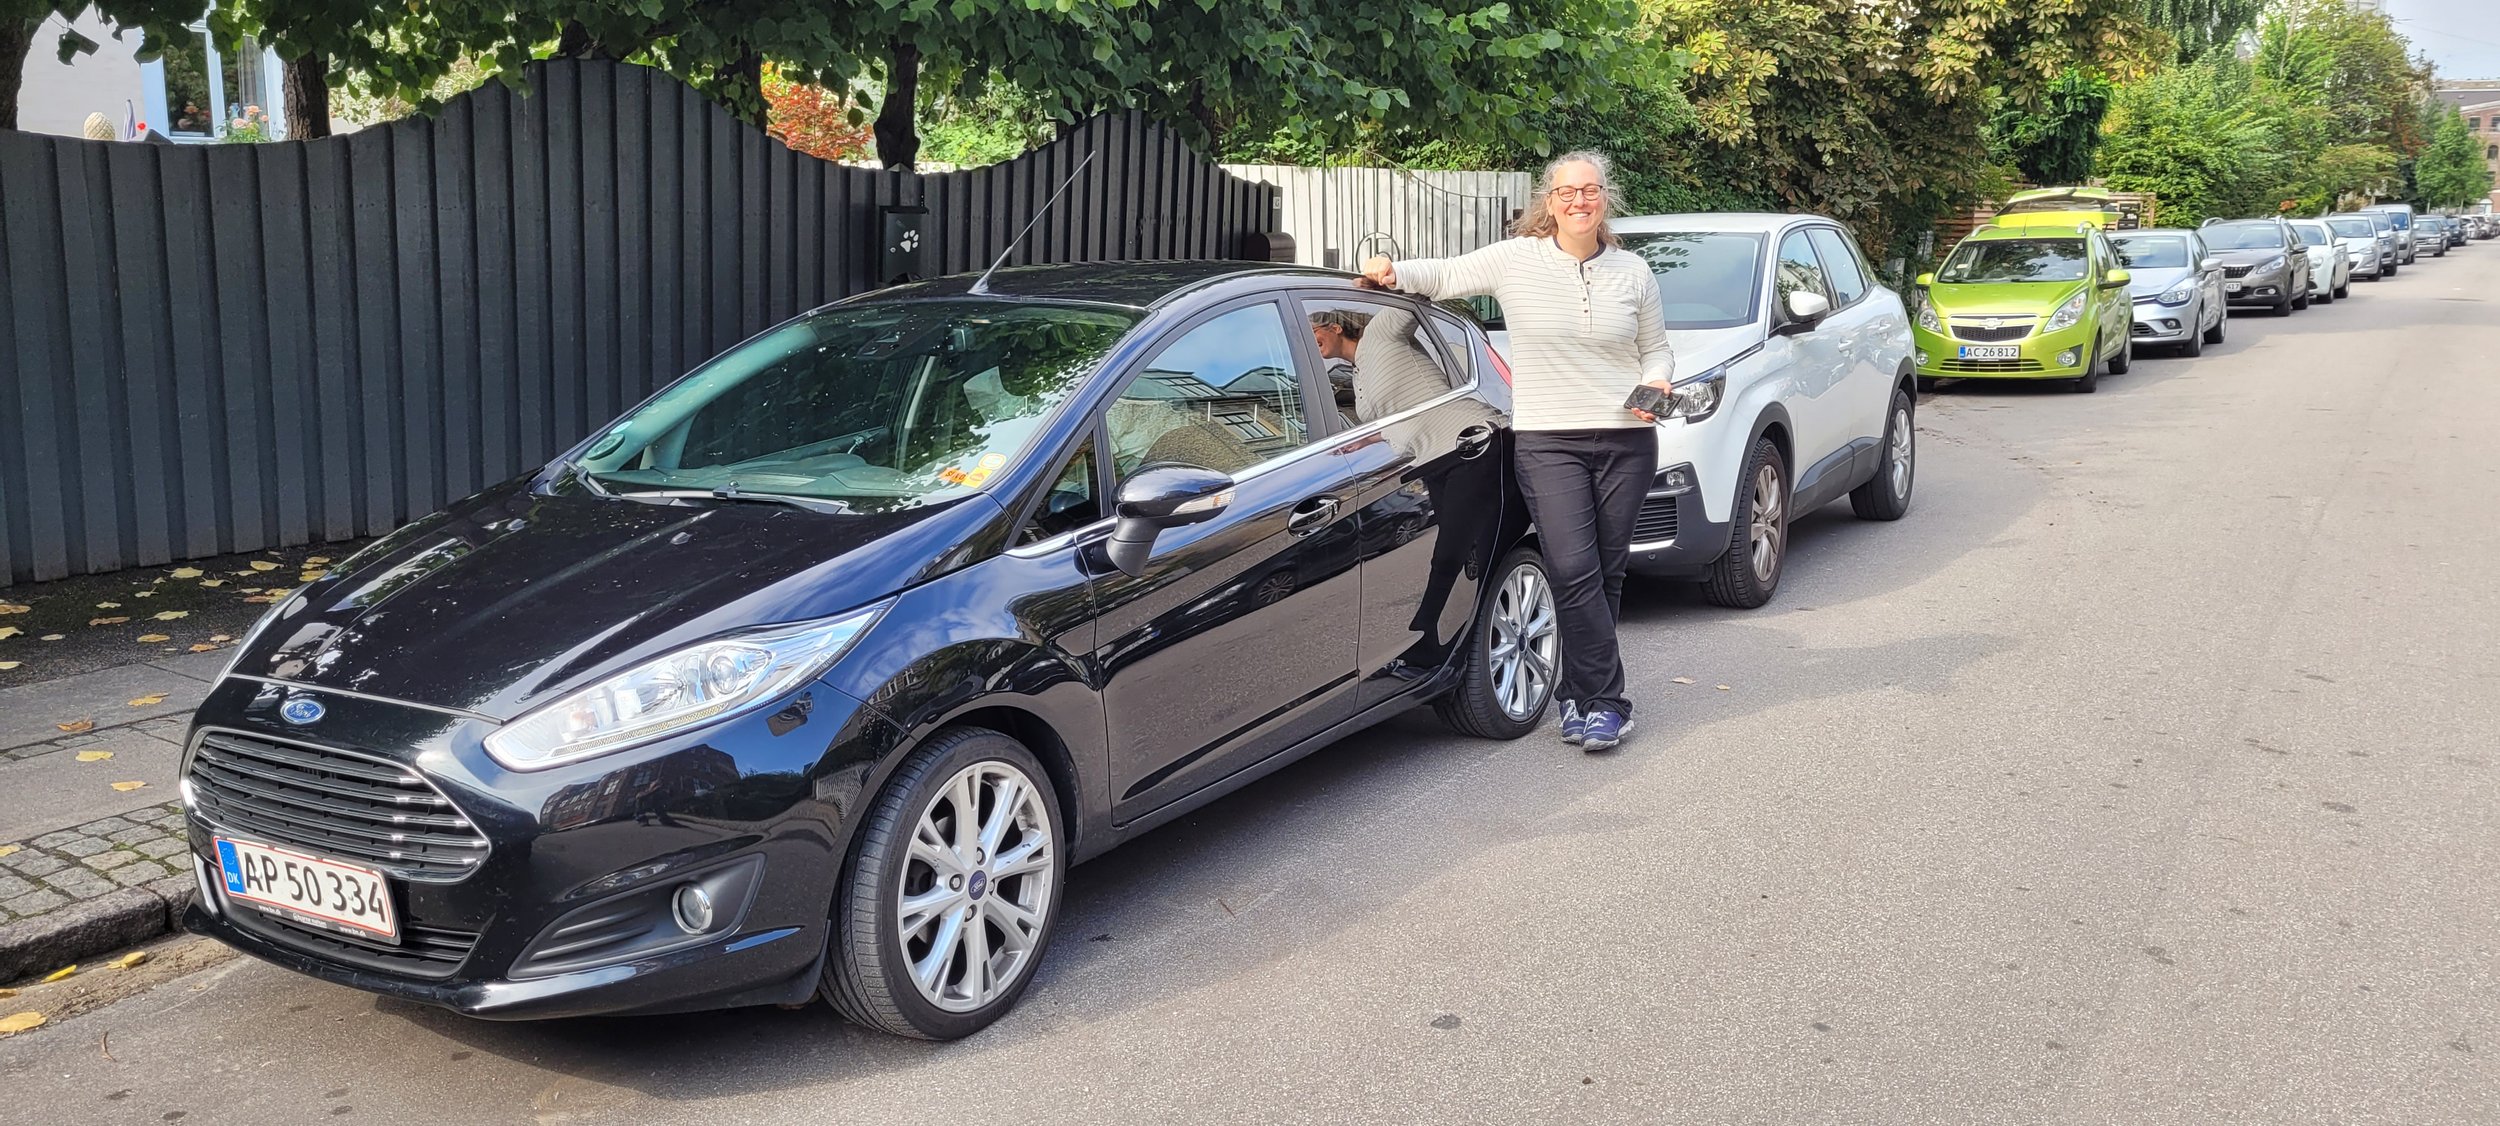
Denmark is impressive in a lot of ways. It is a small, homogenous and very efficient country. Everything is digital. They outlawed paper checks back in 2016. We have digital corona passports. When you go to the doctor you simply swipe your health card, sit down in the waiting room, have your appointment and walk out. No paperwork is necessary. When we bought our used car in August, the entire transaction including payment, insurance and registration happened in a few minutes via smartphones out on the street with the seller. 

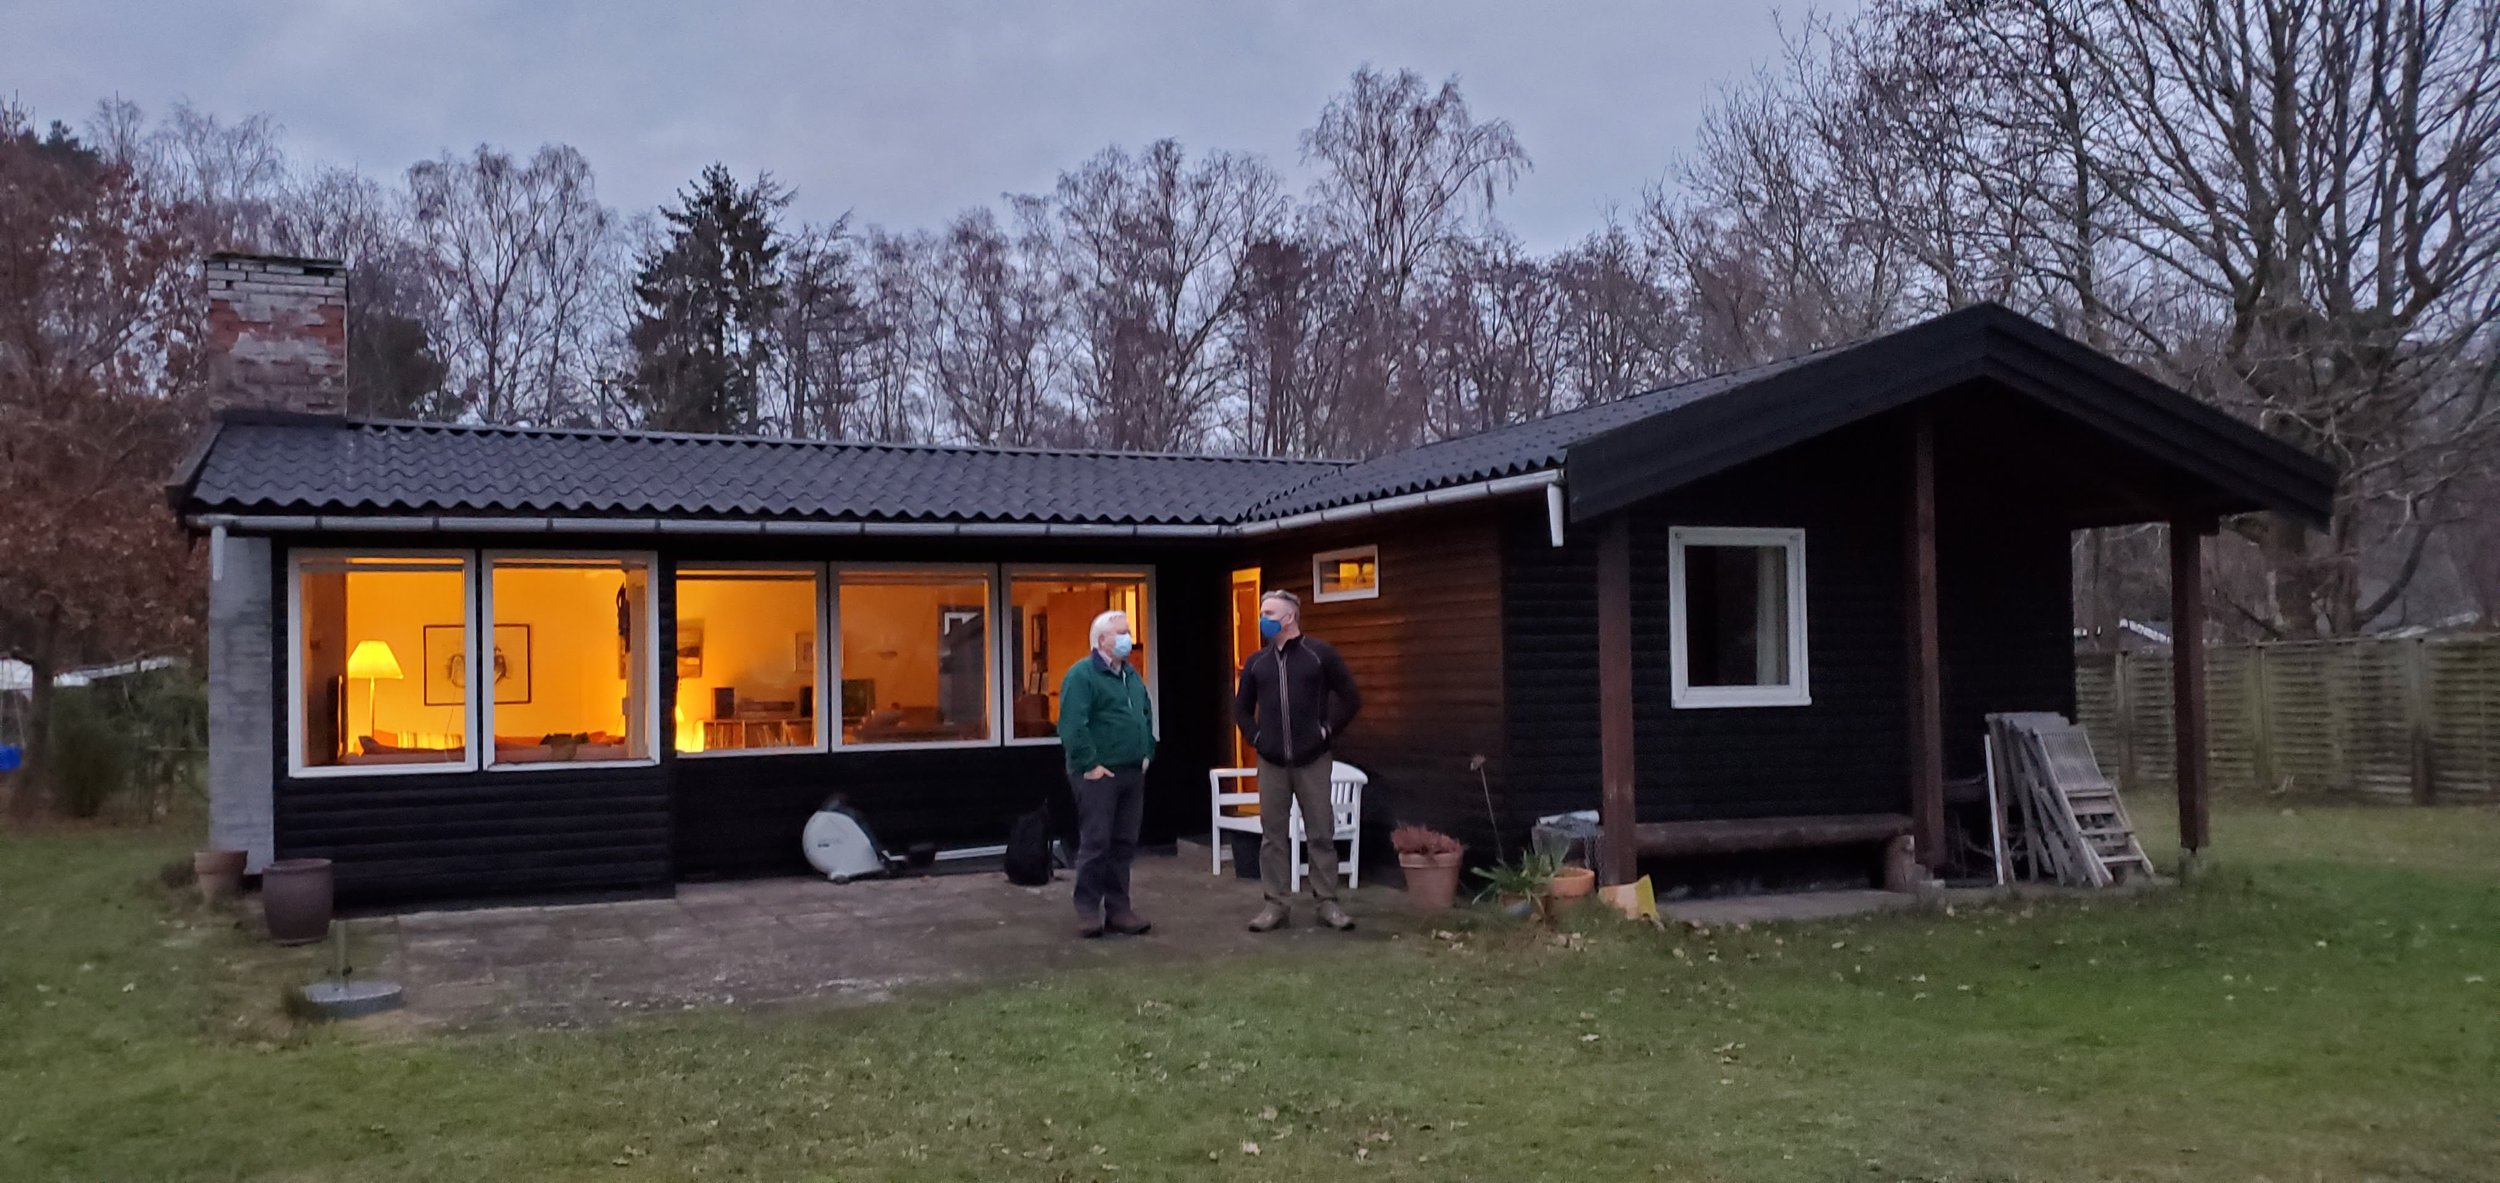
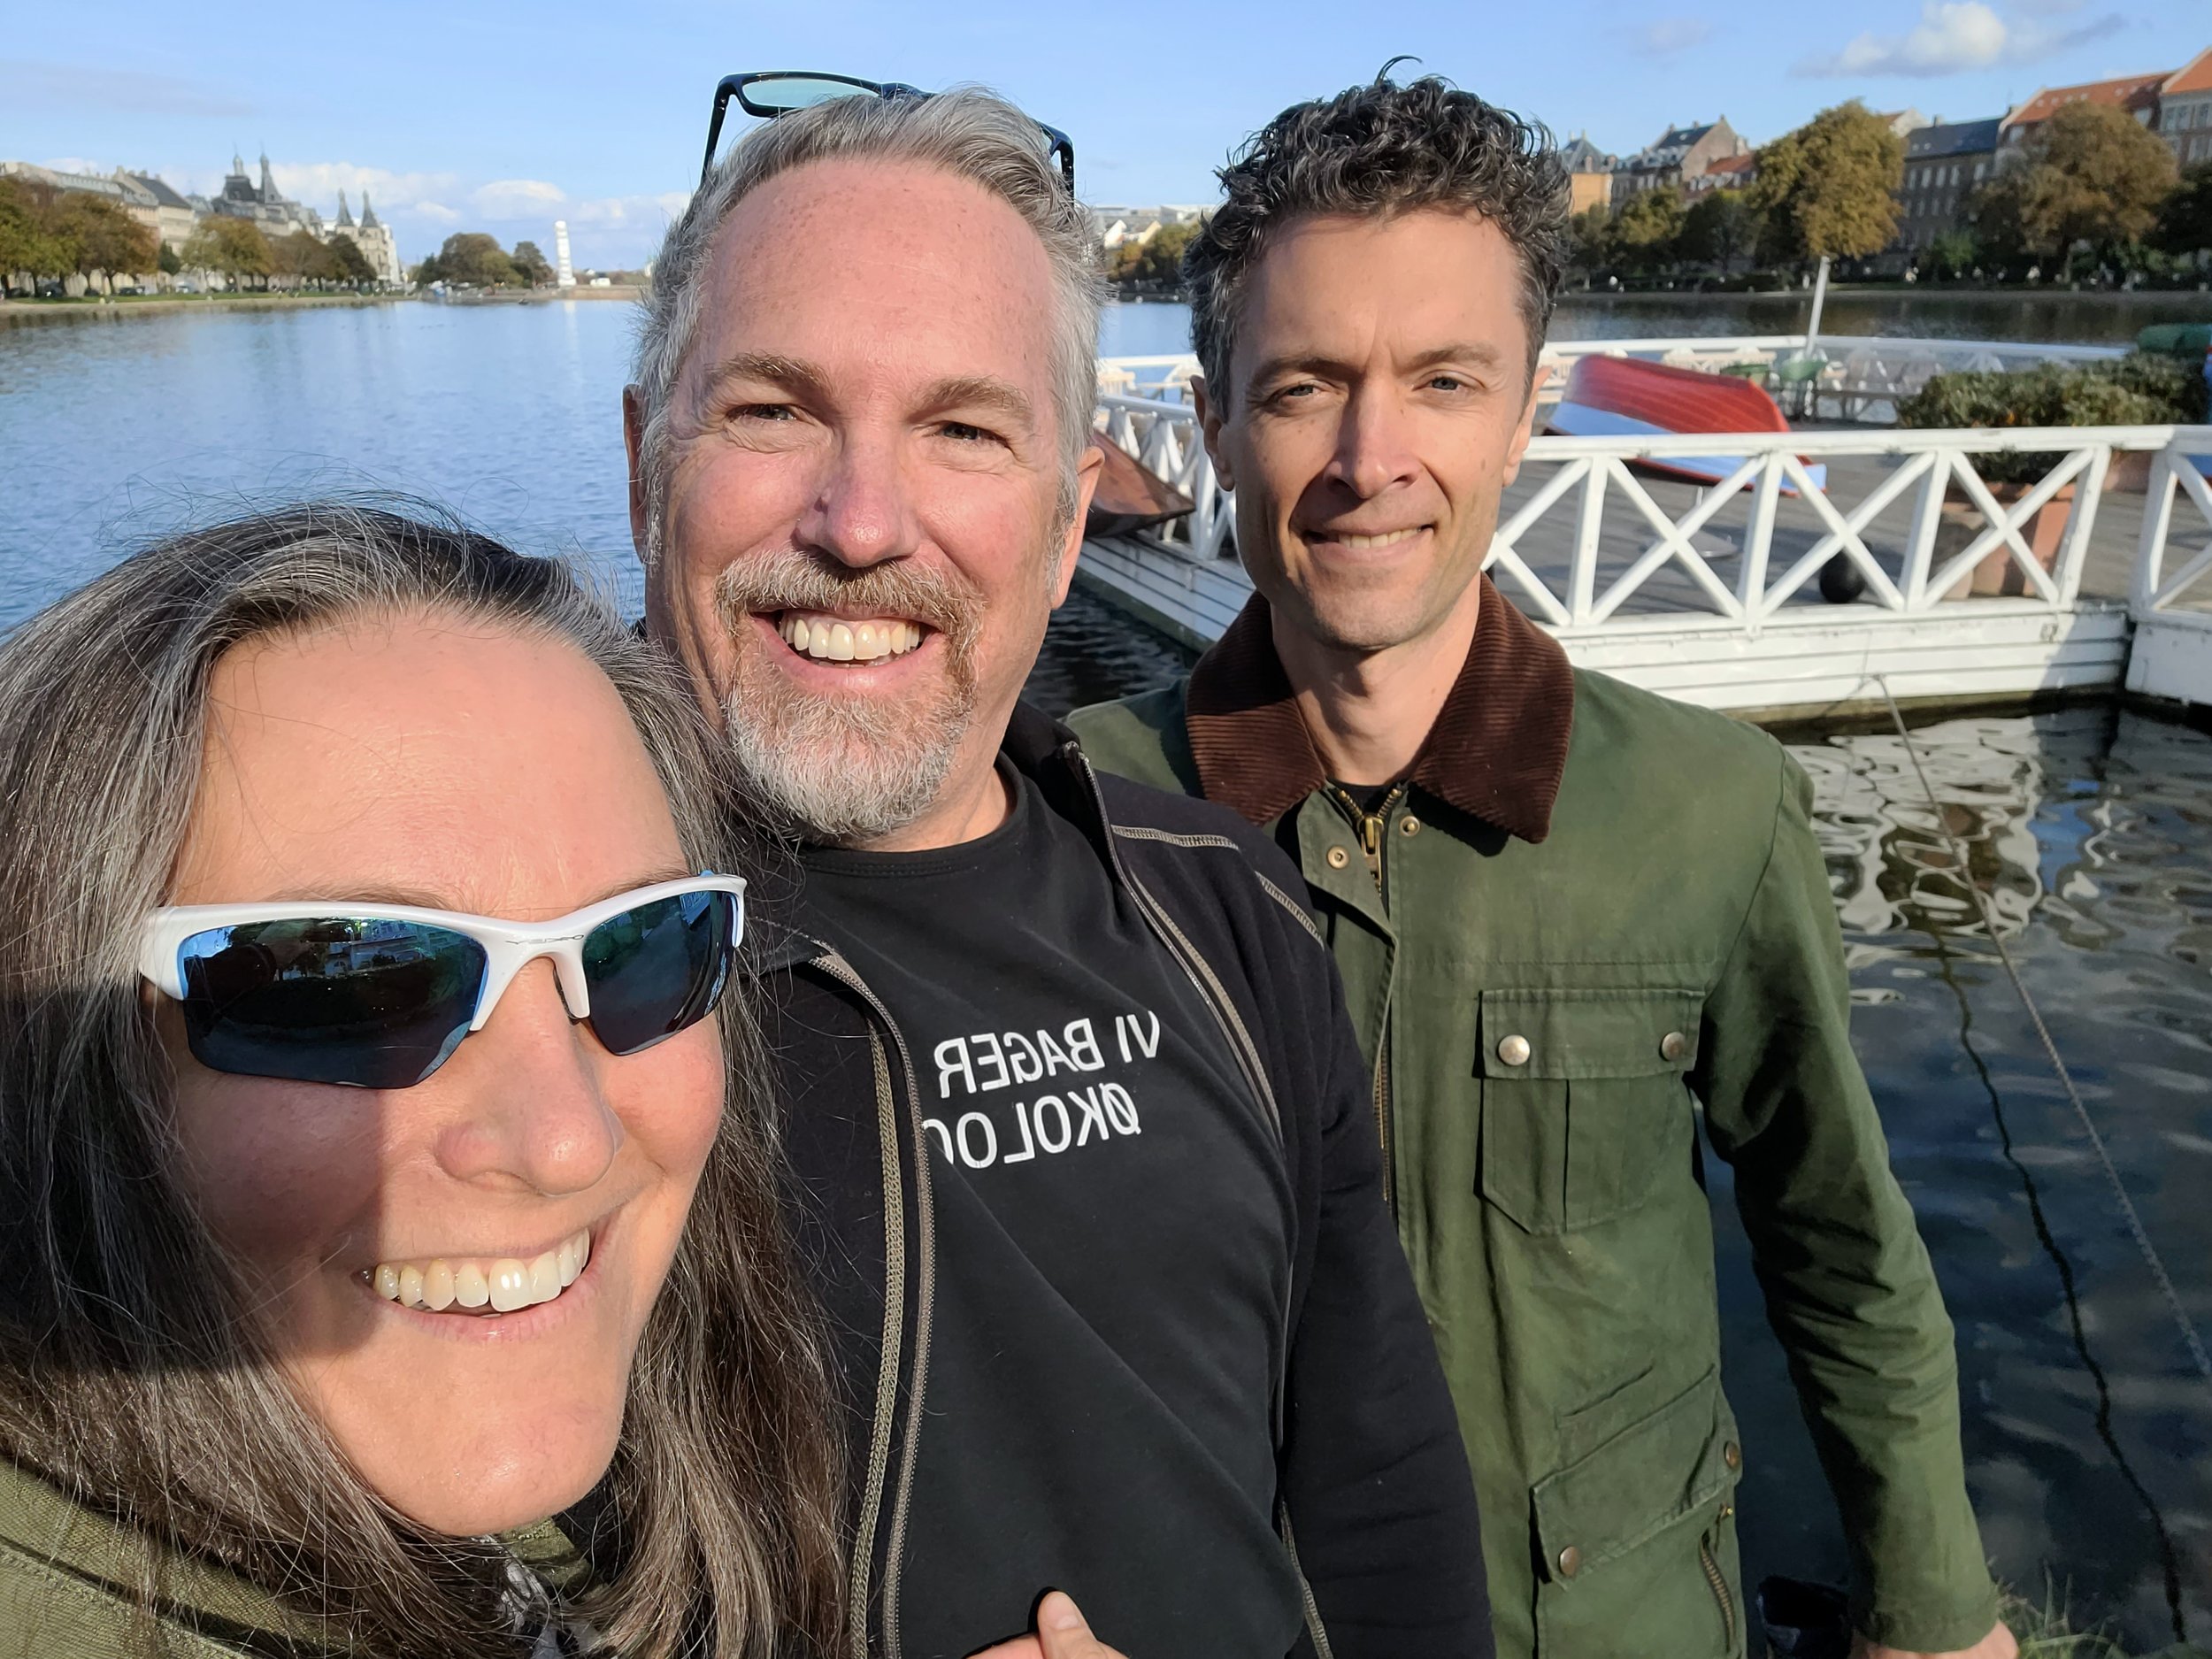
Many of the things we thought might be challenging have turned out to be easier than we anticipated. For example, if you read the Americans in Denmark Facebook pages you expect it to be difficult to befriend Danes. That has not been our experience. People here are certainly more direct, but we have made numerous Danish friends and are slowly building our Danish community. As we may have mentioned to you, there is one special family Lene & Bo Fischer/Thomsen. They have essentially adopted us. For example, we lived in their summer cottage for the first six months, and borrowed their car for several months. They are our go-to for the inevitable ‘Ask a Dane’ moment. They also helped with numerous Danish administrative details. Integrating into Denmark would have been considerably more time consuming and difficult without them, and certainly not as fun.

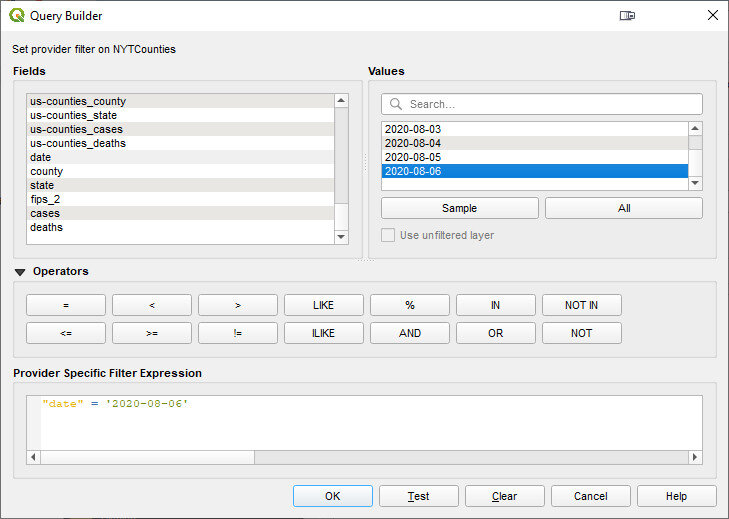
While we expected many differences, we have also found some things are almost too similar. For example, there is a big box store that is eerily identical to Home Depot, color scheme and all. Overall the biggest challenge is that everything is just slightly off of ‘American normal’. In general, getting used to the metric system has been fairly easy. But that is just one part. There are other unanticipated day-to-day things that are continuously disorienting: Denmark has a different date format (dd-mm-yyyy); for numbers the thousand separator and decimal characters are reversed ($3.345,67); in sporting events clocks count up not down, writing on a Nordic keyboard etc. And on top of that, everything is in Danish - by default. So everything takes us longer here.

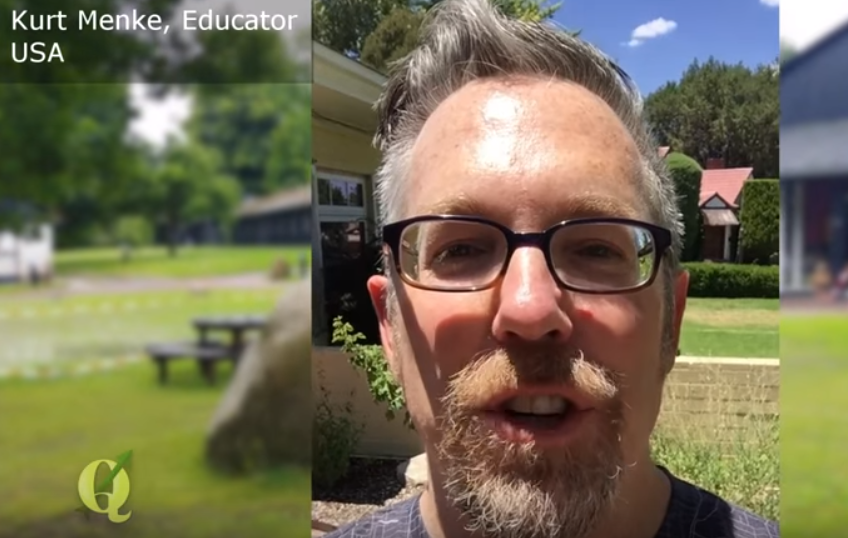
We are both still working on learning Danish and both enjoy it. It is gradually coming together. We have both taken language courses and work with our private Danish teacher. We have never enjoyed tv/podcast/radio ads so much. They are a surprisingly good Danish learning tool. We have also discovered that speaking a little bit of Danish goes a long way towards ingratiating ourselves with Danes. That is our goal with every interaction. We are often pleasantly surprised to discover we just understood what someone said. But speaking Danish is undeniably difficult and will take time.

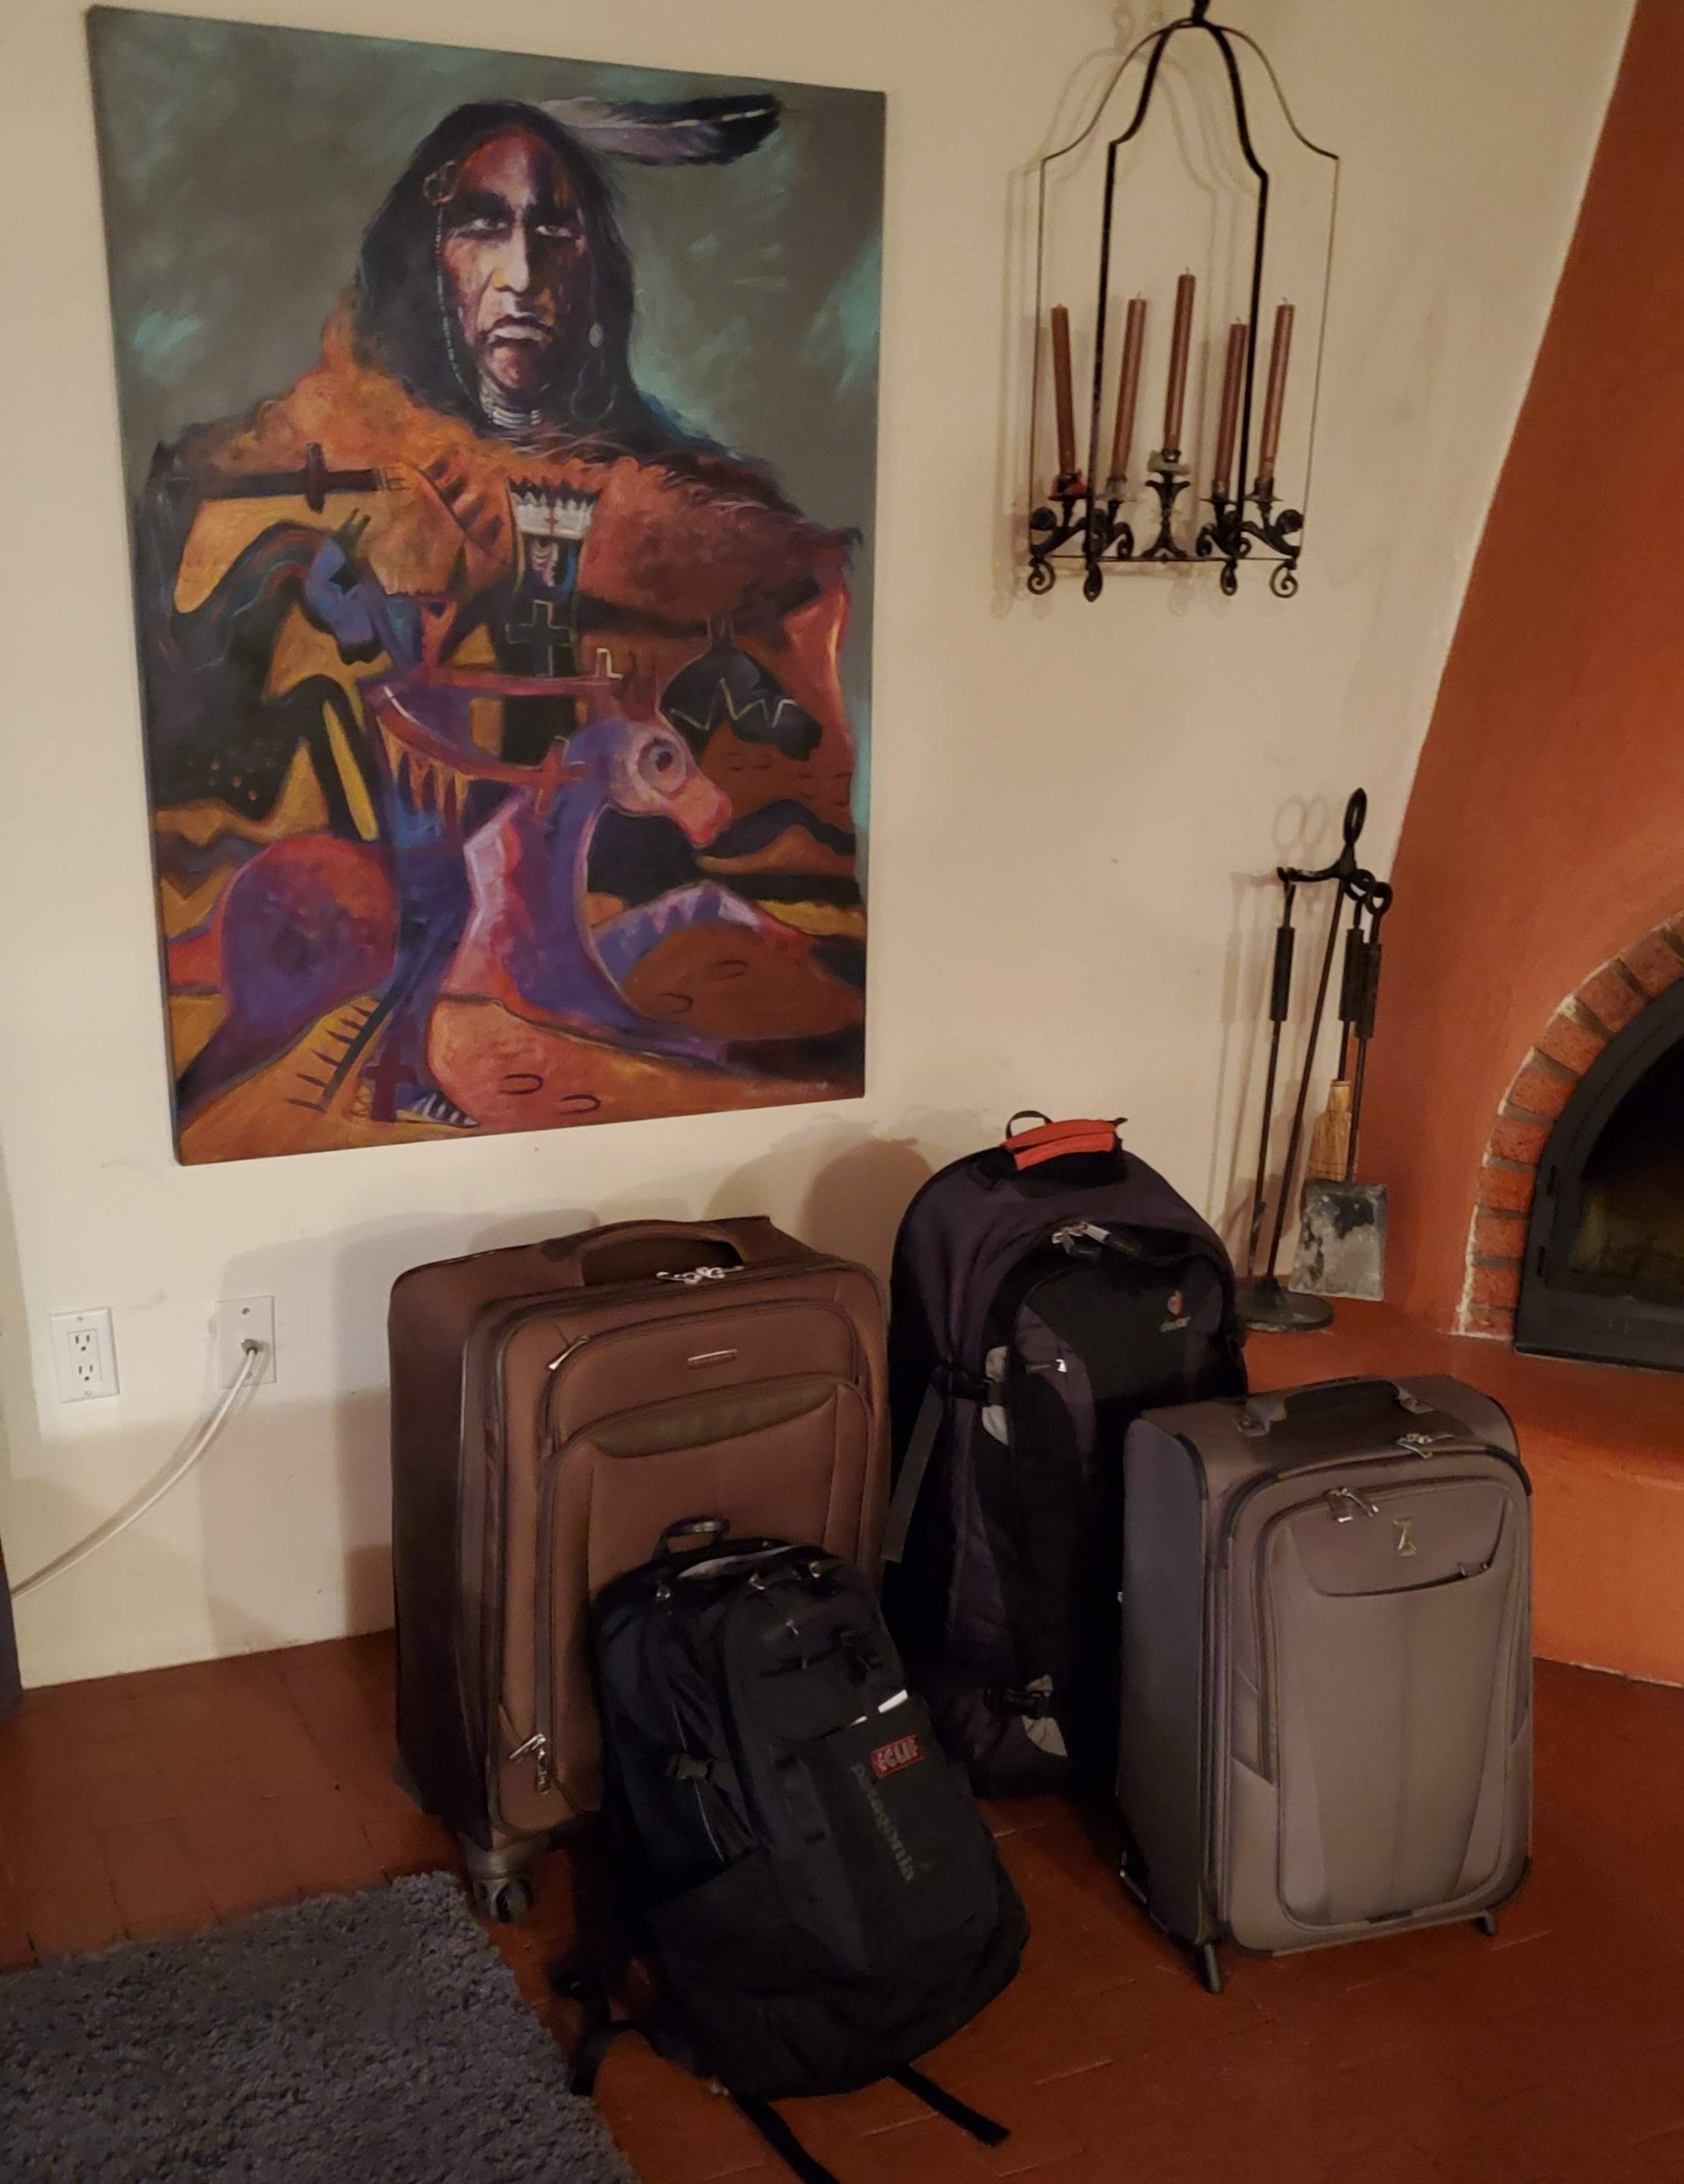
Over the holidays we will travel to the Danish island of Bornholm. It lies in the Baltic Sea east of Denmark, south of Sweden and north of Germany/Poland. We will take a ferry to Sweden, drive to another ferry, which we take to Bornholm. It is quite a bit more rocky than the rest of Denmark and has a lot of historical monuments, a rugged coastline, bird life and nature. 

We have received tremendous help at every turn this year. So we would like to take this moment to thank you for your friendship and support. It really means a lot.

The best way to follow us is via Instagram (@geomenke & @sarahreynolds.dk) and Facebook.

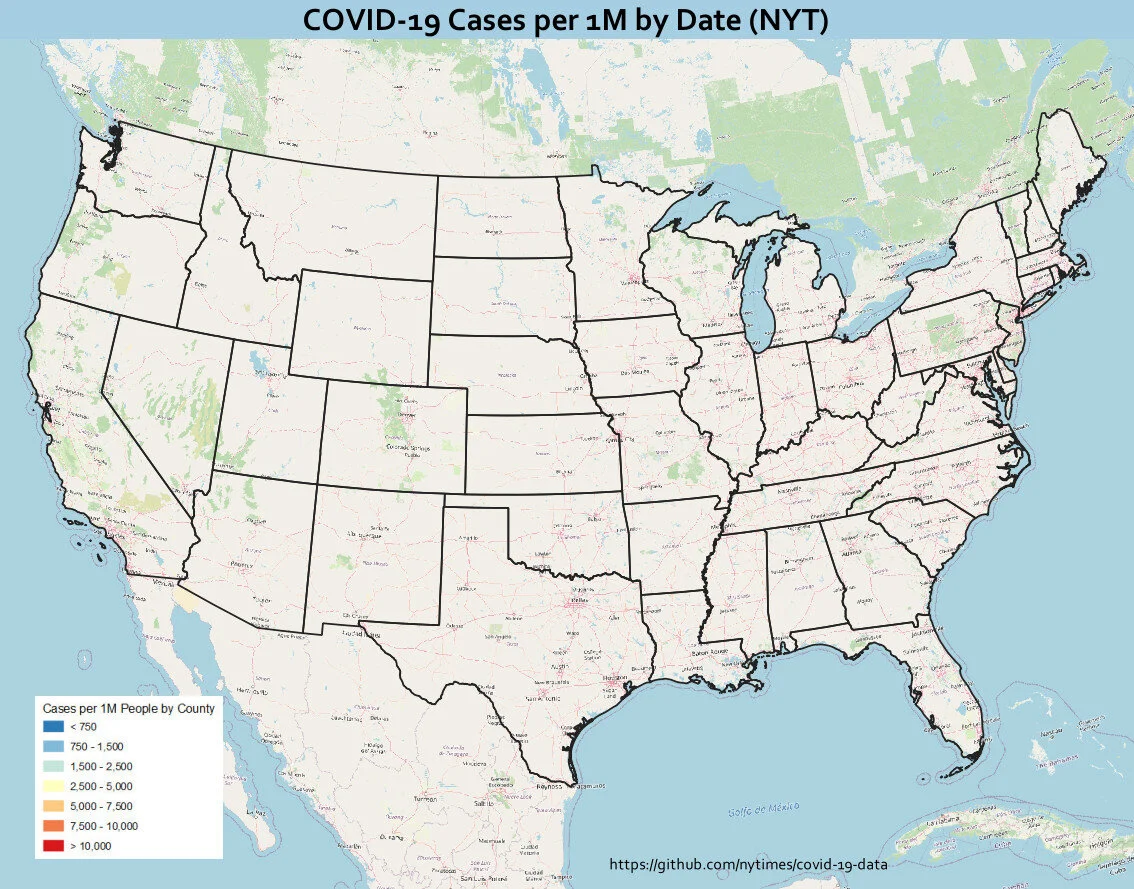
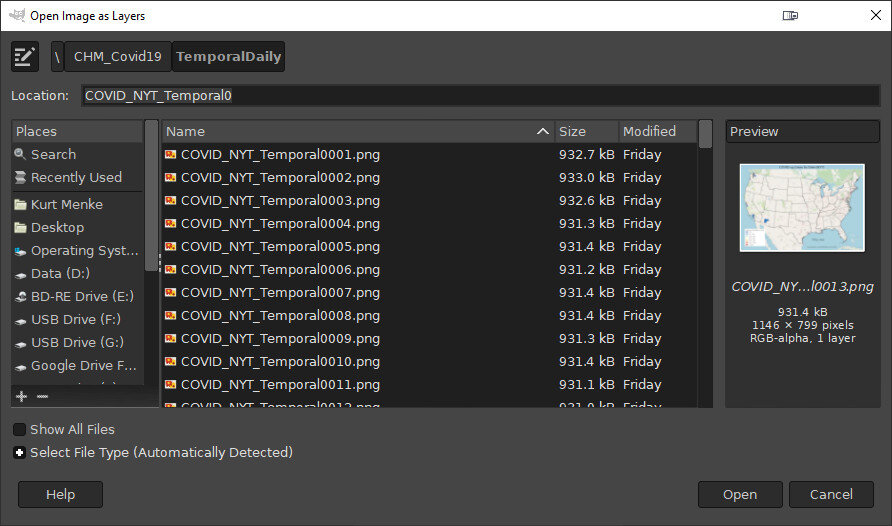
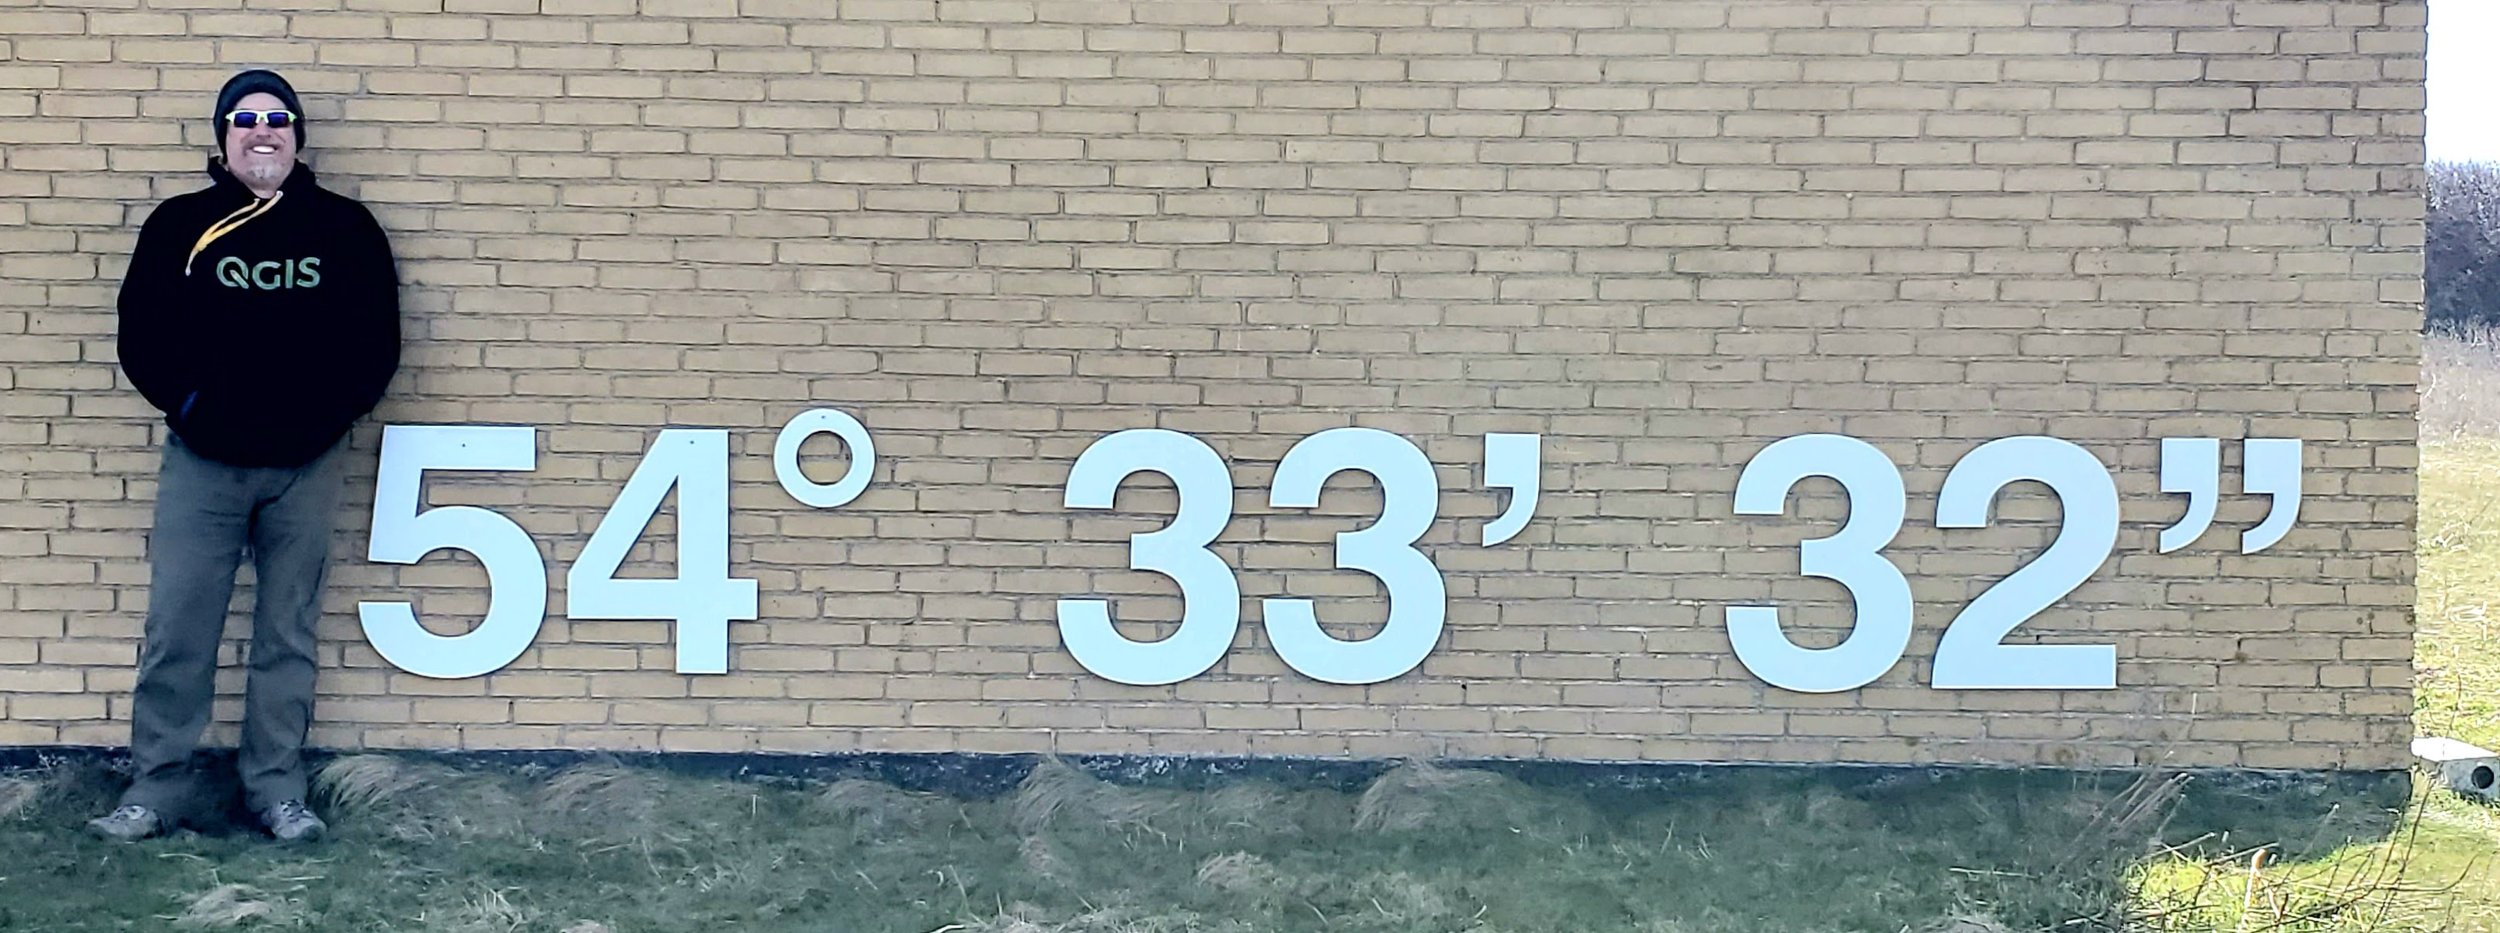
Kurt also completed the 30 Day Map Challenge and wrote a blog post about it (https://septima.dk/nyheder/30-Day-Map-Challenge) which includes many maps of Denmark.

Creating a COVID-19 Temporal Animation with QGIS

One of the most powerful new features released with QGIS v3.14 is the Temporal Controller, which allows you to enable time in your maps. It can be used to temporally enable vector, raster, mesh and WMS(T) data. The Temporal Controller is now a core part of QGIS and has several variables associated with it that allow you to create powerful visualizations and animations. It contains most of the functionality found in the Time Manager plugin.

Here you will learn how to use it with the New York Times COVID-19 data to produce a county-based animation of the outbreak in the U.S.

Getting the Data

To begin, download the current New York Times live COVID-19 data, a U.S. Counties with population shapefile and a State boundaries layer from the U.S. Census. Unzip the county and state data.

Add the Data to QGIS & do some basic styling

Add all three datasets to QGIS 3.14, then use either the QuickMapServices or MapTiler plugin to add an OpenStreetMap basemap. If you have not installed these, you can do so from the Plugins menu option Manage and Install Plugins.

Next you will symbolize the States with a simple black outline and no fill. Press F7 to open the Layer Styling Panel. Make sure the states layer is the target layer in the panel.

  • Select the Simple fill component.

  • Change the Fill style to No brush.

  • Increase the Stroke width to 0.46.

The NYT data is structured such that there is an entry for each county for each day of the pandemic. For each date it has both the cumulative number of confirmed COVID-19 cases and deaths.

2020-08-10_162130.jpg

Processing the Data

The only data processing step is joining the COVID-19 data to the counties layer by FIPS code. This is a 5 digit code (2 for the state and 3 for the county) which is a unique identifier for each county in the country.

You will use the Join Attributes by Field Value processing algorithm. Use the Processing menu to open the Processing Toolbox. Use search box at the top of the Toolbox to search for ‘Join’. This will filter the available tools. Locate the Join Attributes by Field Value processing algorithm in the Vector general section. Fill it out as shown below being careful to select the Join type of Create separate feature for each matching feature (one-to-many).

Warning: This is going to create a very large dataset with over 400,000 features. It may take quite awhile to process depending on the speed of you machine.

2020-08-10_163329.jpg

Symbolizing the COVID-19 Data

When the data has been processed you can symbolize it. Again the size of this dataset makes it a bit unwieldy. Since the goal is an animation which builds towards the current total of COVID-19 cases, you want to set up the classes so they make sense for the latest date in the dataset. To figure this out, you will temporarily filter the data for the most current date.

  • Open Layer Properties for the layer.

  • Choose the Source tab.

  • In the Provider Feature Filter section click on the Query Builder button.

  • In the Fields box highlight the date field.

  • In the Values box click All. Again this is a big dataset so it may take a few moments for QGIS to compute a list of all the dates.

  • Form an expression in the Provider Specific Filter Expression box. First double-click on the date field to enter that in the lower box. Then click on the equals operator. Finally double-click on the most current date.

  • Click OK.

2020-08-10_164257.jpg

When finished, a small filter icon will appear to the right of the layer in the Layers Panel. If you hover over that filter your expression will appear. Now you will work on styling the filtered dataset.

  • Make sure the correct counties layer is the target layer in the Layer Styling Panel.

  • Where it reads Single symbol, change it to Graduated. The Graduated renderer allows you to symbolize the counties based on a numeric field.

  • You can begin by simply choosing the cases field as the Value.

  • Click the Classify button and you will see the counties classified into the default 5 classes in your default color ramp.

  • Choose Equal Counts as the Mode.

  • Increase the number of Classes to 7.

  • Use the Color ramp selector to find a nice color ramp. Here I’m using the RdYlBu ramp.

  • Right-click on it and choose Invert. This is necessary if using the RdYlBu ramp so that the counties with the highest number of cases are red.

  • Next you will change all the outlines for all the classes to a thin white line. To do this, click on the colored bar next to Symbol.

    • Select Simple fill.

    • Change the Stroke color to white and the Stroke width to 0.06.

    • Click the blue back arrow button to return to the main layer styling options.

2020-08-10_171438.jpg

Normalizing the data by population

This is now turning into a nice map. However, it will be more informative to normalize the number of cases against the population. Otherwise we risk making a map of just population centers. In the Value section where you chose cases as the field, click the Expression button. The Expression Dialog window opens with cases as the expression. Here you will divide cases by population and multiply by 1,000,000. This will give you the cases as a rate per 1,000,000 people. ‘

2020-08-10_172204.jpg
  • Put your cursor to the right of the word cases and click the / division symbol button.

  • Expand the Field and Values values section. You will see a list of all the attribute columns in the dataset.

  • Double-click on POPULATION to add field to your expression.

  • Next, wrap cases / “POPULATION” in parentheses.

  • Finally, enter a multiplication * symbol followed by the number 1000000 without thousands separators.

  • Click OK.

  • In the Layer Styling Panel click Classify again to see your map as cases per 1,000,000. You can also enter custom values. For example, you can set the upper limit for the first class to an even 2,500 versus the 2,508.62.

2020-08-10_172443.jpg

Now that you have the styling set, you will clear your layer filter. Click on the filter icon in the Layers Panel to open the Query Builder. Click Clear and OK.

Working with the Temporal Controller

Now you can work with the Temporal Controller.

  • Open Layer Properties for the counties layer and choose the Temporal tab.

  • Set the Configuration to Single Field with Date/Time and point it to the date column.

  • Set the Event duration to 1 week.

  • Close Layer Properties.

2020-08-11_081417.jpg

The layer will likely take awhile to render so you may want to turn it off now that you have it set up.

Decorations

Next you will work on some Decorations to add to the animation. These will allow you to add a title, legend and data source to the map canvas.

From the View menu find Decorations and choose Title Label. Click Enable Title Label and enter COVID-19 Cases per 1M by Date (NYT). Choose a font and a background color and click OK.

To add the legend to the map canvas, you will set one up in the Print Composer. Start a new Print Composition and add just a Legend. Configure it how you’d like and take a screenshot or reduce the size of the composition to fit to the legend and export it as an image.

Back at the main QGIS window revisit View —> Decorations and choose Image. Click Enable Image and load your legend. Use the Size and Horizontal/Vertical settings to place it in a good spot.

You can use the View —> Decorations—> Copyright Label to put the url to the New York Times GitHub repository on the map.

2020-08-11_082636.jpg

Labeling Time

Finally you will create a point layer to place the current day on the map. Click on the Layer menu and choose Create Layer —> New Geopackage Layer. Be sure to make it a point layer.

2020-08-11_083127.jpg

Put the layer into edit mode and create a point where you’d like the date to appear. Save your edits. Open Layer Properties and select the Temporal tab. Enable Temporal and set the Configuration to Redraw Layer Only. This tells QGIS to redraw this layer each frame.

Now you will symbolize and label this layer. For symbology change the renderer from Single symbol to No symbols. You don’t need to see the point. You will be using this layer to simply label time.

In the Layer Styling Panel switch to the Labels tab. Set labels to Single Labels. Click the Expression button to the right of Value. There are a series of variables tied to the Temporal Controller. Expand the Variables section and double-click on the @map_start_time variable to add it to your expression. This variable represents the start of the map’s time range. As you step through time on the map, this variable will update to represent the current start date for the map. You can use the format_date() function to put this time into your preferred format. If you highlight the format_date() function you will see some help in the right side of the expression window. Reference the example below. Also note that QGIS provides a preview of what your expression returns. Look in the lower left corner of the expression window. You can check this to ensure the expression is formatting the date as you wish. When finished click OK.

2020-08-11_084008.jpg

Lastly, choose a font for your time label.

Activating Time

Now you are ready to activate the Temporal Controller panel. Click on the Temporal Controller button on the Map Navigation toolbar, or use View—> Panels to activate it. Once visible, click the Animated Temporal Navigation button (right-most with green arrow) in the Temporal Controller panel.

2020-08-11_084703.jpg

Exporting Still Images

Set the Step to 1 days. You can now use the Temporal controls to step through time. However, the data are so large it will probably be awkwardly slow. Notice the Export Animation button to the right of the Step. Click this, and set it up to export out a series of still images, one per day.

2020-08-11_084932.jpg

Creating the final Animation in GIMP

Once the images have exported you can use the open source image editing software GIMP to create the animation. You can install it from the link.

Open GIMP and choose File —> Open as Layers. This will likely take a couple minutes as it loads all the still images.

2020-08-11_085248.jpg

Once it has finished loading the layers click Filters —> Animation —> Optimize (for GIF). This step too will take a couple minutes. Finally choose File —> Export As and export as a GIF. Set the File type as GIF and choose a folder for the export. Click Export and in the Export Image as GIF window be sure to check the As animation box. You can also choose the Loop forever option.

2020-08-11_090309.jpg

You will end up with something similar to the animation shown below! This same workflow can be used to create similar animations for deaths or for other countries.

Final Animation

Final Animation

Experiences Teaching QGIS in the Time of COVID-19

Last year I completed what I called the QGIS Hemisphere Workshop Slam. I taught at least one QGIS workshop in the eastern, western, northern and southern hemispheres. Obviously that is not happening in 2020. It was a travel year that will likely never be repeated. From a sustainability perspective it is a good thing. From a community building perspective the lack of face-to-face meetings is challenging.

QGISWorkshops2019.jpg

Last Friday (June 12th) I taught an online 3 hour Data Visualization with QGIS workshop for FedGeoDay2020 using Zoom. It was the first time I’ve taught a virtual hands-on workshop to a large (~40) dispersed group. Last year I taught a multi-day course to a company in Canada, also using Zoom, but there were only 12, they were all in the same room and there was a facilitator. All my prior workshops have been face-to-face.

I really didn’t know what to expect. In my experience, success in a workshop depends to a large degree on: A) the skill level of the group and; B) whether they all work at roughly the same speed. This is especially true for workshops where anyone can register. This was an easy group from both of those perspectives. (I think there is another blog post coming about ideas in this paragraph)

I was pleasantly surprised with how smoothly it went. This was partly dumb luck. I am in the western US and got an afternoon time slot. The organizers had intended workshop to be run with everyone using Amazon Workstations. The machines were pre-loaded with workshop data. Unfortunately, those teaching in the morning discovered the virtual machines weren’t going to perform well and had to abandon the strategy mid-workshop. Had it worked it would have been brilliant. The whole thing was experimental and there were some lessons learned. I’m just grateful I had a chance to change course.

Hearing this news, I quickly made the data available via Google Drive and set up some instructions for software installation. When we started I provided the link and instructions. We spent the first ~10 minutes getting set up and the rest went smoothly.

ZOOM CHALLENGES

My biggest challenge teaching via Zoom is not being able to see peoples computers. I can’t help them debug. If it’s a small group they can share their screen, but this group was way too large for that. I was also worried I would have trouble pacing it. How would I know if people were finished with an exercise or needed more time?

Another challenge is managing questions via the chat box. This spring, Hans van der Kwast (my co-author for QGIS for Hydrological Modeling) and I put on a seven part webinar series. During those, one of us would teach and the other manage the chat. (You can watch all seven webinars, one per chapter, on YouTube here). It worked brilliantly and the turnout was phenomenal. We had 373 people register representing 86 countries!

However, for last weeks workshop I was solo. In preparation, I read Ujaval Ghandhi’s post where he shares his experiences teaching online and tried to prepare accordingly. I also read Andrew Cutts post. I recommend them both!

WHAT WORKED

Here are the strategies that worked well for me:

  • To keep track of peoples progress, I had them either use Reactions (give me a thumbs up when they finished a section), or give me some indication via the Chat box. I could also tell it was fast group and that they seemed to be working at the same pace. That’s just luck.

  • For other large groups I’ve been in the habit of using animated gifs for teaching. These allow the workflow to “play” onscreen while I walk around the room helping people. It’s really effective. I hoped this would work equally well in this situation and it did. I could leave a slide up and while people were watching I could monitor the chat window and answer questions.

  • Lastly I gave a 10 minute break every hour.

We got through all the material in the 3 hour session and I had positive feedback.

I hadn’t planned on recording the session. However, someone asked about it and it’s easy to do via Zoom. I did some minimal editing to give a nicer opening and take out the breaks. The workshop is available in its entirety here.

OTHER ONLINE EVENTS:

So far, during the COVID-19 pandemic, I’ve had great experiences with webinars and now a workshop. I’ve also really enjoyed watching webinars and conferences others have put on. Nyall Dawson recently taught two must see webinars (QGIS 3.14 time handling and map animation & QGIS Expressions, variables, and data defined settings: putting it all together). Then this week OsGeo:UK hosted the virtual FOSS4G UK Online 2020 conference which was fantastic. I understand videos will be coming in the next week. One I recommend watching is Steven Feldman’s (@StevenFeldman) talk Running an Online FOSS4G - some reflections. He gave a really thoughtful overview of the future of FOSS4G conferences. Nick Bearman’s talk on Teaching QGIS: Certification and Running QGIS in the Cloud, I missed, and look forward to checking out. I also recommend Jorge Gaspar’s (@xurxosanz ) review of the FOSS4G UK Online conference! I am happy to see all of these events be so successful. They help democratize learning technology. They have been free and open to anyone. They also help maintain our community connection.

Next month QGIS-US is hosting a one to two day conference: QGIS North America 2020. Then in August I will be working with the Australian Water School on a webinar series: QGIS for preparing and visualising hydrological data.

Time zones are the biggest hurdle for live events. One solution is recording them and making the content available, as most are doing. For the foreseeable future these are how our communities will be meeting, and thankfully it’s working.

Interviewed on the MapScaping Podcast

20200312_092345.jpg

Earlier this winter I had the honor of being asked by Daniel O’Donohue of the MapScaping podcast to be interviewed about all things QGIS. I was really impressed with his attention to detail. With his suggestion I went out and bought a better microphone, a stand, a pop filter and some mic covers. These just help improve the sound quality. As a podcast fanatic/addict it was fun to learn more about podcasting gear.

I think it was worth it. I’m really happy with the way it came out, and it was interesting to be on the other side of podcasting for an hour!

The episode just dropped this morning. You can give it a listen below, or find the MapScaping podcast via your favorite podcast provider.

2019 The Year In Review - aka the GeoMenke Index

Clients

Number of clients served: 30

Percentage of clients which were new: 43%

Number of analysis projects worked on: 12

Approximate number of maps made: 283

Number of new ventures launched: 1 (the Q Cooperative - if you haven’t heard of this click the link. This is a team of skilled QGIS developers and teachers ready to help you implement QGIS)

Books

Number of QGIS books published: 2 (3 if I count the one published without my knowledge but with my name on it by Packt Publishing)

Number of book launches attended: 1

Teaching

Number of QGIS workshops taught: 17

Percentage of QGIS workshops taught in Europe: 24%

Percentage of QGIS workshops taught in my own city: 17%

Number of QGIS Certificates issued: 51 (these raised €1,020 for the QGIS project! - I co-issued another 65 QGIS certificates with partner organizations raising an additional €1,300.)

Number of hemispheres taught in: 4 (yes I completed the QGIS Training Hemisphere Grand Slam - in one year! That's at least one QGIS training in each hemisphere: northern | southern | eastern | western! )

Number of countries taught in: 6 (USA, Canada, Spain, the Netherlands, Denmark & American Samoa)

Number of US States taught in: 7 (California, Colorado, Florida, Hawai’i, Michigan, New Mexico & Rhode Island)

QGISWorkshops2019.jpg

Travel

Minimum number of flights boarded: 44

Number of airlines flown: 8

Number of airports visited: 18

Percentage of airports visited for the first time: 28%

Approximate distance flown: 100,000km or 62,000mi

Different modes of transportation used while in the Netherlands: 7

Conferences

Number of professional conferences attended: 5

Ratio of conference talks given to conferences attended: 1-1

Miscellaneous

Number of Esri licenses purchased: 0

Ratio of GeoHipster interviews started to completed: 2-1.

Number of different coffee shops visited: 32

Calories burned exercising: 107,000 kCal

Number of spin classes attended: 102

Number of workouts: 67

Number of hikes: 21

A QGIS Training in American Samoa

My final QGIS training trip of 2019 was a long one - to American Samoa. I flew to Honolulu & took a right for another 6 hours to the island of Tatuila. I basically commuted to Pago Pago for the week - leaving Monday morning and returning Friday night. While there I taught a 3 day QGIS course to staff at the Department of Health. With this training I completed the QGIS Training Hemisphere Grand Slam - that’s one QGIS training in each hemisphere - Eastern, Western, Northern and Southern - in a calendar year! The timing of the trip was interesting. If you haven’t heard Western Samoa is experiencing a serious measles outbreak. While I was there no cases had occurred on American Samoa largely due to the diligence of the AS Dept of Health.

2019-12-13_163127.jpg

I had planned on starting with how to install QGIS - but soon discovered the WiFi was going to be an issue - the QGIS installer was going to take 12 hours to download! So I switched gears. Flexibility was a big theme for the week. One person went down the street with a thumb drive, to download the installer at a building with a better internet connection. Meanwhile the remainder learned how to collect data with Fulcrum.

Learning about Fulcrum.

Learning about Fulcrum.

It ended up working out great. By the time we had gotten through data collection, we had the QGIS installer on thumb drives, and got everyone set up. I spent that first afternoon using the data collected to introduce QGIS.

DQ3x_thumbnail150px.png

This training was set up at the last minute. So last minute in fact, that I didn’t have time to order Discover QGIS 3.x books in time. I ended up just bringing a few I had on hand. I also didn’t have any training material with Samoan data. It is such a unique geography, I realized I would need some local data for them to work with. Fortunately I had a couple days in the office before I left, and found some good Samoan data. The last two training days turned in to a combination of walking through how to do different things in QGIS (on-the-fly with that Samoan data), with follow up exercises out of my Discover QGIS 3.x book. The latter really helped to reinforce the concepts and workflows. It ended up working out great.

Due in part to the measles outbreak on the neighboring islands, everyone was super busy. Many were in and out of the training to deal with work issues. When they returned I would then try and catch them up. One thing I loved about this group was that almost before I would have a chance, they would start helping each other catch up! I’m not sure if I’ve ever had a more enthusiastic bunch.

Working through an exercise in Discover QGIS 3.x

Working through an exercise in Discover QGIS 3.x

We got through everything I had planned and more. I was also sure to let them know about FOSS4G Oceania. I shared the links with them - including To’oa Browns talk about addressing in Western Samoa. Her part of the talk is especially pertinent for these American Samoan health workers - because AS shares the issue of having no street addresses! I hope some can attend next years FOSS4G Oceania meeting in Fiji.

The final group of QGIS Survivors!

The final group of QGIS Survivors!

There is now a lot of excitement and a decent QGIS foundation. While I was there they formed a QGIS study group. I also gave them assignments to work on post-training. So there is a good foundation now. We talked about continuing to build their skills and not have this be a one of training. I look forward to returning - hopefully next year. Each evening they would take me around to show me a new place. It was more beautiful than I was prepared for. Below is a picture of the National Park of American Samoa.

Esri and Me - Part 4 - Education

In previous posts (Part 1 - Part 2 - Part 3) I’ve shared some painful experiences I’ve had with Esri through the years. Here, I am sharing what I see as a partial solution - education.

A long-term goal of mine is to help diversify the GIS/Geo offerings of universities and colleges. A colleague, Dr. Phil Davis, conducted a survey several years ago and established that 95% of the GIS curricula in U.S. colleges and universities are based on Esri software. This presents both practical and ethical issues. Students typically have access to a free Esri license while in school. However, most are due for a rude awakening if they want to start consulting work in GIS after graduation, or simply continue their GIS education. I have always felt schools have an ethical obligation to teach a few FOSS alternatives. Students deserve the opportunity to learn and use technology regardless of their social or economic status. Plus, with the sheer number of tools for doing geo things, being limited to a single vendor is a serious professional limitation.

In 2008 I developed a semester long course named “Introduction to Open Source GIS.” I’ve been teaching this ever since at my local community college. As in most schools, students show up on the first day having been taught an Esri curriculum - to the complete exclusion of anything else. Most of these students are shocked to learn of the diversity of FOSS offerings. Early in the course I like to have a reprojecting race on a local streets layer between ogr2ogr and ArcMap. It blows minds! Spoiler alert: ogr2ogr wins. After being exposed to GDAL, QGIS, PostGIS etc., there is usually someone who asks, “Why is no one talking about these?” Over the years an important trend has become clear to me. At some point - as students learn to replicate a workflow in a different software - they stop just pressing buttons and begin to think about the data, what they are doing with it, and the results. Critical thinking should be the goal of any geo course.

Open Curricula

To help diversify GIS offerings I have worked on a number of open curricula. In 2014 I helped create the GeoAcademy. The original motivation behind this was to produce material that could be easily used, in whole or in part, by instructors wanting to incorporate FOSS4G into their curricula. It is based on the U.S. Department of Labor’s Geospatial Competency Model (GTCM). The GTCM is a hierarchical model of the knowledge, skills, and abilities (KSA’s) needed to be a working GIS professional in today’s marketplace. The GeoAcademy includes 35 FOSS4G university-level lectures and labs. Each lab task even has a YouTube video. This material is becoming dated but is still available. More recently I helped develop an open GIS-based curriculum on Tropical Cyclones. It’s a four unit series of exercises which use spatial data and QGIS to teach earth science. It’s aimed at early college students.

Discover QGIS 3.x

Discover QGIS 3.x - released in May with Locate Press, is largely based on The GeoAcademy. It too is designed for the classroom. The first three parts are updates to the original GeoAcademy labs. In addition, I augment that material with features I find invaluable in my day-to-day work as a GIS consultant. This 400 page workbook represents the best parts of the GeoAcademy, combined with my diverse experience teaching QGIS and using it in an applied work setting. It introduces the QGIS interface and covers: basic GIS concepts, spatial analysis, modeling, data creation and editing, cartographic design and data visualization. GDAL/OGR and PostGIS are also introduced. The material is modular. Instructors can opt to use the book in its entirety or select specific exercises to augment their courses. There are solution files for each exercise and many exercises include a challenge and discussion questions.

To help get it out there, I ordered a stack of postcards advertising the book. I mailed these to a minimum of two universities/colleges in each of the 50 U.S. states. I also mailed them to many people internationally. Cards went to hundreds of geo-librarians, professors, lab managers, instructors…. At the very least my hope is that this book gets into university libraries. If you know of a school or professor who could use some inspiration, let me know! Getting students introduced to FOSS4G software is the best way to start having it be more widely used and adopted.

20191029_104035.jpg

QGIS for Hydrological Applications

In September the latest book with Locate Press - QGIS for Hydrological Applications - Recipes for Catchment Hydrology and Water Management - was published. This book, co-authored with Dr. Hans van der Kwast, was written with a similar intent. It is based on an open curriculum developed by Hans. IHE Delft is a model school because QGIS is the default GIS and the curricula developed there are all published with an open license. The book is the first of its kind, covering QGIS applied to a specific topic. Another feature is that it uses open data throughout. Our hope is that educators will use this book to introduce students to QGIS while learning basic hydrological concepts, and open data. With this book students learn to:

  • Georeference scanned maps

  • Digitize vectors

  • Import tabular data

  • Join attribute tables

  • Interpolate points to a raster

  • Apply map algebra

  • Delineate streams and catchments

  • Find and use Open Data

  • Calculate the percentage of land cover per subcatchment

  • Design beautiful catchment maps

This book has already been field tested several times including a full treatment at IHE Delft in the Netherlands last month.

The inaugural course using QGIS for Hydrological Applications - IHE Delft

The inaugural course using QGIS for Hydrological Applications - IHE Delft

Again, if you know of a hydrology school or professor who could use some inspiration let us know! If we can get more professors offering FOSS4G in the classroom it will eventually lead to broader adoption of QGIS, PostGIS, GeoServer etc. This will lead to a bigger more diverse FOSS4G community and better software.

Esri and Me - Part 3 - Conservation

My Business

I launched my business full-time in 2008 with the mission to use the technology to help make the world a better place. Ecology and conservation work is a steady focus, as is using FOSS tools. My reasons for the latter are many. The community aspect of FOSS projects aligns with my general sensibilities and ethics. On the practical side, there’s the fact that I can fund new features helpful to my day-to-day. There is the lack of license fees, plus I have the freedom to have my clients install and work with the same software I’m using. Until recently I’ve also have a single seat Esri license for those moments when business demands it. This is simply due to the reality that many contracts require data be delivered in proprietary Esri formats, a model be built in the Esri Model Builder, or contracts requiring an analysis be done and delivered with Esri software. These requirements are common among U.S. municipalities and state agencies.

For example, I really enjoy the challenge of modeling species habitat and migration corridors. When you throw climate change into the mix to estimate species range shift by e.g., 2100, it’s a fascinating puzzle to solve. Last month New Mexico DOT announced an exciting RFP to conduct a statewide wildlife corridor assessment. This is something I’ve been trying to get funded for many years. It unfortunately specified the work be done using specific ArcGIS tools. Such a buzzkill.

One of the best marketing strategies Esri has developed is giving their software away for free. A few years ago they gave free ArcGIS Online accounts to all the K-12 schools in the U.S. Similarly there is a Conservation Grant Program at Esri. In 2002 I used it to get a local conservation NGO an Esri license which they still have today. Back then there were fewer options. Today that would seem ridiculous to me. Through this program most of the U. S. based conservation NGO’s have free or greatly reduced Esri licenses. This is also true for tribes. My perception is that many see this as altruistic, but clearly Esri is not benign. It is simply brilliant marketing. Due to this most conservationists are Esri purists. However, I have always felt that NGO’s doing that type of work should be using software that aligns with their organizational ethics. They should be using open data with community produced software whenever possible.

Conservation

I have ruminated for a few weeks on the next bit because it is fresh and involves an organization I have supported for a long time. It also includes friends and colleagues of mine. I’ve rewritten this several times. I finally came to the conclusion I would just share my feeling about my experience.

There is an organization named the Society for Conservation GIS (SCGIS). I’ve been part of this for almost 20 years. Twice I even co-chaired the conference committee. It is heavily sponsored by Esri, but is an independent non-profit. Each summer they hold a conference. It is always directly after the big San Diego Esri UC, usually at Asilomar, near Monterey, California. It is an amazing place, over 100 acres of natural beachfront land. As an aside I’ve always thought it would be a perfect place for a QGIS Hackfest. In recent years the Board expressed the desire to be a more inclusive conference regarding the technology included and sponsorship. As part of that they have invited me each of the last three years to teach QGIS workshops. These days there usually a handful of talks at least partly involving FOSS software.

The first year (2017) I taught QGIS I tweeted this photo. The irony was obvious.

DFRCyRSUIAAJmGW.jpg

SCGIS 2018

The following year when they asked me back they were also in the throes of re-signing an MOU with Esri to sponsor the group for another 5 years. I’m not sure of the amount but it’s a lot. Esri also provides in kind support. Apparently someone at Esri saw this tweet and balked on resigning the MOU. Fortunately it was all smoothed over and the MOU signed. I certainly wasn’t aiming to have the major sponsor withdraw support for the organization.

SCGIS 2019

This used to be one of my favorite conferences to attend. However, over the last several years it has become increasingly uncomfortable. The last two years, I could frequently be found wearing a QGIS or FOSS4G t-shirt. The latter ironically with the Esri logo on the back as a corporate sponsor. I started being the target of snarky rude comments. To some degree I expect and enjoy this. After all, I know most are coming off the high of the big Esri UC. I realize FOSS and Esri people are equally tribal. I then began noticing a trend, people coming up to me whispering under their breath that they use it (QGIS) too. Obviously I wasn’t the only one feeling some tension and hostility. Attendees were hesitant to even say QGIS out loud. It was the Voldemort of SCGIS. The software that shall not be named.

2018 SCGIS Group Photo

This trend of snarky comments continued. I began feeling irritated and defensive. More than one person looked at my QGIS shirt and proclaimed, “I can’t believe you have the guts to wear that here!” The last day I had given a talk on the best new features of QGIS 3.x. At the map gallery that evening a gentleman told me he enjoyed it, and then asked, “Did I hear people razzing you during your talk?” Clearly teaching an alternative was threatening. As a long-standing member of this small community (20 years), to suddenly be treated as an invader, simply because I was teaching a QGIS workshop - which I was invited by the Board to teach - felt really ridiculous and petty. My goal is simply to share some cool tools that most in the community aren’t aware of. I am not trying to get everyone to stop using Pro or ArcMap.

I’ve realized there is still widespread ignorance of what open source is. For example, many are surprised to learn that there isn’t a for profit corporation behind a software like QGIS. A session on what open source is, and what it isn’t would be illuminating for SCGIS.

 SCGIS Scholars Program

An interesting aspect of the conference is the SCGIS International Scholars program. Scholars are first brought to the Esri UC and then SCGIS. They then get several weeks of Esri GIS courses. On the positive side I always find sitting down and connecting with the scholar’s one of the best parts of SCGIS. There are scholars representing most continents, largely from developing countries.

For me there is also something disturbing about the whole program. It can be seen like a big developing world Esri marketing/indoctrination scheme. While talking to them it’s not surprising to learn that many started out using FOSS4G tools like QGIS. I’ve also noticed that my QGIS workshops aren’t attended by people from the major conservation NGO’s (The Nature Conservancy, The Wilderness Society etc.). Rather more than 50% of the attendees are SCGIS scholars. Seems they realize how important FOSS will be in their communities, especially since many started their careers using it.

As with most things it would be fine if Esri just wasn’t quite so heavy handed. This after all isn’t supposed to be an Esri Scholars program but rather the SCGIS Scholars Program. My feeling is that the whole program would benefit if training’s were done using a variety of software packages. Mono-cultures are not good in nature, and this mono-culture isn’t doing these scholars any favors.

Conclusion

I eventually ended up back in my room, writing a long letter to the Board about my experience there. I told them I doubted I would be back. I spent most of my remaining time at the conference processing the experience with friends and colleagues. I had some really good conversations. There is clearly a division on the board between Esri diehards and those looking to be more inclusive. I sat down with the SCGIS president and an advisory committee member and explained my experience. They were extremely gracious and supportive and a bit surprised. My advice was that they create a code of ethics/conduct for the conference, which doesn’t currently exist. I hear that is in the works. I always feel like Sisyphus pushing the rock up the hill. Some days it’s easier than others.

Esri and Me - Part 2 - My Community

Esri and the Local Community

As I go through this history, I am intentionally not using any names and am sticking with my experience.

I’ve always enjoyed participating in the local geo-community. Our local group here is the New Mexico Geographic Information Council. At one point I served on the board for an 8 year stretch (2003-10), including two terms as president (2006 & 2007).

2019-08-16_121244.png

It’s a volunteer led, grass roots GIC. Twice a year it holds a one day conference (spring and fall). It is incorporated as a non-profit. Meetings are funded via memberships, donations and sponsors. They also produce the Map Legend newsletter and offer student scholarships. For our 20th anniversary in 2004 we convinced Jack to give the keynote. I think that still holds the record for the largest NMGIC meeting (I wanted to include the photo but can’t seem to find it.)

SWUG

Also in the southwest U.S. there used to be a conference named SWUG – the Southwest User Group. It was formed right here in New Mexico way back in 1986 as the "Southwest Arc/Info User Group." It included the ARC label because there weren’t too many choices in those days. You basically had Arc/Info, MOSS and GRASS. Below is a scanned brochure of the first meeting. Look who’s giving the opening remarks!

SWAIUGall.png

In the 90's the group was rebranded as "SWUG" and expanded to include Wyoming. Through the years, Esri has set up regional user group meetings in most portions of the U.S. However, ours was the first regional UG, and was not started by Esri. Like most geo-conferences of that era, it was always dominated by talks using Esri tech. Importantly though, with the re-branding came a clear mandate to be an "open" conference and welcome to everyone regardless of their relationship to Esri. For example, I could present on the MapServer web apps we were building.

For me these local conferences were a big part of my professional development. They are where I first started meeting others in the local community and where I gave my first talks…back when I had severe stage fright.

SWUG conferences were always volunteer led community events. The annual SWUG Conference traveled on a five year cycle among New Mexico, Wyoming, Colorado, Utah and Arizona. They were typically 3 day conferences with ~200-300 attendees, complete with workshops and a map gallery. Each state set up a volunteer committee to organize the conference for the coming year with seed money from the previous state's conference. It operated this way, as a grass roots event, for over 25 years. 

SWUG 2007

When it cycled around to New Mexico in 2007, I was one of two Co-Chairs. That is when the NM contingent of SWUG began having concerns about the conference being taken over by Esri. The previous year, Arizona had incorporated SWUG (I still have a copy of that incorporation document!) and had included the following language on the new SWUG website:

All presentation topics must involve the use of ESRI products or that of their authorized business partners and developers. SWUG is a users group conference for GIS professionals who use ESRI software and related products.”

As we began to get organized for the 2007 conference most of our energy wasn’t going into planning. Instead our time was monopolized by seeking answers to questions like:

  • Does the fact that the individual in AZ incorporated SWUG within that state mean that SWUG is considered a formal entity that affects its status in the other states? 

  • Who will participate on the Board?

  • Are we bound to follow whatever regulations and by-laws related to it being incorporated in AZ? 

  • Can we continue to use the SWUG name in the other 4 states?

There were other messy and time consuming financial issues related to the incorporation of SWUG, too deep to get into here. Then there were issues around getting the keys to the new website. Eventually we came to the conclusion that we would run the 2007 meeting as they always had been. We also felt that we might be able to use this opportunity to put in place, a sound governing policy for the SWUG. Our conference that year was held on Halloween weekend in Santa Fe and we came up with cool orange on black tee shirts with a skeleton Kokopelli logo.

It ended up being a great meeting and we were able to pass a nice amount of seed money on to Wyoming for the 2008 edition.

Me opening the 2007 SWUG

Me opening the 2007 SWUG

2007 SWUG Program

2007 SWUG Program

The 2012 SWUG

The conference moved through its five year cycle and in 2012 returned to New Mexico. During that time there were increasing warning signs that Esri was still trying to assume control of SWUG:

  • The 2009 event in CO had been called the "Esri SWUG."

  • Again in 2011 Arizona only allowed talks to be submitted if Esri software was used.

As a previous co-chair, I returned to the planning committee. This year the conference would be held in Albuquerque. Esri asked for a spot on our community SWUG Board. We told them that no vendors were permitted on the board, but that they could be a sponsor. On December 5, 2011 we received an email (I still have a copy of it!) from the regional Esri rep at the time, saying that the Esri event teams were working on potential sites for the 2012 Esri South West Users Conference (Esri SWUC).  The potential towns included: Albuquerque, Santa Fe, Denver and Phoenix. It would be held during the same time as our meeting.

New Mexico has some fight, especially since the group was founded and started right here. We had the institutional memory of the intention behind the conference. We had assumed - even taken it for granted - that all kinds of software, and all kinds of methodologies for exploring geographic issues could and would be explored at our gatherings without bias. This was also back in the days when GIS, Remote Sensing and GPS were separate but related fields. People were also welcome to share on those topics and Esri wasn't a remote sensing or GPS vendor.

We replied that:
We’ll do this as we’ve done for over 20 years, and will let Esri know when we are ready to invite them. Esri needs to understand that this is a User Group event independent of the “company”.  We use the products and convene to share that experience. That was the original intent. For New Mexico and other states, this conference has not been an ESRI event, yet they can participate in any degree as they see fit. Note - we started this in 1986 in New Mexico as SWAIUG. We’ve invited and kept the conference open to anyone who wishes to participate; whether an ESRI Business Partner or not.”

Then they went rogue. Esri organized their competing "Esri SWUC" conference for the same week we settled on, just an hour up the road in Santa Fe, NM. They locked down a domain, set up a web page, and began aggressively competing with our conference.

Esri’s Event and Marketing teams were damn near impossible to compete with. As a result, our community led SWUG had lower attendance and the seed money for the next conference in WY wasn’t what it needed to be. For the 2013 conference in WY, representatives from the five states met and decided they had to let SWUG go. It was re—branded as the "Geospatial Conference of the West." Unfortunately that just didn’t have staying power and was a one off conference.

CONFERENCE COUP

Esri kept the pressure up and their conference team intentionally and aggressively took SWUG over. It was a conference coup! Esri SWUG still exists today but doesn’t happen every year, and only pops up in high population cities. We all know location matters! It no longer travels to each of the original five states, a true loss for our region. For example, it has never returned to New Mexico. Like most Esri events it’s now largely a marketing show instead of a community networking and technology sharing event. Esri successfully killed a community led conference that had thrived for over 25 years.

Perhaps incorporation could have protected SWUG as it has protected NMGIC, but in 2006 it wasn’t set up cooperatively among the five states. It became too difficult to both compete with Esri and come to consensus about by-laws among the participating states. It overly complicated a system that had worked for 25 years.

It was a painful period of time and reading all the old messages brings up all the feelings again. I still harbor resentments about this. When this was happening it took all the joy out of trying to come together and share. I see Esri’s motivation as a business decision, but also feel it was so unnecessary. They could have just participated in our conference and let it be. Esri has a penchant for being way more overbearing and aggressive than is necessary. This is just another example.

These days NMGIC serves the purpose for New Mexico. I regularly participate at that, regularly giving FOSS4G talks. I’m glad to see other community led regional conferences springing up, like the GeoRodeo in Austin, Texas. These are really important in maintaining local geospatial communities.

Esri and Me - Part 1 - Background

One of my main contracts involves authoring a blog for the Community Health Maps program. I helped the National Library of Medicine build this program over the last several years. Apparently this has taken up all my spare blogging time because looking back, I haven’t blogged on my own page in a year! I have a long list of ideas but not much time. For the last 6-8 months my Saturday’s have been taken up writing Discover QGIS 3.x and most recently the soon to be released QGIS for Hydrologic Applications with Locate Press (the latter with Hans van der Kwast).

However, this post has been cooking for a long time and due to events last month at the Society for Conservation GIS conference, I am feeling particularly motivated. I’ll get to that soon, but first I want to give a little of my GIS backstory. I have a lot to say - so this is going to be Part 1 of 3.

Background

I began doing GIS in the late 90’s. Like most who began at that time I learned using Esri tools. I started on command line Arc/Info 7 on a UNIX main frame. I am still grateful to have learned via command line. I became adept at Arc Macro Language (AML’s). Then ArcView 3 was released and I mastered Avenue and built lots of custom applications. Avenue was an Esri language for customizing ArcView 3.

This all happened in Albuquerque, New Mexico. It’s an interesting place, ethnically diverse, poor, and dusty but with a beautiful landscape and weather. For some reason it also has a deep GIS history. These days I’m certain Esri license numbers are 6 or 7 digits long. Interestingly, the City of Albuquerque GIS used to be Esri license #6 and the Earth Data Analysis Center at the University of New Mexico where I worked, was Esri license #9. I’ll admit back in those days I loved calling Esri tech support and giving them our license number. Sometime since, Esri has renumbered those accounts with long 6 digit ones.

FOSS Discovered

Initially I was always more interested in the applications than the tools used. I still am to a large degree. However, that began to change in 2000 when I first encountered open source. In those days I was tasked with building web apps with MapObjects IMS, and the first releases of ArcIMS. If you don’t know what those are, feel lucky. They left a lot to be desired. For example, we’d stand up a site with ArcIMS, and our web services would mysteriously stop each weekend. In 2001, we discovered Minnesota MapServer. Now it’s just called MapServer. It took almost a week to compile from source on our server, but once it was up and running it was really fast and ridiculously stable.

Around that time we also discovered PostGIS which was at version 0.5. It was very early in its development, but it was already very interesting. I began re-building the web apps with Php and Perl using Mapserver, PostGIS and GRASS for processing. The applications were so performant and stable I was sold on FOSS. In 2003 I attended the first Mapserver User Meeting (MUM) in St. Paul, MN. 

A younger me in the group photo from the very first Mapserver User Meeting in 2003

A younger me in the group photo from the very first Mapserver User Meeting in 2003

It felt very subversive and I wondered if Esri had people in attendance. The benefits of using FOSS were obvious. But like most who try to implement non-Esri technology, my office mate and I encountered a massive amount of resistance from the rest of the staff. We constantly had to justify the decision to use these tools. We’d build something that was fast and hit all the needed features, just to have our supervisors mumble something like, “interesting, could you do that in Esri?”. However, we were persistent, and what we built worked. During this time I also attended all the Esri UC’s. But I kept looking forward to the MapServer conferences which eventually evolved into FOSS4G conferences.

In 2004 I discovered and downloaded QGIS for the first time. It was at version 0.7 Seamus. It was cute, but not quite ready to be useful to my work. But I followed with great curiosity as it evolved. I left EDAC in 2008 to launch my own business, Bird’s Eye View. BTW - this was one of the best decisions I ever made. My office mate left shortly thereafter.

When we left, all the web services at EDAC were built on FOSS tech. In the intervening years it has reverted back to an Esri shop. If I’ve learned one thing, it takes a champion to keep FOSS alive in an organization.  

The ASTHO Summit on Climate and Health

During the last week of May I traveled to the island of Oahu in Hawaii to participate in the Association of State and Territorial Health Officials (ASTHO) Insular Area Climate and Health Summit. It was a small intimate meeting organized by ASTHO. It was held at the Ala Moana Hotel with representatives from most of the U.S. territories including:

  • American Samoa
  • Commonwealth of the Northern Mariana Islands
  • Federated States of Micronesia
  • Guam
  • Palau
  • Puerto Rico
  • Marshall Islands
  • U.S. Virgin Islands
  • Hawaii Department of Health 
  • Pacific Island Health Officers Association (PIHOA)

The ASTHO Summit on Climate and Health group photo

The first afternoon was focused on the impacts of climate change, preparedness and building resilience. There were great presentations on climate change (Capt. Barry Choy - NOAA), an overview of the tools and programs available from the CDC (Paul Schramm), and issues around vector-borne diseases and mosquitoes (Janet McAllister). 

Then there were some very humbling and sobering presentations on current issues people are having in the Mariana Islands, Micronesia and the U.S. Virgin Islands. Sea level rise and hurricane recovery were the main topics. I heard first hand, stories of people dealing with climate change impacts now. This was nothing hypothetical. These were real people dealing with catastrophic current impacts. Compounding this were stories of how many islands have such small populations that they frequently fall off federal priority lists.

For example, in Micronesia they are working on a salt water tolerant taro variety. They hope this will help farmers produce food, even with rising seas. The Virgin Islands & Puerto Rico were hit by back-to-back Category 5 hurricanes last September: Irma and then, two weeks later, Maria. Many there are still in survival mode. They used to think of being ready for a week long disaster. They are now planning on months. They need to know basic things, like where all the backhoes are. Climate change is here and the people dealing with the biggest early impacts had very little to do with the cause.

The first afternoon

The second day focused more on tools and resources which was why I was invited. There were more detailed talks given by the CDC on vector control, especially from mosquitoes. That afternoon I taught a 3.5 hour Community Health Maps Train-the-Trainers workshop to a group of health officials from each territory. The idea was that they could train their colleagues once back on their islands. We went through the entire CHM workflow: A) how to design a data collection form using Fulcrum, B) how to collect data using smartphones, C) how to make a map in Carto and D) how to bring the data into QGIS.  

Onasai'i Aulava & Ruta Ropeti from American Samoa learning to use Fulcrum

John Tagabuel from the Commonwealth of the Northern Mariana Islands learning to use Fulcrum

The last morning I taught a second Community Health Maps workshop open to everyone. I had about 30 attendees and again went through the entire CHM workflow.

The week was a reminder of how those of us working with technology day-to-day sometimes take it for granted. Everyone was super excited to have this training. It was also a lesson in how resource rich we are on the continent. One of my goals with Bird's Eye View is to use technology to help make the world a better place. (Thus my focus on conservation, public health and education.) One of the goals of the Community Health Maps program is to empower people with technology. This week fulfilled both and was very gratifying.

Most of the trainees had little to no GIS training yet instantly knew how mapping could apply to their work and lives. They want to map everything related to hurricane relief, salt water resistant taro farms, infrastructure related to mosquito outbreaks etc. A benefit of having the community do this is that they can be in charge of their own data and it helps build community relationships. 

One afternoon the officials from American Samoa wanted to see how well the basemaps available in Carto and in QGIS via QuickMapServices represented their home. I opened up OpenStreetMap and zoomed to Pago Pago, American Samoa. It was pretty feature rich and they were surprised and excited. 

2018-06-25_141334.jpg

During the closing session the ASTHO organizers went around the room and asked people to give their closing thoughts. I was amazed to hear person after person say they wanted more training from Kurt. It was great feedback. There seems to be a lot of potential for CHM, and FOSS4G generally, to help U.S. Territories and ASTHO deal with the immediate and long-term health issues related to climate change.

It felt like making real connections with people was easy. That's the way the best meetings/conferences feel. I hope to travel to some of these islands and teach more in depth workshops to get people really up and running with QGIS. I also plugged FOSS4G Oceania and hope some take advantage of the travel grant program!

Farewell shot with my new friends from American Samoa

My Favorite Features of QGIS 3.0...To Date

logo_evolution2.png

I've spent the last couple months test driving the nightly releases of QGIS 2.99. I have used it in a production environment for paying clients and it works really well. I've crunched data and made maps. So for #QGIS3Eve I thought I'd quickly run through some of my favorite new features. Note: This is far from a comprehensive review. There are many features and tools I just haven't had time to explore and use. I also know there are many new features I'm not even aware of yet. With that caveat here is what I have found useful so far!

Overall the look of QGIS is very similar. (Note that Browser is gone as a standalone application.)  However, upon closer inspection there are a lot of very useful changes. Layer Properties, Project Properties and Options have all been touched up and added to. Probably the first thing you will notice is that instead of there being a row of add data buttons down the left side, there is now a Unified Data Source Manager button which opens up a browser.

Unified Data Source Manager

The Unified Data Source Manager can be used to access the myriad of data formats QGIS supports and add them to QGIS. This includes vector, raster, database, web services etc. You can browse within GeoPackages, SpatiaLite db's, GRIDS, coverages and Esri File Geodatabases. Any GIS layer you are interested in, can then be added to QGIS by dragging and dropping it onto the map. It also includes a connection to the Project home folder (where your qgs file is located) which is super handy.


Styling

There are some new renderers like point cluster and I've heard there are new Geometry generator expression options which is exciting. One feature I am proud to have had a small role in sponsoring is the Paletted/Unique values renderer for discrete rasters! In my conservation work I deal with a lot of vegetation and land use rasters. Now it's possible to quickly and easily give each unique value it's own color. 


The Processing Toolbox

The Processing toolbox was completely redesigned and many tools were rewritten. This means many are now faster, more flexible and stable. There are many new tools that didn’t exist in QGIS v2.x (Topological coloring, plotting tools, Find projection, Execute SQL, Order by expression, Geometry by expression, Add autoincremental field, Advanced Python field calculator are some I've noticed). Additionally processing tasks also now run in the background. This means you don’t have to stop working while a tool runs! Yet another new processing feature is that layers in different projections will automatically be reprojected, so there is no need to reproject beforehand.

ProcessingToolbox.gif


Map Labels:

It now much easier to edit labels. Previously you had to set up attribute columns and set those as data defined overrides. If you don’t know what all that means, it’s OK. Now all you have to do is simply put the layer into edit mode and edit labels with tools on the Label toolbar. This is not only a huge timesaver, it means I don't have to have multiple LabelX/LabelY columns in a layer for different scales and maps. Maps also now redraw more quickly due to cached label renderers.


Search Bar

There is now a universal Search bar in the lower left corner that can be used to search for map layers, features and processing tools. This makes finding things in QGIS quick and easy...although I keep forgetting it's there.


Tables: 

One cool readability feature is that cell contents now auto wrap.

Tables.gif


Select Features by Value:

There is a new Select Features By Value tool which is going to get heavy use. It can be used to quickly find and select features by attribute. Values will autocomplete and a variety of select statements can be used! Once found, you can Flash the feature on the map, zoom to it and use the assortment of Select options. 


Expressions:

The array of functions and variables available in the QGIS, which was already really impressive by 2.14 is now even more so. There are new expression categories like Arrays, Map Layers, and Maps. The Select by Expression window has also been slightly redesigned.


Compositions --> Layouts

The QGIS print composer was completely redesigned. They are now referred to as Layouts. Map insets can now be in a different map projection than the main map. There is a new and improved system of guides which include settings in any unit of measurement you could want (mm, cm, m, in, ft, pt, pica, pix). There are new controls for choosing fonts which include recently used fonts. When you export a map, a link to the folder shows up making it easy to track down the exported map. I also understand that it is now possible to author plugins for Layouts. I can't wait to see what people come up with.


GeoPackage Support!

QGIS 3 now supports the GeoPackage format as the default. This makes them really easy and convenient to work with in 3. This is probably the beginning of the end for shapefiles. You can easily save to an existing or new GeoPackage. This includes output from Geoprocessing tools. There is even a new Package layers tool that ports out all the layers in your project to a GeoPackage!


Other notable enhancements:

  • A fully integrated 3D environment (see below) - I have played with this a bit but not enough to become proficient. I fully expect this to become much more robust in the near future.
  • Editing improvements including: a) widgets for layer attributes, b) CAD style digitizing tools that allow you to create perfect rectangles, circles, ellipses etc. and c) a new node editing tool with a lot of behavior improvements
  • Previews of where each map projection can be used. This will be a big help for beginners!

All in all, it's a seriously impressive amount of work. I am eternally grateful to all the sponsors and developers who made this happen. I can't wait to dig in deeper! Enjoy everyone.

My Harper's Index for 2017

Overview

Number of clients served: 22

Percentage of clients which were new: 41%

Approximate number of maps made: 256

Minimum number of weeks it took me to complete my GeoHipster interview: 10

Percentage of GeoHipster calendar submissions accepted: 50%

Percentage of blogs authored vs the number I hoped to write: 50%

New languages I began learning: 2

Instruction

Number of short courses taught: 10

Number of professional workshops taught: 9

Percentage of professional workshops taught in Europe: 11%

Percentage of professional workshops taught in my city: 11%

Maximum number of semester long FOSS4G courses taught: 1

Travel

Number of US States traveled to: 7

Minimum number of Scandinavian countries visited: 3

Number of flights boarded: 34

Total kilometers flown: 55,783

Conferences

Number of professional conferences attended: 7

Ratio of conference talks given to conferences attended: 6/7

Ratio of conference workshops taught to conferences attended: 3/7

Average number of hours of a conference workshop: 5.3

Ratio of conference workshop taught to those taken: 3/4

Personal

Number of oceans I saw whales in: 2

Number of social networks I have accounts with: 7

Number of social networks I abandoned: 1

Number of new social networks I tried: 2

Number of coffee roasters bought beans from: 24

Proportion of coffee roasters tried that were Scandinavian: 5/24

Number of coffee shops visited: 22

Fitness

Total workouts done: 175

Distance walked: 723mi / 1,163km

Calories burned: 107,000 kCal

Weight of my best deadlift: 375lb / 170kg


Mapping King Tides in Post-Irma Miami

In the last three weeks I've flown to Miami twice, each time for the Community Health Maps (CHM) project. This is a project I've been working on for years. The goal is to empower underserved populations with low cost, intuitive mapping tools. The work is funded by the National Library of Medicine.

I went to Miami specifically to support an already established coalition of organizations working to document the impacts of king tides and help the communities being impacted. The focus was on one particular community, Shorecrest, who's residents are feeling the effects twice a day. "King tide" is basically a popular term for the highest tides of the year. It is sea level rise in action. The groups involved include: New Florida Majority, Florida International UniversityResilient Miami, and Unitarian Universalist Justice Florida.

We had been planning these two trips since summer to coincide with the September and October king tides. The plan was to support the community by training them in how to map these king tide events and their impacts. Then Hurricane Irma hit. I wasn't sure what to expect. Would it be more useful to help people document the effects Irma had on their neighborhoods?  Would people even have time to deal with the king tides in the aftermath of Irma?

When I first landed on September 17th it had only been six days since Irma had blown through. On the surface things looked almost normal. There was very obvious little structural damage. The visible damage from the street was piles of brush and debris on everyone's curb. The hotel was full of relief workers, mostly tree trimmers. Packing for these workshops were also a little different. I expected the water to be polluted, and it was also hard to know what the power situation would be in the neighborhoods I would be visiting. So I brought rubber boots, gloves, a face mask, portable chargers and a water purifier. 

We ended up going ahead with the initial plan. Collectively it was decided that there are often numerous variables involved in king tides such as storms. So the data would still be useful and it would be good practice for the community. Plus we might learn if there was more bacterial contamination resulting from the hurricane.

I thought this effort would be a perfect use of the new Fulcrum Community accounts. So Susan Jacobson from FIU applied for an account. It was immediately granted and we ended up using that. Jacobson and Tiffany Troxler from FIU, and Jan Booher from UU had already developed a water sampling protocol. They had refractometers for measuring salinity and bottles for collecting water samples. The bottles had a reagent in them that would tell us whether the samples were infected with bacteria such as coliform.  They also had yard sticks for measuring flood depth.

A King tide data collection kit

Two days ago I returned from the second trip to Shorecrest. Over the two trips I conducted several workshops with: people living in Shorecrest, students at FIU and community leaders. Using Fulcrum Community allowed me to focus on data collection with the community members. The only tech piece involved showing them how to use the Fulcrum app on their phones. That allowed our team to spend more time teaching about the actual water sampling protocol. Following that I taught a more involved workshop to the community leaders. There I showed how to manage the data and map it via QGIS and Carto. Going forward it will be their project to manage and I'll just serve in a support role. On October 7th there were dozens of people out collecting data!

Residents mapping and sampling King tides

The interesting thing about King tides is that they can come up via storm drains. The Shorecrest neighborhood we worked in is close to the coast, but not right on the coast. However, it is in a particularly low lying portion of Miami. During these king tides water comes up through these storm grates two times a day, flooding the streets, driveways and yards up to 2-3 feet in depth. The water is saline and initial water samples show that most has some level of bacterial contamination. The video below shows the flooding on October 7th at the intersection of NE 78th & 10th streets. 

Recently there have been some heavy rains saturating the soil and creating minor flooding in low lying areas. On October 7th the twice daily tidal flooding just added to it. The king tide water came up through the storm drains, cracks in the asphalt and the ground. The water rose up to knee level in a little over an hour. It flooded the Little River Pocket Park, streets, peoples driveways and yards. Trash piles from Irma are still there and are now potential sources of bacterial pollution. Most residents are also still dealing with mold and flood damage from Irma. It is not a good situation. Below are some before and afters that show the situation: 

Little River Pocket Park - before

Little River Pocket Park - during king tide

Before...

During king tide

Before...

During king tide

It was really powerful to be dropped into this community of Shorecrest, meet real people with real problems, and be able to help in some small way. My goal has always been to use the technology to help make the world a better place. I've also always been an activist. This work felt good from both perspectives. Disasters always affect poor areas the most and this is no different. It's a pretty grim situation that isn't getting much press. I'll be following up with some results in the near future, building on the initial map below.

FOSS4G 2017 Boston

On Sunday the 13th, I flew from Copenhagen to Boston to attend FOSS4G. It was a long flight, and after two weeks it was a transition from Europe to the US. It was also a transition from a small intimate QGIS conference in Denmark, to the biggest FOSS4G ever in a busy part of Boston.  

FOSS4G didn't disappoint. Monday began  with an impressive line up of pre-conference workshops. I took workshops on R, GRASS, PostGIS and Inkscape with QGIS. I was a little delirious from jet lag, but they were all really well paced and well taught. I really appreciated the materials being posted online, because I have more homework to do. Plus as usual I didn't get to attend all the ones I wanted to. 

Regina Obe set up a table for FOSS authors to sell and sign books. Since I was in Denmark, I pre-ordered my books from the publishers and had them shipped to Paragon. I wasn't sure what to expect and didn't want to be left with a ton of books to lug back to New Mexico. As it turned out I should have ordered more. I ordered 10 each of my two books and they almost sold out at the first break. I was really surprised. 

During the week I sat on a panel (What the Heck Does an Open Source Job Look Like Anyway?) with Sara Safavi, Rob Emanuele,  and Katrina Engelsted. Like the conference, the panel discussion went by really fast. I also gave three talks. One talk was on the Community Health Maps initiative I've been working on. For another I presented for a client who couldn't make it. It covered teaching earth sciences with open source GIS. I also co-presented on the State of QGIS with Larry Schaffer. 

As is usually the case, the people were the best part. It was fun getting to meet new people, people I've known of but never met, and reconnecting with old friends. For example, I was checked into the conference by a client of mine who I'd only spoken with on the phone, and the week kept rolling like that. There were about 6 of us who traveled from Denmark to Boston. It seemed we kept hanging out together in Boston, still in a Nødebo high.

It was a really well planned conference. Everything ran like clock work. There was always someone nearby to help answer a question. Kudos to the conference committee on a job well done! Now I'm about to head out to teach a workshop at Yale and another in Miami. No rest for the weary. Stay tuned!

Another Wonderful QGIS Conference/Hackfest/Developer Meeting in Denmark!!!

There's something notable in Nødebo. From August 2-10 The third QGIS User Conference, Hackfest and Developer Meeting was held in Nødebo Denmark at the University of Copenhagen – Forest and Landscape College (Københavns Universitet Skovskolen). I was fortunate to attend, as I did in 2015. The first two days were the users conference, then there was a 3 day hackfest followed by 4 days of workshops.

It was another intimate meeting with 120 people from 29 countries and 6 continents! My wife and I were the only Americans to attend the user meeting. It was really nice to have my wife and business partner along. This in fact became a theme of the meeting. Many brought their spouses/partners and kids. It felt more like a QGIS family gathering than a "conference".

Since we are all staying on a small campus and eating all our meals there, it creates a real bonding atmosphere. There were numerous opportunities to connect with others throughout each day. It is the best community building atmosphere I've experienced at a conference. The QGIS family is very warm and inviting. I think this is part of the reason QGIS is such a successful project. I got to catch up with old and dear friends/colleagues and meet many new ones.

Many of the talks were given by developers and we were updated on the state of QGIS. Topics included QField (Matthias Kuhn and Marco Bernasocchi of OpenGIS.ch), a native QGIS 3D renderer (Martin Dobias of Lutra Consulting), the InaSafe plugin (Tim Sutton of Kartoza), QGIS Web Client 2 (Andreas Neumann). There were some short workshops in this section including a nice overview of LASTools by Martin Isenburg. Then Nyall Dawson (North Road) gave a truly memorable presentation Exploring the Depths of Madness with QGIS Symbology that I'm still trying to wrap my brain around.  Interspersed throughout the program were many presentations  highlighting local initiatives involving QGIS and several research projects. Tim Sutton just authored a much more complete accounting of the talks at the conference with video clips. You can find it here.

The environment at the Skovskolen is full of the feeling of Danish hygge. This is largely due to the hard work and gracious hosting of Lene Fischer. The meals are better than any I've had at any other conference by a large margin, and the local staff and students are warm and welcoming. We had a chatted with students Asbjørn, Ras and Frederik. Each night there was a gathering at the local watering hole Flaeken, with nail game challenges and fuzboll. I miss the nail game. It's a Skovskolen tradition involving pounding nails into a large stump. 

On the final day I taught a full day workshop on Cartography and Data Visualization in QGIS. The attendees were from 9 different countries. What I gave was a tour of the many great data visualization tools available in QGIS.

Data Visualization and Cartography with QGIS

I covered the print composer introducing some tips and tricks along the way and a section on Atlas generation. I then covered the many renderers now available, highlighting the 2.5D, Geometry generators, point displacement and showing some use cases for the popular inverted polygon shapeburst fills. I also covered some plugins such as QGIS2ThreeJS and the Time manager and use cases for different Blending modes. 

I sadly missed the group photo taken near the end of the hackfest taken by Maryanne Dawson. Sarah and I took some days in the middle to have a holiday. We rented a place in Copenhagen and flew to Oslo one day to visit the Viking Ship Museum. 

QGIS 2017 Group Photo by Maryanne Dawson

To top it off, on the final night Sarah and I were taken to a performance of Hamlet at Kronborg Castle. This is the castle that was the model for Elsinore in Hamlet. The performance was phenomenal including some interesting modern elements like cell phones and helicopters. If that weren't enough it was staged right next to the moat outside the castle complete with swans and full moon rising. There was nothing rotten in Denmark and I cannot wait until next time! From there we flew to Boston to attend FOSS4G. I'll report on that next!

A QGIS Workshop at the Society for Conservation GIS (SCGIS)

Last Sunday I taught a full day Introduction to QGIS workshop at the 2017 SCGIS conference in Pacific Grove, California. While I've taught this course many times before, this class was particularly unique because SCGIS, although an independent non-profit organization, is heavily sponsored by Esri. In addition, Max Wright with Conservation International, also taught a QGIS workshop entitled An Introduction to Predictive Land-use Change Modeling using Open-source Software, making 2 of the 4 workshops at SCGIS QGIS based. Certainly a first! 

A QGIS workshop at an Esri sponsored conference?!

A QGIS workshop at an Esri sponsored conference?!

My workshop was sold out with a waiting list and I eagerly anticipated meeting the participants. Almost universally attendees were either:

  • Mac users and/or
  • Looking for work and wanting some new skills

I expected there to be some ArcGIS power users from established conservation organizations who were just curious about QGIS, but there wasn't anyone who fit that description. 

Overall QGIS was very well received. During the morning session I introduced FOSS and QGIS, showed how to add and style data and create a map. At lunch one attendee said,

"I have about 10 pet peeves with ArcMap, and you just answered 7 of them with QGIS!"  

During the afternoon session I covered plugins, geoprocessing, the Graphical Modeler and how to get help/resources. If you missed it, all the workshop materials can be downloaded here.

One of the most interesting aspects of SCGIS is their International Scholar program. In attendance were a couple dozen scholars from around the world. I met people from Barbados, Zimbabwe, Madagascar, Brasil, Columbia, The Gambia, Bangladesh, New Zealand, Pakistan, and Zambia. It was really fun connecting with people from such different places working on conservation.

Then there was the location. We were at the Asilomar Conference Grounds on the Monterey Peninsula. The waves on the beach could be heard from our room and each night I went out to the beach to enjoy the sunset. I also had time to visit the Monterey Bay Aquarium and go on a whale watching tour!

One thing I realized is that many don't seem to look far beyond the Esri ecosystem for geo-tools. I've been an Esri user for 20 years, I get it. There are some great products in the stack. However, I hope more SCGIS'ers eventually venture to a FOSS4G conference. I think it would be immensely helpful to their work. The set of FOSS tools discussed there is so broad and interesting. Afterall GIS is just a tool, why not have a bigger set of tools to work with? Certainly having two QGIS workshops at SCGIS is a step in the right direction. 

I had some discussions with another SCGIS attendee about doing a workshop next year on how to work with LandFire products with QGIS. I'll keep you posted on that.  Next up is the 3rd QGIS User Meeting/Hackfest/Developer Meeting in Nødebo Denmark where I'll be teaching a full day workshop on Data Visualization and Cartography in QGIS!

Apparently It's Conference Season!

I don't think I've ever been to back-to-back conferences and this summer I'm going pretty much back-to-back-to-back. The best part is that they are all in great locations.

First up I'm giving an Introduction to QGIS full day workshop at the Society for Conservation GIS (SCGIS) conference. The location can't be beat. It's at the Asilomar Conference Center, located on the coast just outside of Monterey, California. Historically this has been an esri-centric group so it's an exciting opportunity to show conservationists how far QGIS has come! I've been told the workshop is sold out with a waiting list.

The main presentation hall at Asilomar

The main presentation hall at Asilomar

I'll be home for a little less than a week. Then I head to the 2017 QGIS Users Conference in Nødebo, Denmark! Lene Fischer produced the video below if you want to know where it is and how to pronounce it :)

In Denmark I'll be teaching another all day workshop. This time the topic will be Data Visualization and Cartography in QGIS.  I'll cover the myriad of great data visualization techniques now available in QGIS including the QGIS2ThreeJS and Time Manager plugins. I was there in 2015 for the first QGIS User Conference and it was a great experience...I highly recommend it. The first few days will be the Users Conference, then there is a Developer meeting and it closes the second week with the Workshops. I'll be heading down to Copenhagen in the middle for a few days to be a tourist. 

2015 QGIS Conference in Nødebo Denmark

From Denmark I fly back to Boston for FOSS4G. I'll be participating in 3 talks and a panel discussion. It will be great to catch up with the #gistribe & #spatialcommunity folks face-to-face. After 3 weeks on the road I'll then fly home. It's going to be an adventure. 

I'll post links to my workshop presentations afterwards and I'll probably write a few summaries once I've recovered.

Teaching QGIS is a Labor of Love

I love teaching QGIS and FOSS4G and I've been doing it a long time. I developed and taught my first semester long Intro to Open Source GIS course in 2009 featuring QGIS v1.0 Kore. In 2014 I co-authored the GeoAcademy curriculum and that led to opportunities to publish several QGIS books. In the last few years I've developed a FOSS public health curriculum with the National Library of Medicine (Community Health Maps). 

I've taught for a lot of schools both face-to-face and online. Plus I've taught countless of workshops all over the U.S. In fact because of the books and the GeoAcademy I have so much material I can assemble a workshop pretty quickly. Teaching...I think I'm pretty good at it. I truly love turning students onto QGIS, especially after they've been indoctrinated into the world of geospatial via Esri. Seeing those light bulbs go off is awesome. Lately my favorite demo is showing students a street reprojecting race between ogr2ogr and ArcMap. It blows minds. Spoiler alert: ogr2ogr wins.

For better or worse I always need to temper my teaching schedule. First of all, it is a lot of work to maintain and update material, and that part is always volunteer. More importantly though, my bills are paid with consulting. Teaching takes time and I need to have enough time to do my consulting work. Plus I like 'doing' more than teaching. There are various ways to teach: there are face-to-face courses at the local colleges and universities, there are online courses on various platforms, there's authoring books, and there are professional training workshops. I've done a little of each.

The local colleges and universities just don't pay part-time instructors well enough. While I wish it were different, I've known this is the reality for a long time and accept it. But I do occasionally teach courses. When I go into teach at a school I just focus on the material and the students. It feels like an act of service. Giving back to the community. I'm cool with this aspect of it. I never wanted to be a full time academic.

Now there are platforms like Udemy where you design a course and make $10 per student. If one went viral you might get a small income, but I'm not sold on that model. Authoring books is good for street cred, but they are a lot of work and have a really short shelf life.

Recently I've been interested in helping agencies and organizations migrate to a FOSS/hybrid workflows. I'm well positioned knowing Esri and FOSS equally well. It's here that I've noticed something interesting. My local State and Federal agencies seem willing to fork out whatever Esri demands for training. However, when it comes to learning QGIS people seem to just want it for free, or close to it. Recently at a local GIS meeting I had a casual conversation with someone wanting to learn QGIS. He then actually said, "You'll come teach us at our office for free right?" 

Part of my work with the Community Health Maps project is teaching a Fulcrum/QGIS/Carto workflow to public health workers. These workshops are all free as they are subsidized by the National Library of Medicine. I've taught dozens all around the nation. People get really excited and afterwards they often talk about getting more training. However, when it comes to signing an actual contract they balk, and believe me I'm a good deal. I'm not trying to get rich. Meanwhile I continually hear about local agencies signing up for Esri workshops costing them hundreds or thousands per student. 

This trend exists for both face-to-face or online training. The GeoAcademy courses have always existed for free online. When we attempted to teach instructor led GeoAcademy courses online we couldn't get anyone to enroll unless courses were offered for $25 or less. The school wasn't even breaking even at that rate. So needless to say the offering didn't last long. I guess when a Udemy course goes for $10 it's a hard sell. But these were instructor led courses where a teacher was available to answer questions, provide feedback and grade labs. 

There seems to be some dynamic, at least in the States, where people know the software is free of charge so they shouldn't have to pay to learn it. I think the open source business model still confuses mainstream GIS users. It also tells me that people see little value in being able to teach it. I know teaching has never been a lucrative profession. However, the fact that people seem willing to pay Esri so much for training makes me wonder what's going on. For now l see it as a labor of love.

A Photo Journal of a Weekend at an Earthship in Taos, NM

This past weekend my wife surprised me with a birthday weekend at an earthship in Taos, New Mexico. It was originally built for actor and activist Dennis Weaver and was completely off the grid. A carbon negative building. All the water is collected in huge cisterns from rainwater, and electricity is from solar. It was built on a steep slope outside of Taos Ski Valley at 8,500'/2,590m. I created a super quick map of where we were. Last Saturday we drove the High Road to Taos to get up there from Albuquerque.

Storms rolling in over the Sangre de Cristo's while we ate lunch in Truchas

We rented it via Airbnb, and the host met us in the valley below Arroyo Seco. The first thing the host told us was, "I'll stop where you'll need to switch into 4wd low." We drove up on the high road to Taos.  Below is a video of us driving up the final bends to the earthship.

Drive up to the earthship

The views of Taos valley and Pueblo Peak were amazing from the front porch.

The view from the front porch!

Above are shots of the main living area looking west (left) and east (right). All the gray water feeds into the flower beds.

The central stairs up to the bedrooms

The bathroom behind a bottle wall

The living room

The living room

Uploaded by geomenke on 2017-05-12.

There was a private trail heading up the ridge. So Sunday afternoon we took a walk. Got about 1,000' above the house before it started getting stormy. With an early enough start we could have made to Lobo Peak. I had to have a few maps in here.

Looking south towards Pueblo Peak

Sunset on the front porch

Sunset on the front porch

On the way back we drove over the Rio Grande Gorge Bridge. At this point the gorge is 565'/172m deep. There was a small herd of bighorn sheep hanging out at the rest area! From there we headed south to Pilar. It's one of the most scenic routes in New Mexico. You drop into the gorge and follow the Rio Grande . We saw several more herds of bighorn sheep along the way.

Rio Grand Gorge looking north

A heard of bighorn sheep who were hanging out near the rest area!

A heard of bighorn sheep who were hanging out near the rest area!

Dropping down into the gorge looking southeast

The Rio Grande

The Rio Grande

Can you spot the two bighorn sheep?

It reminded me why I love living in New Mexico!